Social Media Flowchart Symbols
Social media is a popular view of mass communication which allows people, companies and organizations create, share, discover, modify, access, comment, discuss and exchange information through the Internet. Social media are the group of Internet-based applications that work in a dialogic transmission system - many sources to many receivers. This and also such distinctive features as usability, quality, interactivity, multimedia, quick accessibility, unlimited volume, and ability to track the popularity much differ the social media from the industrial and traditional media, such as newspapers and television.
Social media are websites that allow easy create communities around shared interests. There are many types of social media: blogs, microblogs, forums, social networks, wiki-projects, business networks, review sites, dating sites, photo hostings, video hostings and many others.
Use of powerful tools of ConceptDraw's Social Media Response solution lets effectively represent what is the social media, lets improve quality of content in social media and to build an active customer community, helps the companies to be more effective in timely messaging thanks to the excellent ability for rapid response to a customer′s posts in social media. This allows greatly save the budget for companies who use social media for promotion, marketing and as a lead generation tool.
Social Media Response solution provides collection of 10 libraries with diversity of predesigned vector social media flowchart symbols for fast and easy creating interactive Social Media Flowcharts, Response Charts and Action Mind Maps.

Sample 1. Social Media Flowchart Symbols
Follow the next steps to fast and easy create a Social Media Response flowchart in ConceptDraw DIAGRAM software:
- Start with the predesigned income element from one of desired libraries of the Social Media Response solution. Drag the income symbol on the document page and type its text.

Example 2. Adding Income Symbol
- Add step-by-step the needed decisions, actions, issues, yes/no and many other elements from the Social Media Response solution libraries or using the RapidDraw feature. To activate the RapidDraw mode use the Rapid Draw button on the Shape toolbar.

Example 3. Adding objects with RapidDraw
- The object created with RapidDraw arrows will be automatically connected to the selected object. Another objects you can connect with help of ConceptDraw connector tools from the libraries or Home toolbar. Add the rest objects, connect them and make color style changes, if needed.

Example 4. Bank Social Media Response Flowchart
Social Media Response solution includes also a number of professionally developed templates and samples which are perfect examples and the source of inspiration capable to help social media teams, consultants, trainers and other people which are related with social media to develop effective social media strategies, to correctly organize the response process and to educate the social media groups how to effectively accomplish their daily work.
 Template")
Social media Flowchart (Black & White) Template
 Template")
Social media Flowchart (Light) Template
 Template")
Social media Flowchart (Strong) Template
All Social Media templates and samples developed for ConceptDraw DIAGRAM are available for viewing and editing from ConceptDraw STORE.

Example 5. Social Media Response Solution
Thanks to the Social Media Response solution, the ConceptDraw DIAGRAM diagramming and vector drawing software is rich for professionally designed samples, examples, templates and ready-to-use social medial flowchart symbols which can help you quickly design the Social Media Flowcharts and Diagrams of any complexity. Each of your diagrams can be then easy printed, exported to various formats, including PPT, PDF, MS Visio, HTML, and many other graphic formats.
TEN RELATED HOW TO's:
When describing any computer network, we imagine a set of devices and nodes, arranged in some way. Talking about network structures, we should distinguish physical and logical network topologies, as physical topology is about devices location and logical topology illustrates data flow. In the same time, they do not have to match, and some devices, such as repeaters, may have a physical star layout, but a bus logical topology.
There are two main types of computer network topologies: Physical topology that show the physical organization of a network - equipment and types of connections. Star network topology involves a set of devices that is connected to a single hub (router). Ring network topology means that, devices connected according this topology have two connections, connecting with nearby devices to make a loop. Bus network topology is the topology presented at the current diagram. It is similar to a ring topology. The difference is that data moves up and down a linear connection, copying itself where network equipment works as bus-stations along the way. This network topology can be used for small network, or when adding an extra device into a network.
Picture: Network Topologies
Related Solution:
For vector shapes and connector tools for quick and easy drawing diagrams for business, technology, science and education - The best choice for Diagramming is ConceptDraw DIAGRAM.
Picture: Diagram Software - The Best Choice for Diagramming
Event-Driven Process chain Diagrams for improvement throughout an organisation. Best software for Process Flow Diagram. The Event-driven Process Chain (EPC) Diagrams allows managers to plan processes and resources.
Picture: Business process Flow Chart — Event-Driven Process chain (EPC) diagrams
Related Solution:
This sample shows the Horizontal Bar Chart of the average monthly rainfalls.
This sample was created in ConceptDraw DIAGRAM diagramming and vector drawing software using the Bar Graphs Solution from the Graphs and Charts area of ConceptDraw Solution Park.
Picture: Rainfall Bar Chart
Related Solution:
ConceptDraw DIAGRAM extended with Divided Bar Diagrams solution from Graphs and Charts area of ConceptDraw Solution Park is the best software for quick and simple drawing the Divided Bar Diagrams and Bar Diagram Math.
Picture: Bar Diagram Math
Related Solution:
ConceptDraw DIAGRAM software provides vector shapes and connector tools for quick and easy drawing diagrams for business, technology, science and education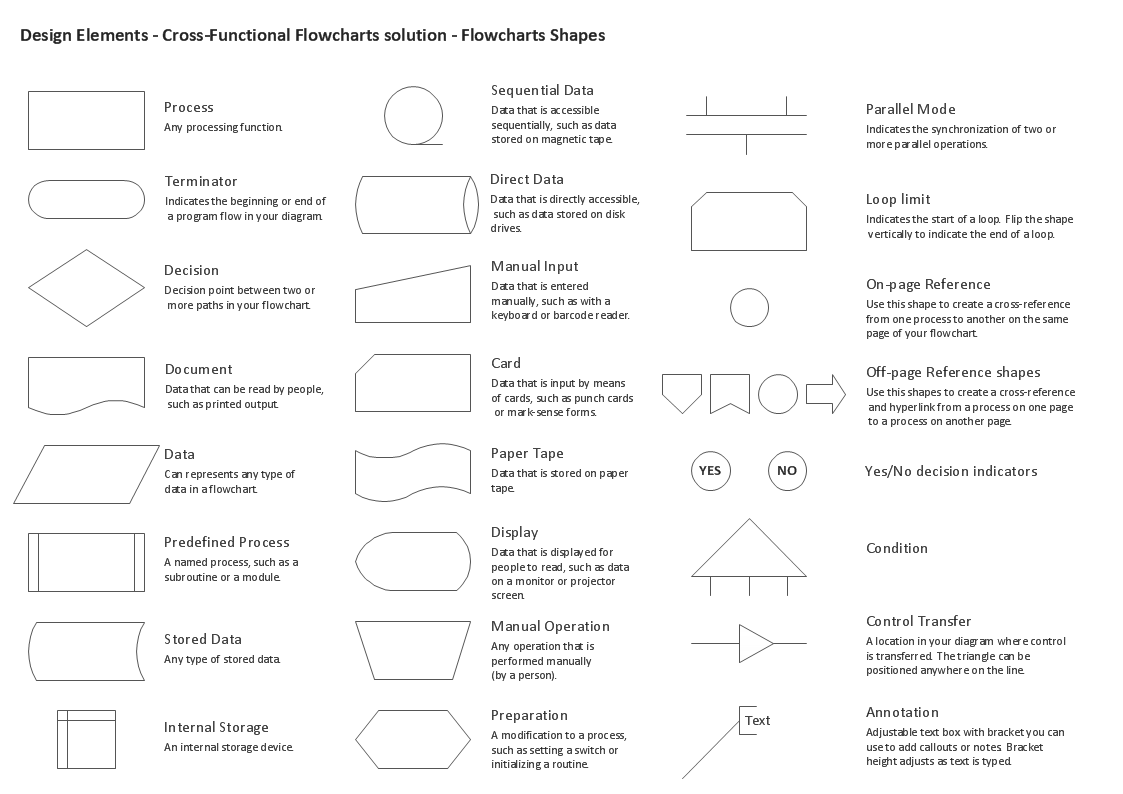
Picture: Cross Functional Flowchart Shapes Stencil
This sample shows the Flowchart of the ACC general account creation. This Flowchart describes the Start point, the process of the handling the user requests and the End point – creating of the account. The shapes represent the subprocesses and the arrows between the shapes shows the sequence of the actions.
This sample was created in ConceptDraw DIAGRAM diagramming and vector drawing software using the Flowcharts solution from the Diagrams area of ConceptDraw Solution Park.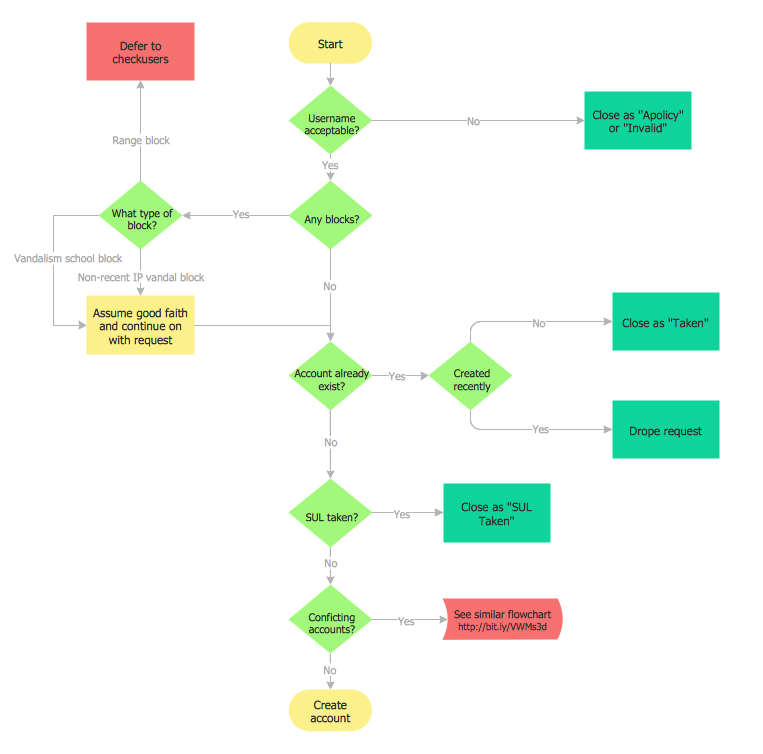
Picture: Examples of Flowchart
Related Solution:
The vector stencils library from the solution Information Model Diagrams contains specific data type symbols of the EXPRESS-G notation such as entity data type symbols, simple data type symbols, enumeration data type symbols, defined data type symbols, select data type symbols and specific attribute symbols for ConceptDraw DIAGRAM diagramming and vector drawing software. The Information Model Diagrams solution is contained in the Software Development area of ConceptDraw Solution Park.
Picture: Express-G Diagram
Using diagrams, you can visualize the flow of the information or build a detailed data structure. There's no need to have a degree in software and database design with ConceptDraw DIAGRAM , because this software has all the tools needed in developing models and diagrams. Project planning, designing and prototyping was never so easy.
This UML diagrams can be used to visualize a model of the data base development process. A UML diagram shows a graphical view of a structure of software system: components and relationships.
Using Unified Modeling Language helps to depict logical and physical elements of a data base, visually represent requirements and sub-systems. UML diagrams allows developers to organize and predict critical issues, as well as collaborate data base information.
Picture: Software and Database Design with ConceptDraw DIAGRAM
Related Solution:
Sequence Diagrams shows how objects communicate with each other in terms of a sequence of messages. Also indicates the lifespans of objects relative to those messages.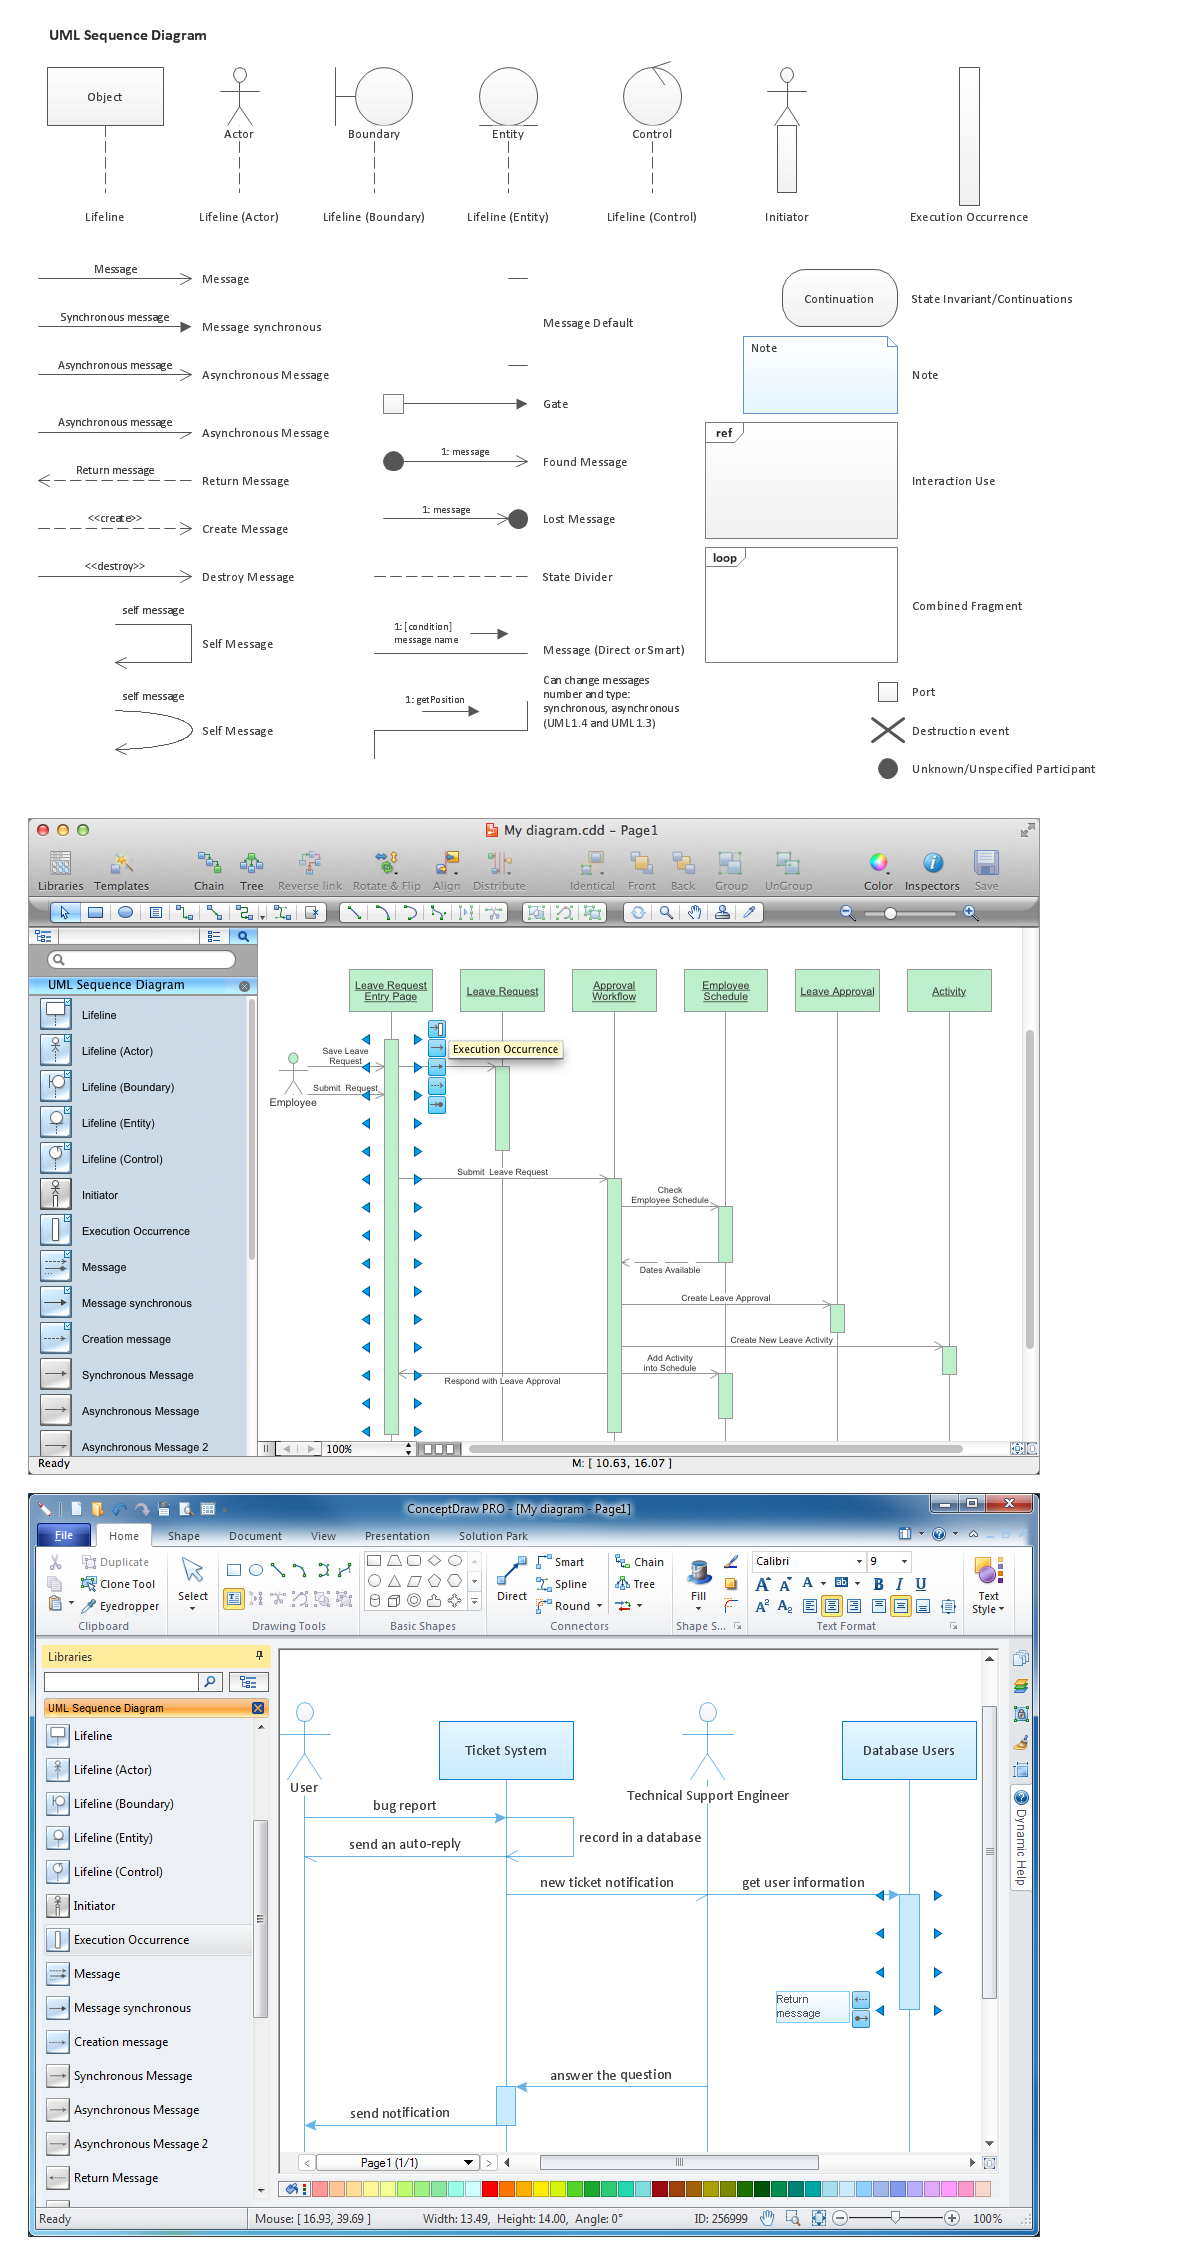
Picture: Diagramming Software for designing UML Sequence Diagrams


 Template") Social media Flowchart (Black & White) Template
Social media Flowchart (Black & White) Template
 Template") Social media Flowchart (Light) Template
Social media Flowchart (Light) Template
 Template") Social media Flowchart (Strong) Template
Social media Flowchart (Strong) Template
