How to Create a Pie Chart
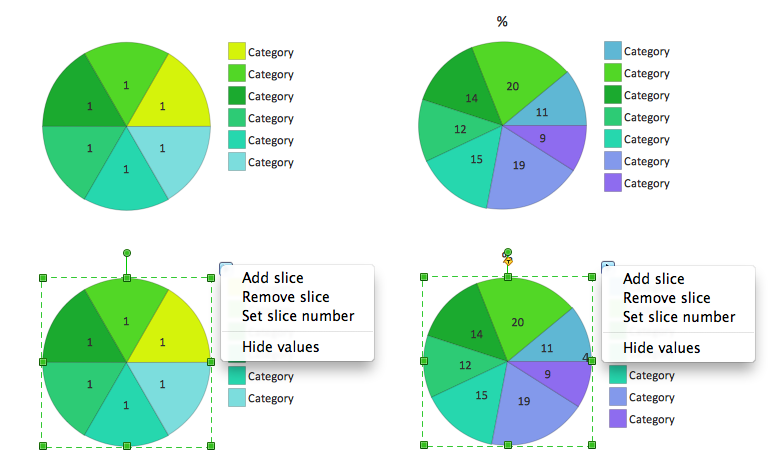
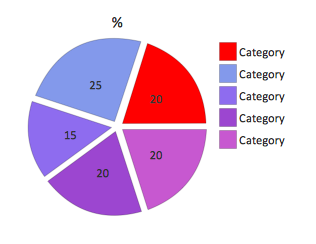
Pie chart and Percentage pie chart shapes.
- Drag and drop Pie chart or Percentage pie chart shape from the library to your document.
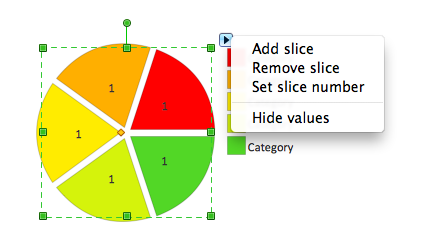
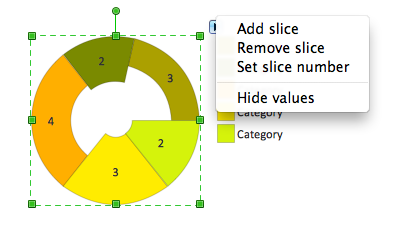
- Select the shape by mouse click. The Action menu triangle icon appears.
- Click on the triangle icon to open Action menu.
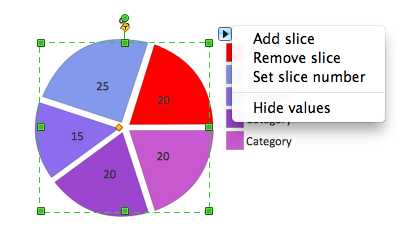
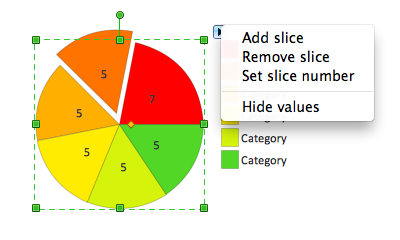
- To change slice number use Action menu commands Add slice, Remove slice, Set slice number.
- To hide or show values in the slices use Action menu command Hide/Show values.
- To change value in a slice select chart, then select slice and type new value.
- To add or change chart caption select pie chart and simply start typing.
- To set category names select pie chart, then select legend, and then select a category and start typing.
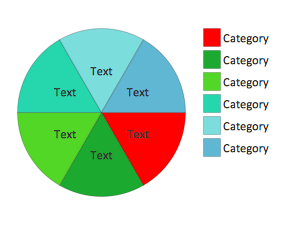
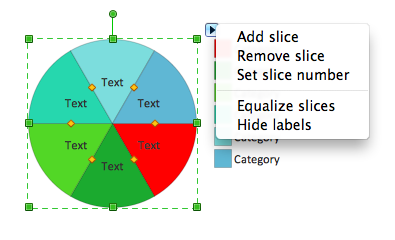
Pie chart, control dots shape.
- Drag and drop Pie chart, control dots shape from the library to your document.
-
Select the shape by mouse click. The Action menu triangle icon appears.
- Click on the triangle icon to open Action menu.
- To change slice number use Action menu commands Add slice, Remove slice, Set slice number.
- To hide or show labels in the slices use Action menu command Hide/Show labels.
- To change label in a slice select the pie chart, then select slice and type new label.
- To change anglular size of the slices select the pie chart and use control dots.
- To equalize anglular sizes of the slices use Action menu command equalize slices.
- To add or change chart caption select the pie chart and simply start typing.
- To set category names select the pie chart, then select legend, and then select a category and start typing.
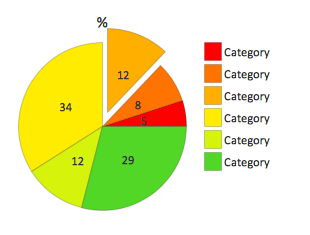
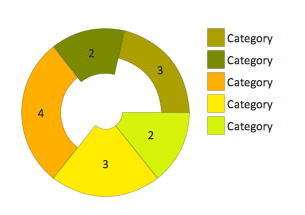
Separated pie chart and Percentage separated pie chart shapes.
- Drag and drop Separated pie chart or Percentage separated pie chart shape from the library to your document.
- Select the shape by mouse click. The Action menu triangle icon appears.
- Click on the triangle icon to open Action menu.
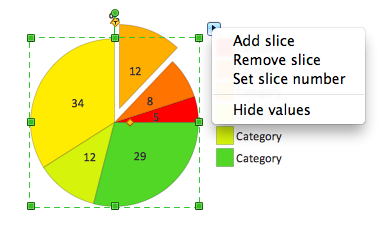
- To change slice number use Action menu commands Add slice, Remove slice, Set slice number.
- To hide or show values in the slices use Action menu command Hide/Show values.
- To change value in a slice select the pie chart, then select slice and type new value.
- To add or change chart caption select the pie chart and simply start typing.
- To set category names select the pie chart, then select legend, and then select a category and start typing.
 |
 |  |
 |
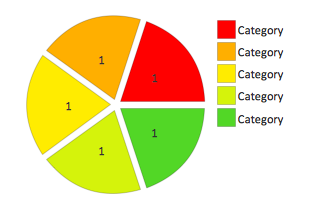
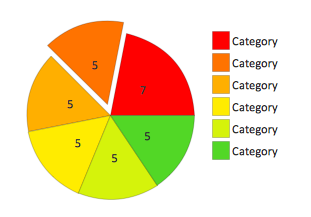
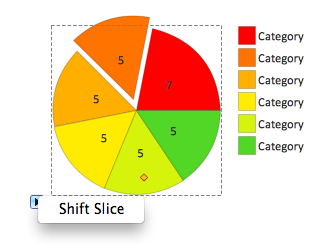
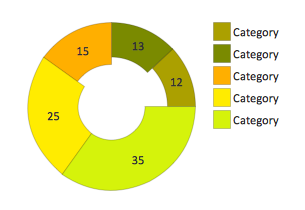
Pie chart with shifted slices and Percentage pie chart with shifted slices shapes.
- Drag and drop Pie chart with shifted slices or Percentage pie chart with shifted slices shape from the library to your document.
- Select the shape by mouse click. The Action menu triangle icon appears.
- Click on the triangle icon to open the Action menu.
- To change slice number use Action menu commands Add slice, Remove slice, Set slice number.
- To hide or show values in the slices use Action menu command Hide/Show values.
- To change value in a slice select the chart, then select slice and type new value.
- To shift or fix a slice select the pie chart, then select the slice, click on Action menu icon, then use command Shift/Fix slice.
- To add or change chart caption select the pie chart and simply start typing.
- To set category names select the pie chart, then select legend, and then select a category and start typing.
 |
 |
 |
 |
 |
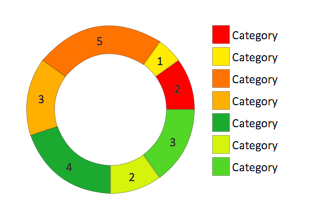
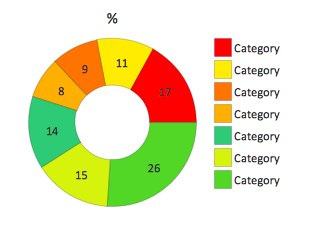
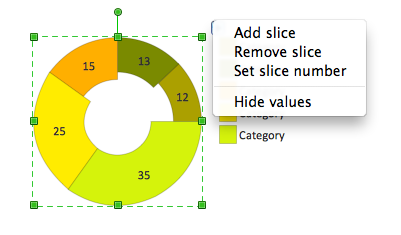
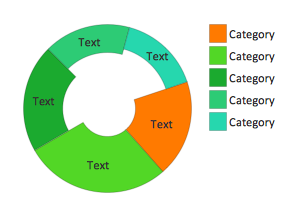
Ring chart and Percentage ring chart shapes.
- Ring chart also known as donut or doughnut chart.
- Drag and drop Ring chart or Percentage ring chart shape from the library to your document.
- Select the shape by mouse click. The Action menu triangle icon appears.
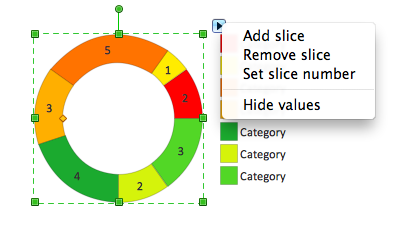
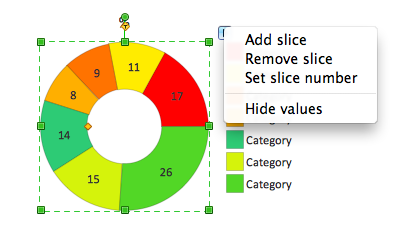
- Click on the triangle icon to open the Action menu.
- To change slice number use Action menu commands Add slice, Remove slice, Set slice number.
- To hide or show values in the slices use Action menu command Hide/Show values.
- To change value in a slice select the chart, then select slice and type new value.
- To change ring thickness (hole size) select the chart, then move control dot.
- To add or change chart caption select the chart and simply start typing.
- To set category names select the chart, then select legend, and then select a category and start typing.
 |
 |
 |
 |
Ring chart 2 and Percentage ring chart 2 shapes.
- Drag and drop Ring chart 2 or Percentage ring chart 2 shape from the library to your document.
- Select the shape by mouse click. The Action menu triangle icon appears.
- Click on the triangle icon to open the Action menu.
- To change slice number use Action menu commands Add slice, Remove slice, Set slice number.
- To hide or show values in the slices use Action menu command Hide/Show values.
- To change value in a slice select the chart, then select slice and type new value.
- To change thickness of selected sector, select the chart, then select a sector and move control dot.
- To add or change chart caption select the chart and simply start typing.
- To set category names select the chart, then select legend, and then select a category and start typing.
 |
 |
 |
 |
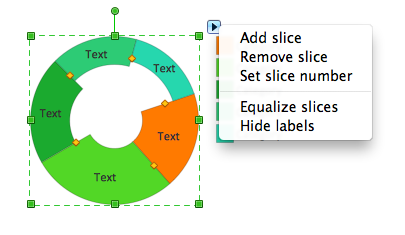
Ring chart, control dots shape.
- Drag and drop Ring chart, control dots shape from the library to your document.
- Select the shape by mouse click. The Action menu triangle icon appears.
- Click on the triangle icon to open the Action menu.
- To change slice number use Action menu commands Add slice, Remove slice, Set slice number.
- To hide or show labels in the slices use Action menu command Hide/Show labels.
- To change label in a slice select the chart, then select slice and type new label.
- To change anglular size of the slices select the chart and use control dots.
- To equalize anglular sizes of the slices use Action menu command equalize slices.
- To change thickness of selected sector, select the chart, then select a sector and move control dot.
- To add or change chart caption select the chart and simply start typing.
- To set category names select the chart, then select legend, and then select a category and start typing.
Arrow ring chart and Percentage arrow ring chart shapes.
- Drag and drop Ring chart or Percentage ring chart shape from the library to your document.
- Select the shape by mouse click. The Action menu triangle icon appears.
- Click on the triangle icon to open the Action menu.
- To change slice number use Action menu commands Add slice, Remove slice, Set slice number.
- To hide or show values in the slices use Action menu command Hide/Show values.
- To change value in a slice select the chart, then select slice and type new value.
- To change ring thickness (hole size) select the chart, then move control dot.
- To add or change chart caption select the chart and simply start typing.
- To set category names select the chart, then select legend, and then select a category and start typing.

Example 1. Pie chart example. Donut chart — Budgeted appropriations.
See Also:
- How to Create a Bar Chart
- How to Create a Line Chart
- How to Create a Pyramid Chart
- How to Create a Scatter Chart
- How to Create a Column Chart
TEN RELATED HOW TO's:
Create bar charts for event management problem solving and visual data comparison using the ConceptDraw DIAGRAM diagramming and vector drawing software extended with the Bar Graphs Solution from the Graphs and Charts area of ConceptDraw Solition Park.
Picture: Bar Diagrams for Problem Solving.Create event management bar charts with Bar Graphs Solution
Related Solution:
Electrical plan is a document that is developed during the first stage of the building design. This scheme is composed of conventional images or symbols of components that operate by means of electric energy. To simplify the creation of these schemes you can use house electrical plan software, which will not require a long additional training to understand how to use it. You only need to install the necessary software ant it’s libraries and you’ll have one less problem during the building projection.
Any building contains a number of electrical systems, including switches, fixtures, outlets and other lightening equipment. All these should be depicted in a building electrical plans and included to general building documentation. This home electrical plan displays electrical and telecommunication devices placed to a home floor plan. On the plan, each electrical device is referenced with the proper symbol. Electrical symbols are used for universal recognition of the building plan by different persons who will be working on the construction. Not all possible electric symbols used on a certain plan, so the symbols used in the current home plan are included to a legend. The electrical home plan may be added as a separate document to a complete set of building plans.
Picture: How To use House Electrical Plan Software
Related Solution:
ConceptDraw DIAGRAM is the beautiful design software that provides many vector stencils, examples and templates for drawing different types of illustrations and diagrams.

Mathematics Solution from the Science and Education area of ConceptDraw Solution Park includes a few shape libraries of plane, solid geometric figures, trigonometrical functions and greek letters to help you create different professional looking mathematic illustrations for science and education.
Picture: Scientific Symbols Chart
Related Solution:
Our DFD software ConceptDraw DIAGRAM allows you to quickly create DFD with data storages, external entities, functional transforms, data flows, as well as control transforms and signals. DFD program ConceptDraw DIAGRAM has hundreds of templates, and a wide range of libraries with all nesassary ready-made drag-and-drop.
Picture: ConceptDraw DIAGRAM DFD Software
Developing a software project supposes architecture first. To make it proper, you can use data flow diagram model in your current project.
The data flow diagram represents the Model of small traditional production enterprise that is made using Yourdon and Coad notation. It shows how the data is transfered through a process. According to the notation of Yourdon and Coad a process is represented by circles and data stores are drawn using parallel lines. This DFD was created using the ConceptDraw Data Flow Diagrams solution. Using this solution one can visualize data flow accordingly to the rules of two basic notations used for data flow modeling.
Picture: Data Flow Diagram Model
Related Solution:
F&B →
High competition among the restaurants at the food court requires original design ideas. To attract visitors and increase sales are used many kinds of advertising products, brightly colored signboards, menus and show-cases, often are used the molds of beautifully decorated dishes. Now designing of colorful F&B (food and beverage) materials is easier than ever thanks to the ConceptDraw DIAGRAM diagramming and vector drawing software extended with Food Court Solution from the Food and Beverage Area of ConceptDraw Solution Park.
Picture: F&B
Related Solution:
Using diagrams, you can visualize the flow of the information or build a detailed data structure. There's no need to have a degree in software and database design with ConceptDraw DIAGRAM , because this software has all the tools needed in developing models and diagrams. Project planning, designing and prototyping was never so easy.
This UML diagrams can be used to visualize a model of the data base development process. A UML diagram shows a graphical view of a structure of software system: components and relationships.
Using Unified Modeling Language helps to depict logical and physical elements of a data base, visually represent requirements and sub-systems. UML diagrams allows developers to organize and predict critical issues, as well as collaborate data base information.
Picture: Software and Database Design with ConceptDraw DIAGRAM
Related Solution:
This sample was created in ConceptDraw DIAGRAM diagramming and vector drawing software using the Line Graphs Solution from Graphs and Charts area of ConceptDraw Solution Park.
This sample shows the Line Chart of annual percentage change. The Line Chart allows you to clearly see the changes of data over the time.
Picture: Line Chart Template for Word
Related Solution:
ConceptDraw DIAGRAM creates drawings, flowcharts, block diagrams, bar charts, histograms, pie charts, divided bar diagrams, line graphs, area charts, scatter plots, circular arrows diagrams, Venn diagrams, bubble diagrams with great visual appeal on Mac OS X.
Picture: Best Diagramming Software for macOS
Related Solution:
Working with disordered network data can be quite exhausting. Sometimes it's necessary to find a network diagramming software to design Cisco network diagrams that would be easy to use and would be able to export diagrams to various graphic formats. ConceptDraw DIAGRAM is a great diagramming tool that is able to perform all these tasks easily.
This vector library represents a set of 26 objects depicting the manufacturer - standard equipment of Cisco switches and hubs. This is only a small part of the vector graphic objects of Cisco equipment that comprise the Cisco Network Diagrams solution. In full the ConceptDraw Cisco Network Diagrams solution has 15 libraries, containing more then 500 objects to create a Cisco network diagrams. They can be used by IT specialists and corporative IT divisions, system and network administrators to make the visual documentation of Cisco networks topology.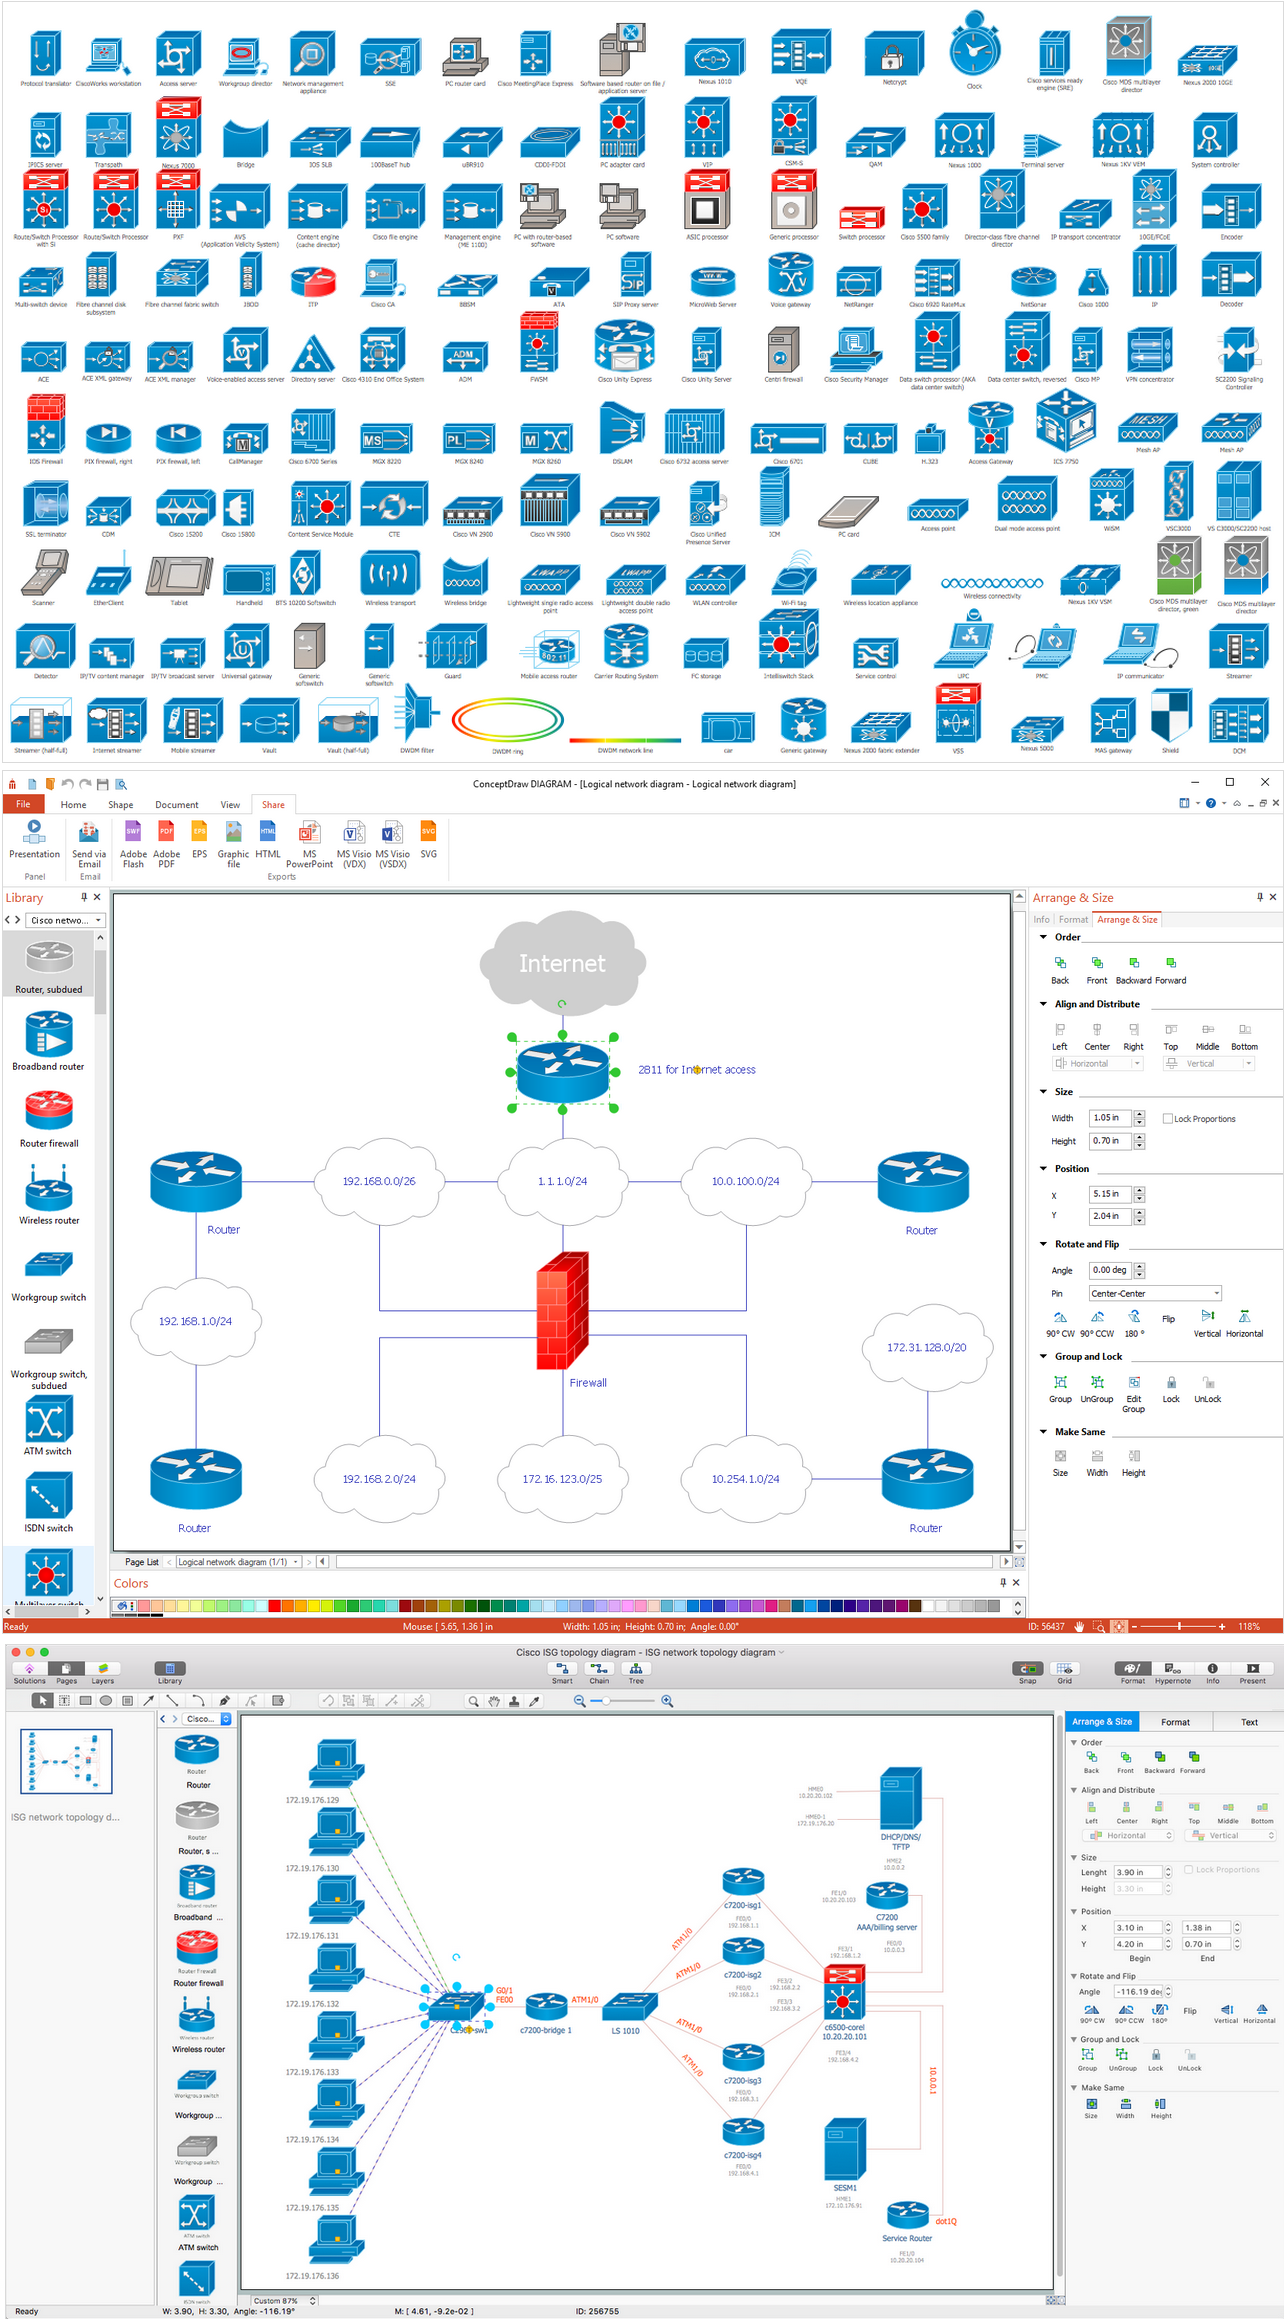
Picture: Network Diagramming Software for Design. Cisco Network Diagrams
Related Solution:
ConceptDraw
DIAGRAM 18