How to Create a Scatter Chart
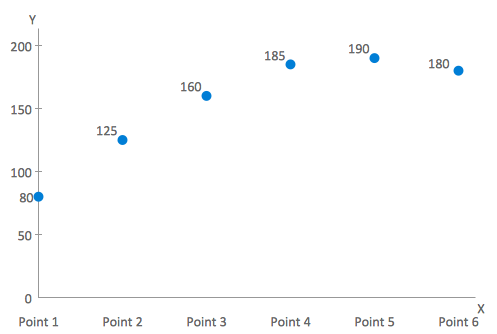
Scatter chart (text -> height) shapes.
- Drag and drop chart shape from the library to your document.
- Select the chart by mouse click. The Action menu icon appears.
- Click on the icon to open Action menu.
- To change point number use Action menu commands Add point, Remove point, Set number of points.
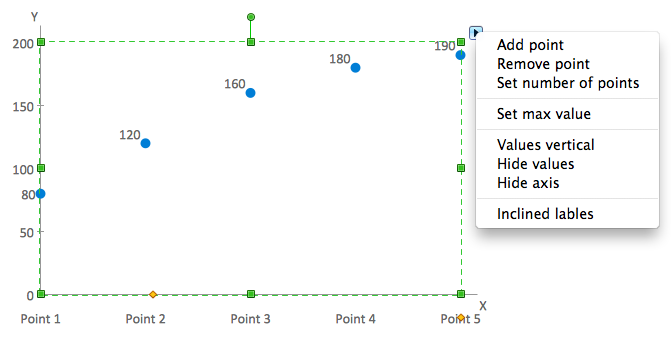
- To set maximum value for vertical axis use Action menu command Set max value.
- To change orientation of point labels use Action menu command Values vertical/horizontal.
- To hide or show point values use Action menu command Hide/Show values.
- To hide or show axises use Action menu command Hide/Show axis.
- To hide or show edges in the line graph use Action menu command Hide/Show edges.
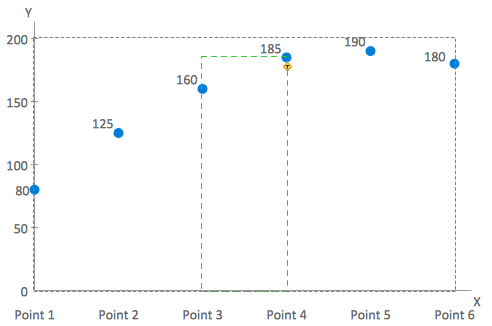
- To change value select the chart, then select point and type new value.
- To add or change chart caption select the chart and simply start typing.
- To change orientation of category labels under horizontal axis use Action menu command Inclined/Horizontal labels.
- To move category labels up and down select the chart and use control dot in the bottom right corner of the shape.
- To change space between points select the chart and use control dot on the horizontal axis.
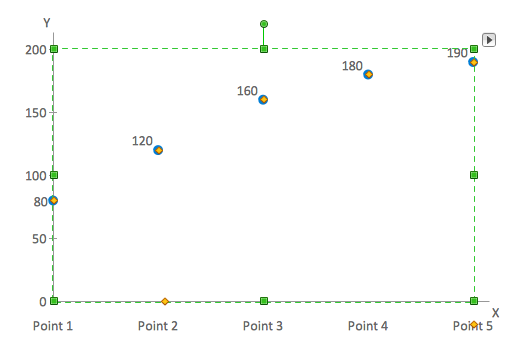
Line graph (control dots) and Scatter chart (control dots) shapes.
- Drag and drop chart shape from the library to your document.
- Select the chart by mouse click. The Action menu icon appears.
- Click on the icon to open Action menu.
- To change point number use Action menu commands Add point, Remove point, Set number of points.
- To set maximum value for vertical axis use Action menu command Set max value.
- To change orientation of point labels use Action menu command Values vertical/horizontal.
- To hide or show point values use Action menu command Hide/Show values.
- To hide or show axises use Action menu command Hide/Show axis.
- To hide or show edges in the line graph use Action menu command Hide/Show edges.
- To change point value select the chart, then move control dot of the point vertically.
- To add or change chart caption select the chart and simply start typing.
- To change orientation of category labels under horizontal axis use Action menu command Inclined/Horizontal labels.
- To move category labels up and down select the chart and use control dot in the bottom right corner of the shape.
- To change space between points select the chart and use control dot on the horizontal axis.

Example 1. Scatter chart example - Ionization energy as a function of atomic number.
See Also:
- How to Create a Bar Chart
- How to Create a Line Chart
- How to Create a Pyramid Chart
- How to Create a Pie Chart
- How to Create a Column Chart
TEN RELATED HOW TO's:
A voltage source is a two terminal device which can maintain a fixed voltage. An ideal voltage source can maintain the fixed voltage independent of the load resistance or the output current. However, a real-world voltage source cannot supply unlimited current. A voltage source is the dual of a current source. Real-world sources of electrical energy, such as batteries, generators, and power systems, can be modeled for analysis purposes as a combination of an ideal voltage source and additional combinations of impedance elements.
26 libraries of the Electrical Engineering Solution of ConceptDraw DIAGRAM make your electrical diagramming simple, efficient, and effective. You can simply and quickly drop the ready-to-use objects from libraries into your document to create the electrical diagram.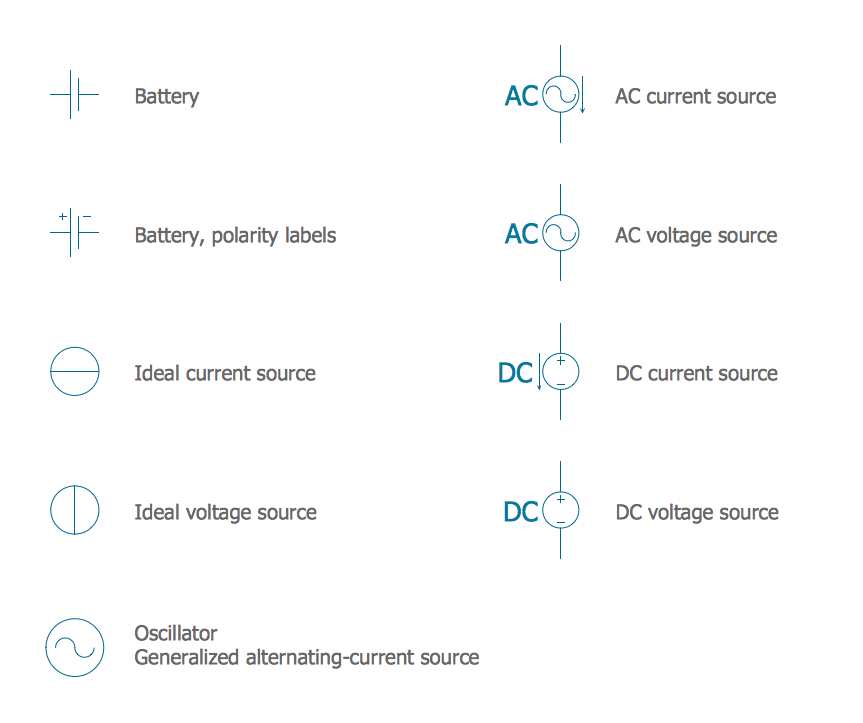
Picture: Electrical Symbols — Power Sources
Related Solution:
Easy charting software comes with beautiful chart templates and examples. This makes it easy to create professional charts without prior experience.
Picture: Chart Templates
Easy charting software comes with beautiful chart templates and examples. This makes it easy to create professional charts without prior experience.
Picture: Chart Examples
Related Solutions:
Complete set of bar chart examples is produced using ConceptDraw software. Surfing bar chart examples you can find an example that is the best for your case.
Picture: Bar Chart Examples
Related Solution:
The question how to create a column chart have a simple answer. Use ConceptDraw tips to find out how to create a column chart depicts your data the best way.
Picture: How to Create a Column Chart
Related Solution:
A database is a data collection, structured into some conceptual model. Two most common approaches of developing data models are UML diagrams and ER-model diagrams. There are several notations of entity-relationship diagram symbols and their meaning is slightly different. Crow’s Foot notation is quite descriptive and easy to understand, meanwhile, the Chen notation is great for conceptual modeling.
An entity relationship diagrams look very simple to a flowcharts. The main difference is the symbols provided by specific ERD notations. There are several models applied in entity-relationship diagrams: conceptual, logical and physical. Creating an entity relationship diagram requires using a specific notation. There are five main components of common ERD notations: Entities, Actions, Attributes, Cardinality and Connections. The two of notations most widely used for creating ERD are Chen notation and Crow foot notation. By the way, the Crow foot notation originates from the Chen notation - it is an adapted version of the Chen notation.
Picture: ERD Symbols and Meanings
Related Solution:
This pyramid chart example is supplied with the ConceptDraw Pyramid Diagrams solution. This is a model of Information Management Systems classification. It is made in a form of a four-level pyramid. The top level shows the information system developed for an executive management. Below, there is a level depicting the system of decision making process for the managers of the senior level. A schematic representation of the middle management information system, following to logic, is in the middle of the pyramid. And at least, the lowermost level represents an information processing system for employees.
Picture: Pyramid Diagram
Related Solutions:
ConceptDraw DIAGRAM software supplied with HR Flowcharts Solution can effectively help in labour-intensive process of human resource development.
Picture: Human Resource Development
Related Solution:
ConceptDraw DIAGRAM is a powerful diagramming and vector drawing software. Extended with Chemical and Process Engineering Solution from the Industrial Engineering Area of ConceptDraw Solution Park, it became the best Chemical Engineering software.
Picture: Chemical Engineering
Related Solution:
A causal model is an abstract concept, that describes the causal mechanisms of a system, by noting certain variables and their influence on each other, in an effort to discover the cause of a certain problem or flaw. This model is presented in diagram form by using a fishbone diagram.
ConceptDraw DIAGRAM diagramming and vector drawing software enhanced with Fishbone Diagrams solution helps you create business productivity diagrams from Fishbone diagram templates and examples, that provide to start using of the graphic method for the analysis of problem causes. Each predesigned Fishbone Diagram template is ready to use and useful for instantly drawing your own Fishbone Diagram.
Picture: Fishbone Diagram Template
Related Solution:
ConceptDraw
DIAGRAM 18