Pyramid Diagram and Pyramid Chart
Pyramid diagram, triangle chart, triangular diagram
The pyramid diagrams, triangle charts and triangular diagrams help to visualize hierarchical, proportional and foundation-based relationships, process steps, organizational layers or topics interconnections.
The Pyramid diagrams solution from Marketing area of ConceptDraw Solution Park provides examples, templates and vector stencils library.
You can use it to illustrate your documents, infographics, presentations and websites with pyramid diagram, triangle chart and triangular diagram using ConceptDraw DIAGRAM diagramming and vector drawing software.
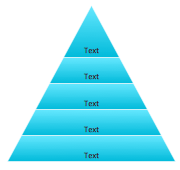
Basic Pyramid Diagram
You can edit this basic 5 levels pyramid diagram template in ConceptDraw DIAGRAM to create your own multilevel triangle chart.
Pyramid Diagram Isometric
Simply type in your labels and title into this isometric 3D triangle chart template using the ConceptDraw DIAGRAM application.
Triangle Chart
Fill this segmented pyramid diagram template with your text in the ConceptDraw DIAGRAM software.
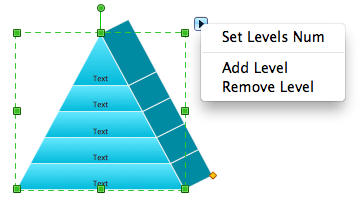
How to Draw a Pyramid Diagram
Some of the ConceptDraw pyramid diagram templates are interactive and allow to change number of levels.
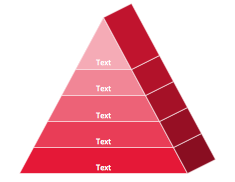
Example for the Pyramid Diagram
This market value pyramid diagram has 5 levels:
- Essence (Who we are),
- Competitive positioning (Where we play),
- Customer benefits (Value proposition),
- Product / Service features (Value delivery),
- Internal capabilitiea (Value requirements).
Free Download Pyramid Chart Software and View All Examples
Use this triangular scheme to develop your marketing strategy.

Example 1. Pyramid diagram example - Market value pyramid
More Related Diagrams:
TEN RELATED HOW TO's:
The solution handles designs of any complexity, and the comprehensive library covers all key aspects of a transportation system. To further enhance your map design, there is the option to embed links, that can display station images or other relevant, important information. We have also included a set of samples in the solution, that show the possible real-world application — complex tube systems including the London Tube and New York City Subway show the level of detail possible when using the Metro Map Solution.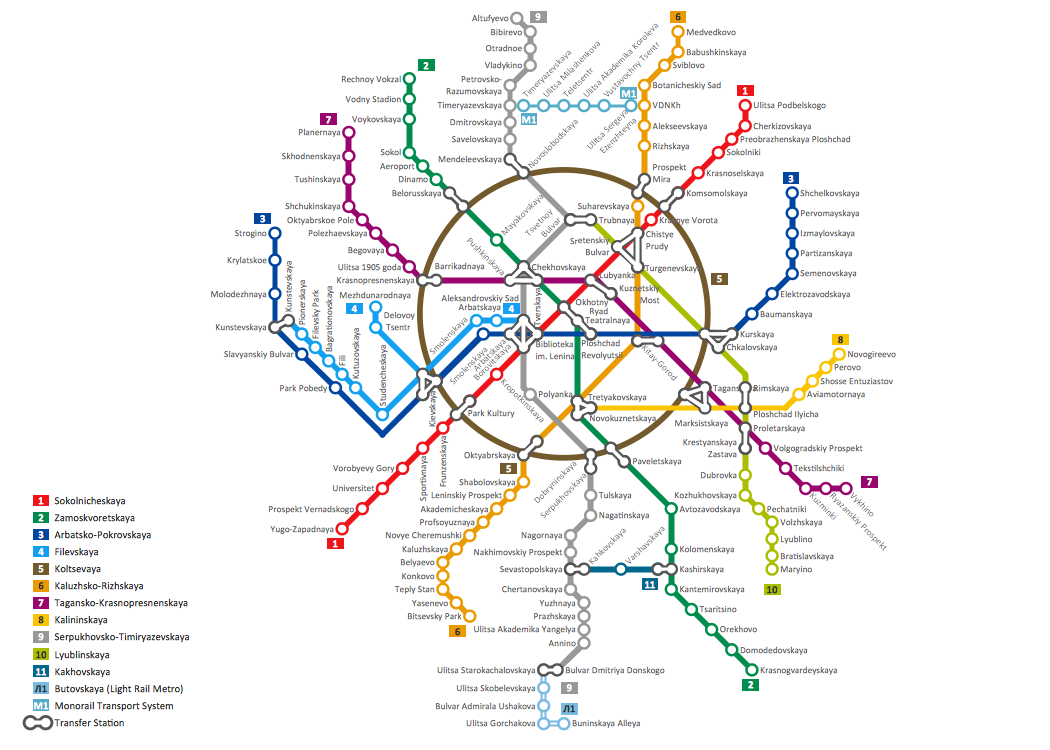
Picture: How to Draw Metro Map style infographics? Moscow, New York, Los Angeles, London
Related Solution:
ConceptDraw DIAGRAM is a professional software for building of great-looking Flowcharts ✔️ of various types and any degree of complexity, ✔️ in a few simple steps, ✔️ even if you have no experience, ✔️ using RapidDraw technology, ✔️ to perform different tasks in different fields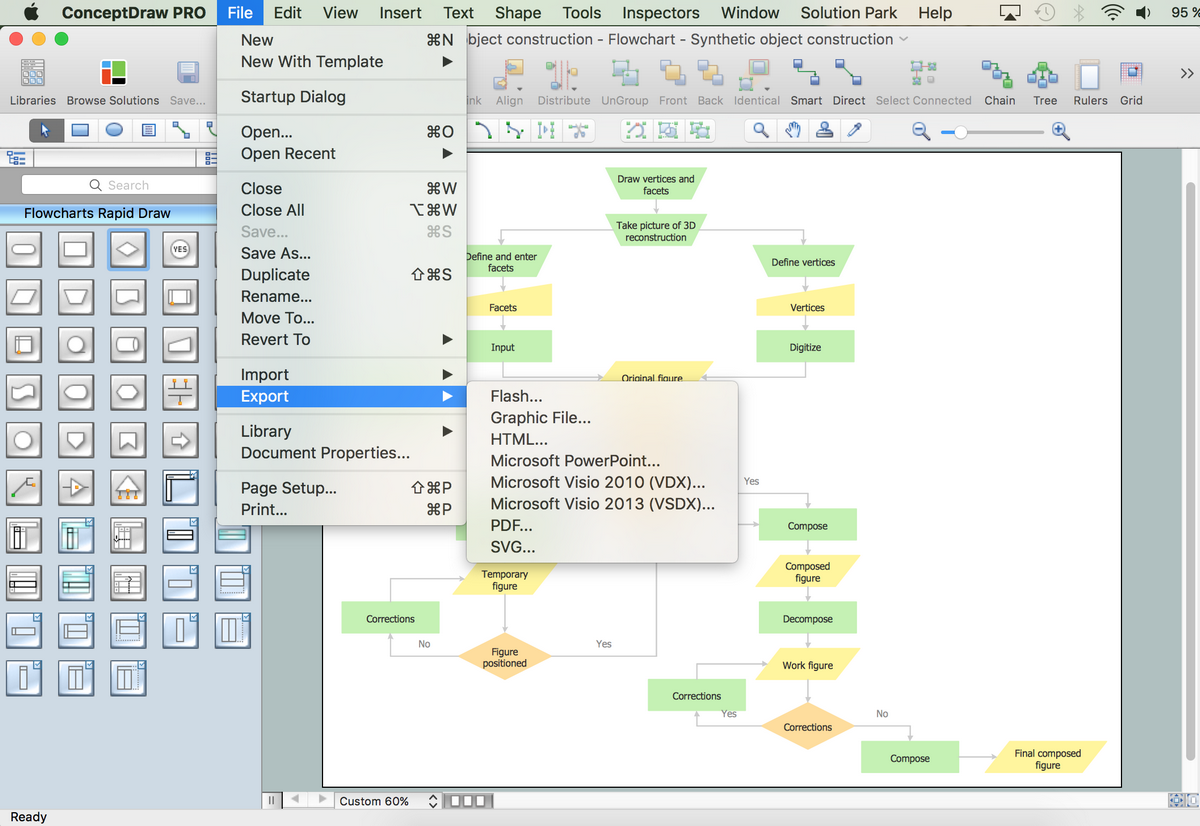
Picture: How to Build a Flowchart
Related Solution:
ConceptDraw Column Chart software allows drawing column charts using predesigned objects or drawing tools. In ConceptDraw Column Chart software you can find a complete set of column chart tools and objects.
Picture: Column Chart Software
Related Solution:
Easy charting software comes with beautiful chart templates and examples. This makes it easy to create professional charts without prior experience.
Picture: Chart Templates
ConceptDraw DIAGRAM extended with IDEF0 Diagrams solution from the Software Development area of ConceptDraw Solution Park is a powerful diagramming and vector drawing IDEF0 software. All IDEF0 diagrams created in ConceptDraw DIAGRAM are vector graphic documents and can be reviewed, modified and converted to MS Visio XML format. To obtain the IDEF0 Visio documents from ConceptDraw DIAGRAM documents use the wide export possibilities of ConceptDraw DIAGRAM.
Picture: IDEF0 Visio
Related Solution:
Venn diagrams are illustrations used in the branch of mathematics known as set theory.
Use ConceptDraw DIAGRAM to quick and easy design your own Venn Diagram of any complexity.
Picture: Venn Diagram
Related Solution:
Tools to do presentation of mindmaps via Skype.
Picture: How to do presentation of Mind Maps via Skype conference call?
Related Solution:
As restaurant industry is growing rapidly nowadays, researches show that almost half of the adults have worked in a restaurant or a cafe. Moreover, many of them dream to start their own someday. Unfortunately, it takes a lot of time to write a business plan and to find a great location, although some know how to create a restaurant floor plan in minutes or how to plan budget effortlessly. Hiring employees can also cause a lot of headache, but this is crucial for further success, because every guest comes to restaurant for a good service and delicious food. It is also worth noting that restaurant concept is also important, because it defines target audience and influences the menu.
This diagram represents the floor plan of an ongoing sports-theme establishment - restaurant, cafe, or other food service. A number of widescreen monitors installed along the perimeter provide visitors the opportunity to follow the course of a match from anywhere in the dining room of restaurant or cafe. The most of sports fans believe that food and alcohol is a big part of any sports show. That is why the dining room takes the most space - almost 60% of the total establishment space. Nearly all sports fans consume beverages while watching sports - beer, soda or water at least. Thus, the restaurant floor plan designers added a large lavatory there. Moreover, project developers considered unnecessary the gender division of such delicate place - perhaps they guess that only men are watching football, or believe that alcohol will eliminate the most of gender differences.
Picture: How To Create Restaurant Floor Plan in Minutes
Related Solution:
Program Structure Diagram is a visual representation of a program's organization, showing its components and their relationships.
Picture: Program Structure Diagram
ConceptDraw DIAGRAM software extended with unique HR Flowcharts Solution is the best for designing various flowcharts and diagrams in the field of human resources management.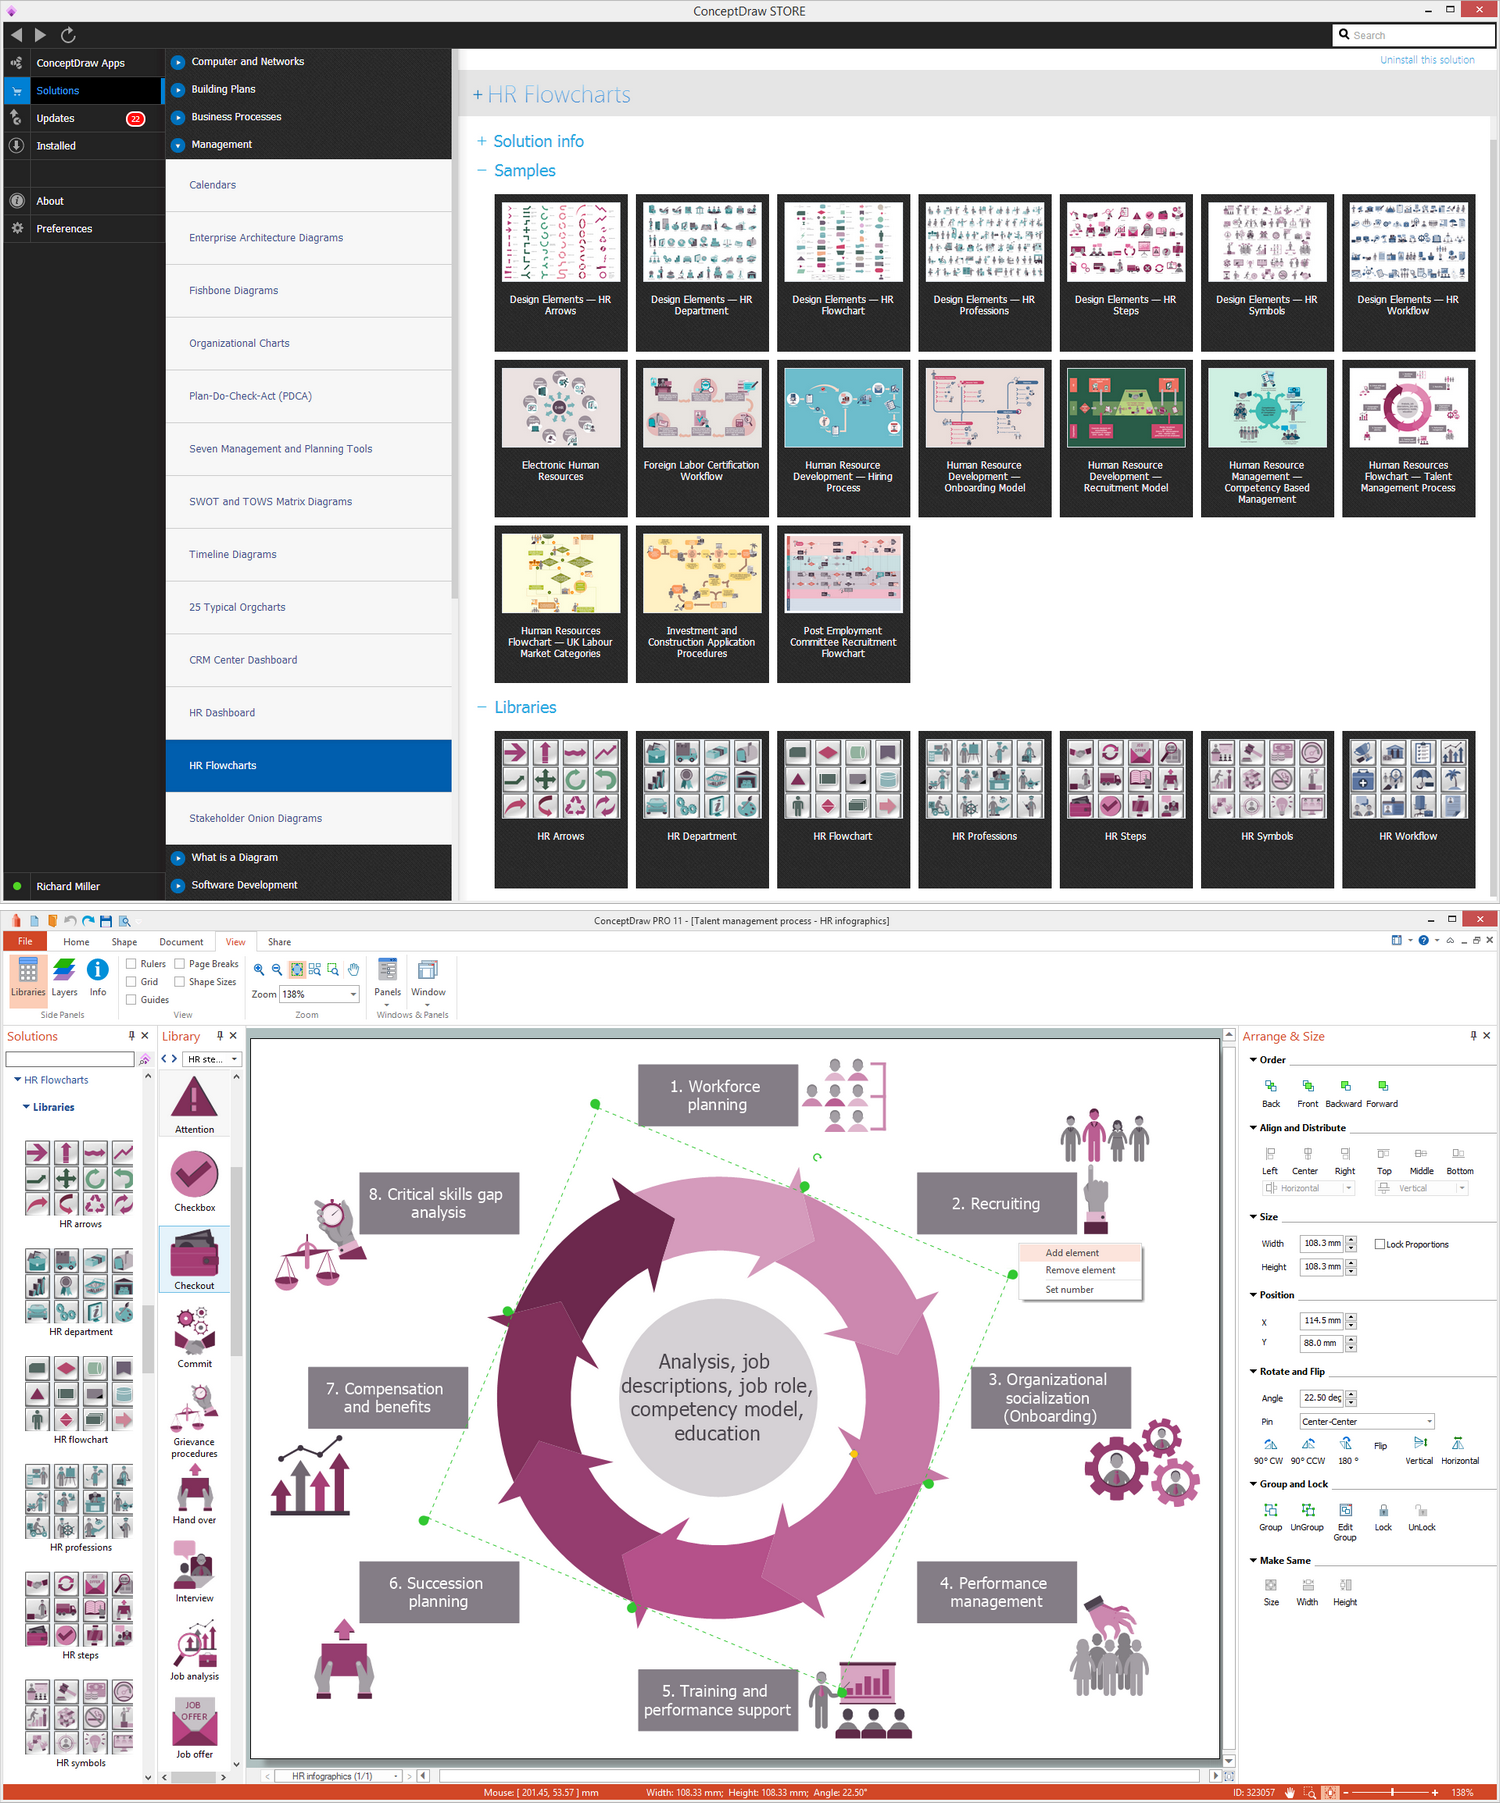
Picture: Human Resources
Related Solution: