How to Create a Pyramid Diagram
Diagram shapes Pyramid 1, 2, 3, 4 and 5
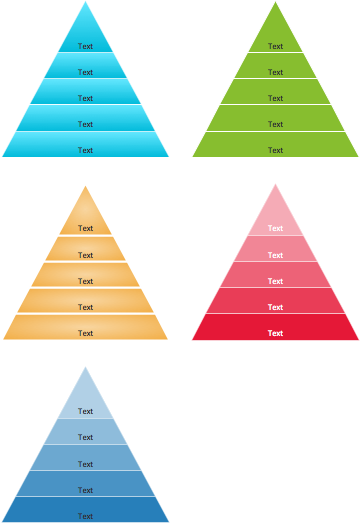
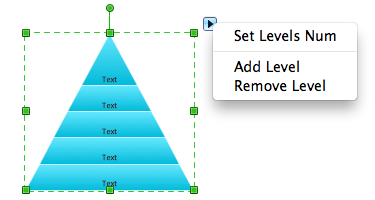
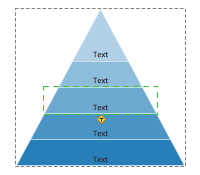
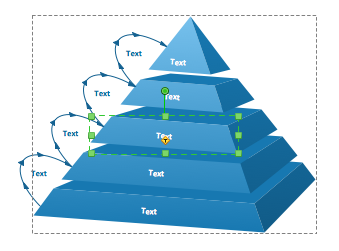
Diagram shapes Pyramid 1, 2, 3, 4 and 5 , isometric
- To quickly add isometric pyramid (3D triangle) diagram to your graphic document drag and drop an isometric pyramid shape from the Pyramid diagrams library into the document page opened in ConceptDraw DIAGRAM software.
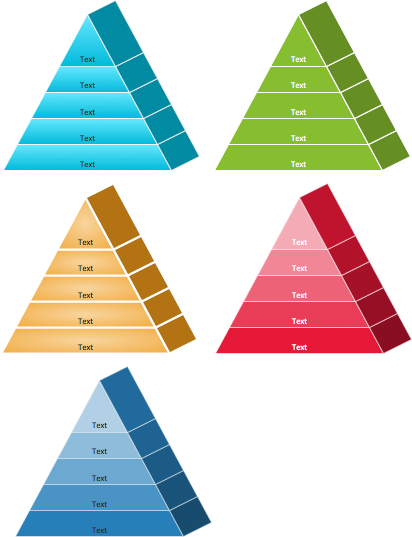
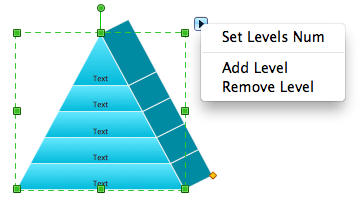
- To change number of levels select your isometric pyramid diagram by mouse click. Action menu icon appears. Click on the icon to open Action menu, and use commands Set Levels Nubmer, Add Level, Remove Level to change number of levels.
- To change text of any level select your isometric pyramid diagram, then select the level by mouse click, and start typing.
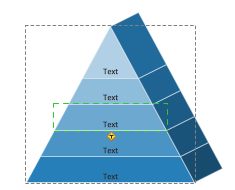
- To change thickness of your isometric pyramid select it and move control dot in the right bottom corner of diagram.
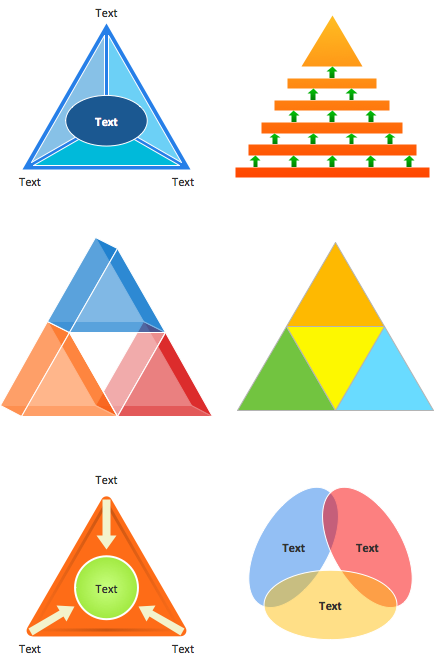
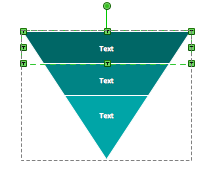
Triangular diagram shapes
- To quickly add triangular (triangle) diagram to your graphic document drag and drop the diagram shape from the Pyramid diagrams library into the document page opened in ConceptDraw DIAGRAM software.
- To change text in any part of the triangular diagram select the shape by mouse click, then select the part of diagram by second mouse click, and start typing.
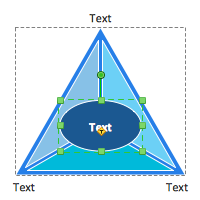
- To delete the part of your triangular diagram select the shape by mouse click, then select the part of diagram by second mouse click, and press delete key.
Funnel diagram shapes
- To quickly add funnel diagram to your graphic document drag and drop the diagram shape from the Pyramid diagrams library into the document page opened in ConceptDraw DIAGRAM software.
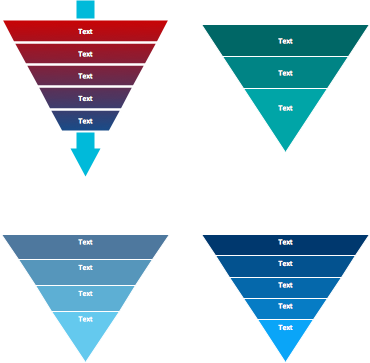
- To change text in any part of the funnel diagram select the shape by mouse click, then select the part of diagram by second mouse click, and start typing.
- To delete the part of your funnel diagram select the shape by mouse click, then select the part of diagram by second mouse click, and press delete key.
3D pyramid diagram shapes
- To quickly add 3D pyramid diagram to your graphic document drag and drop the diagram shape from the Pyramid diagrams library into the document page opened in ConceptDraw DIAGRAM software.
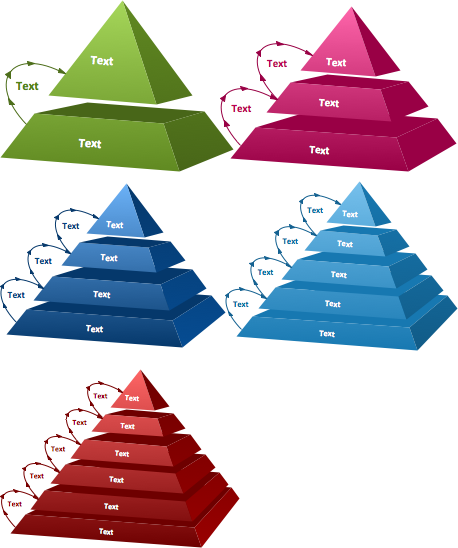
- To change text in any part of the 3D pyramid diagram select the shape by mouse click, then select the part of diagram by second mouse click, and start typing.
- To delete the part of your 3D pyramid diagram select the shape by mouse click, then select the part of diagram by second mouse click, and press delete key.

Example 1. Pyramid diagram example - Top brend model.
See more Pyramid Diagram:
- Zooko Triangle Diagram
- Time, Quality, Money Triangle Diagram
- Project Triangle Diagram
- Purchase Funnel Diagram
- Project Triangle Chart
- Priority Pyramid Diagram
- Organization Triangle Diagram
- Knowledge Triangle Diagram
- Triangular Graphic
- Inverted Pyramid
- Fundraising Pyramid
- 3D Triangle Diagram
- DIKW Pyramid
- Five level pyramid model
- Four level pyramid model
- Three level pyramid model
NINE RELATED HOW TO's:
Local area network connects computers and other network appliances within an area, such as office building or a campus. It can be difficult to provide such network without a predesigned plan. For these purposes you can use network diagram software, which helps you to create LAN network diagrams and office network diagrams quickly and effortless. This will speed up your work and you can save the diagram for the future network improvements.
The following diagram illustrates a network topology of the small office. LAN configuration has a star topology. The local network joins 8 computers among which are several desktop PCs, laptop, two iMacs and iBook. The end-point devices are divided into three groups. Each group is connected to its hub. There is a network printer and a modem, which are interconnected with other devices through a network server. Each computer on the LAN can access the server through a corresponding hub.
Picture: Network Diagram Software. LAN Network Diagrams. Physical Office Network Diagrams
Related Solution:
Developing a software project supposes architecture first. To make it proper, you can use data flow diagram model in your current project.
The data flow diagram represents the Model of small traditional production enterprise that is made using Yourdon and Coad notation. It shows how the data is transfered through a process. According to the notation of Yourdon and Coad a process is represented by circles and data stores are drawn using parallel lines. This DFD was created using the ConceptDraw Data Flow Diagrams solution. Using this solution one can visualize data flow accordingly to the rules of two basic notations used for data flow modeling.
Picture: Data Flow Diagram Model
Related Solution:
The question how to create a column chart have a simple answer. Use ConceptDraw tips to find out how to create a column chart depicts your data the best way.
Picture: How to Create a Column Chart
Related Solution:
This sample shows the Influence Diagram. It was created in ConceptDraw DIAGRAM diagramming and vector drawing software using the Basic Diagramming Solution from the Universal Diagramming area of ConceptDraw Solution Park.
Influence diagram represents the directed acyclic graph with three types of nodes and three types of arcs that connect the nodes. Decision node is drawn as a rectangle, Uncertainty node is drawn as an oval, Value node is drawn as an octagon.
Picture: Influence Diagram
Related Solution:
UML Collaboration Diagram depicts the interactions between objects or parts in terms of sequenced messages and describes both the static structure and dynamic behavior of a system.
Rapid UML solution provides templates, examples and libraries of stencils for quick and easy drawing all the types of system and software engineering diagrams according to UML 2.4 and 1.2 notations.
Picture: UML Collaboration Diagram (UML2.0)
Related Solution:
While developing software, it is very important to have a visual model, because it helps to represent the logic and the architecture of an application. Experienced engineers use UML diagrams to denote relationships between classes and their instances. UML is a general language for a set of diagrams like deployment diagrams, object diagrams or use case diagrams.
This diagram represents UML class diagram used for a software system development using an object-oriented method. Class diagrams are categorized as static structure diagrams that depict the physical structure of a system. Class diagram divides a software system's structure into "classes". Classes are defined by the methods and variables of objects. UML Class diagram is used to depict relationships and source code dependencies between objects.
Picture: UML Diagram
Related Solution:
Cisco Network Diagrams solution from the Computer and Networks area of ConceptDraw Solution Park provides 14 libraries with 450 ready-to-use predesigned vector objects that can be used for quickly and easily drawing the professional Cisco Network Diagrams.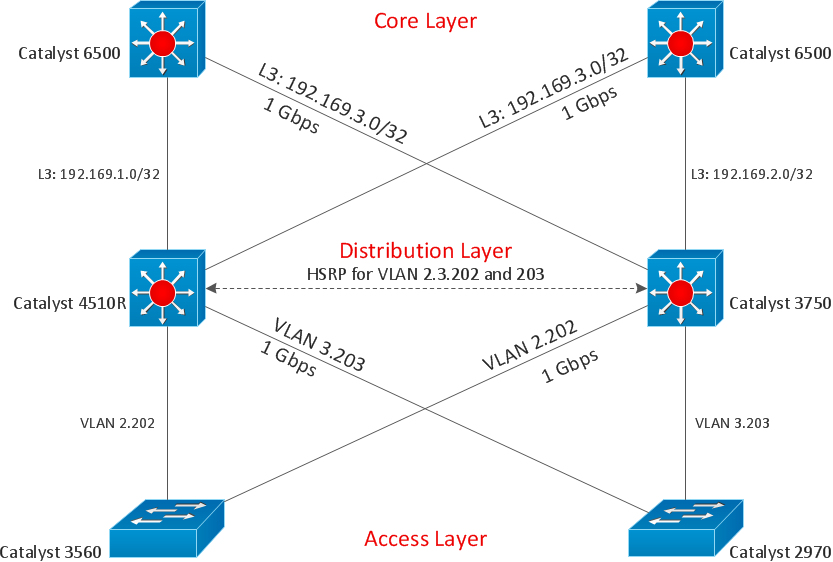
Picture: Cisco Design
Related Solution:
In any unclear situation create a workflow diagram. Workflow diagrams help to understand processes, find bottlenecks and fix the process. When you create workflow diagram using ConceptDraw DIAGRAM software you are able to focus on thinking, not drawing, that makes you as effective as possible.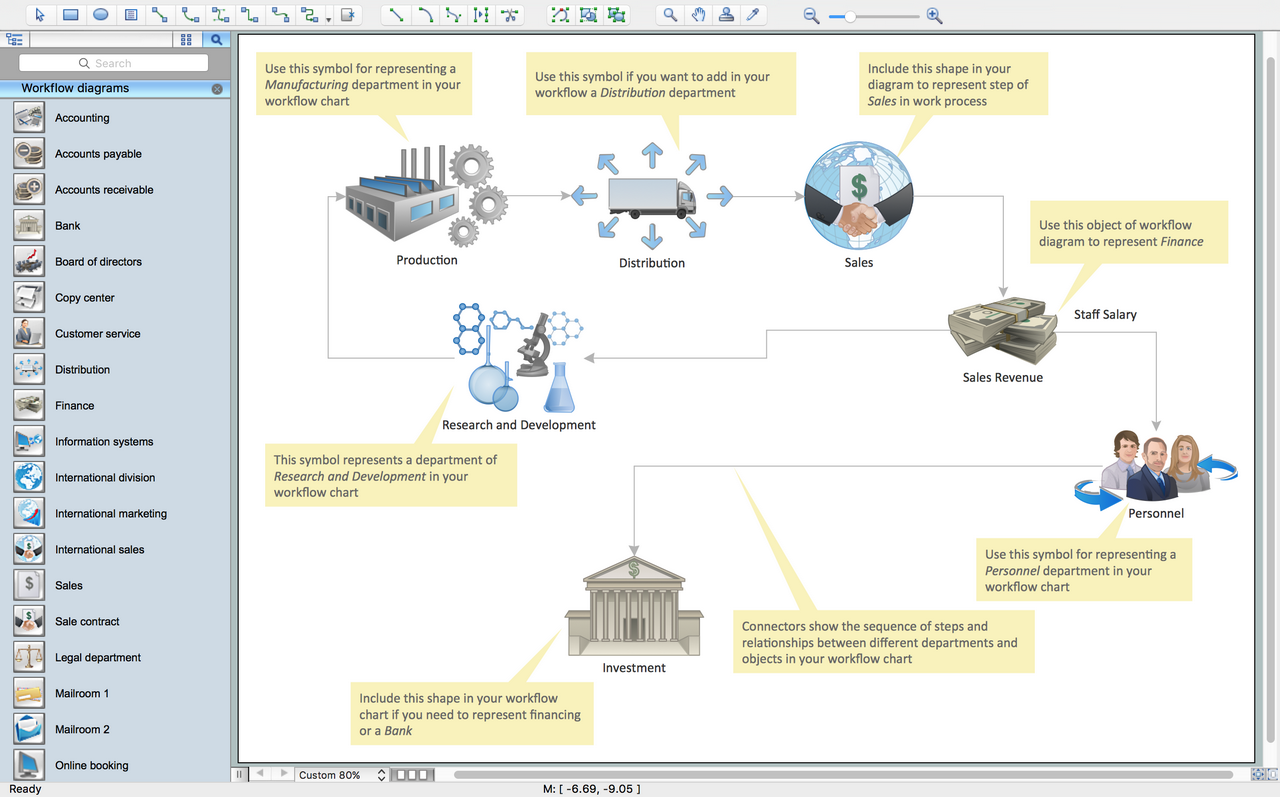
Picture: Create Workflow Diagram
Related Solution:
ConceptDraw DIAGRAM creates drawings, diagrams and charts with great visual appeal in MacOS
Picture: Percentage Spider Chart
Related Solution:
ConceptDraw
DIAGRAM 18