
Example 1. Bar Diagram Math - Global natural gas consumption
Divided Bar Diagrams solution includes wide variety of Bar Diagram Math examples, templates and samples which are available from ConceptDraw STORE. They can help you in your work - you can use them as the base for your own Bar Diagram Math. All that you need - simply change the details of desired sample, or fill template for your needs.

Example 2. Bar Diagram Math - Composition of state government revenue
Divided Bar Diagrams solution contains also Divided Bar Diagrams library with wide variety of predesigned vector objects that will be useful for creating the Bar Diagram Math in minutes.

Example 3. Bar Diagram Math - London election results
The examples you see on this page were created in ConceptDraw DIAGRAM using the objects from the Divided Bar Diagrams library of Divided Bar Diagrams solution. These samples demonstrate the solution's capabilities and the professional results you can achieve. An experienced user spent 10 minutes creating every Bar Diagram Math of represented on this page.
The Bar Diagram Math and Divided Bar Diagrams produced with ConceptDraw DIAGRAM is vector graphic documents and is available for reviewing, modifying, converting to a variety of formats (image, HTML, PDF file, MS PowerPoint Presentation, Adobe Flash or MS Visio), printing and send via e-mail in one moment.
TEN RELATED HOW TO's:
It's impossible to overestimate the usefulness and convenience of using the ready templates when you create your own diagrams and charts. ConceptDraw DIAGRAM software presents the Business Diagrams solution which offers a set of Venn Diagram templates and samples.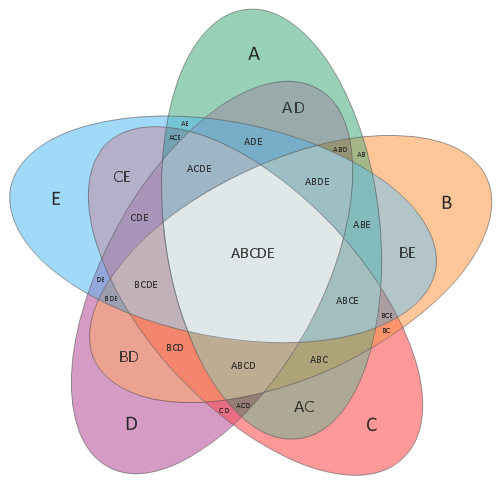
Picture: Venn Diagram Template
Related Solution:
Venn diagrams are illustrations used in the branch of mathematics known as set theory.
Create your Venn diagrams for logic problem solving using the ConceptDraw DIAGRAM software
Picture:
Venn Diagram Examples for Problem Solving
Venn Diagram as a Truth Table
Related Solution:
ConceptDraw DIAGRAM diagramming and vector drawing software extended with Specification and Description Language (SDL) Solution from the Industrial Engineering Area of ConceptDraw Solution Park provides powerful drawing tools for quick and easy creating well-designed FSM diagrams.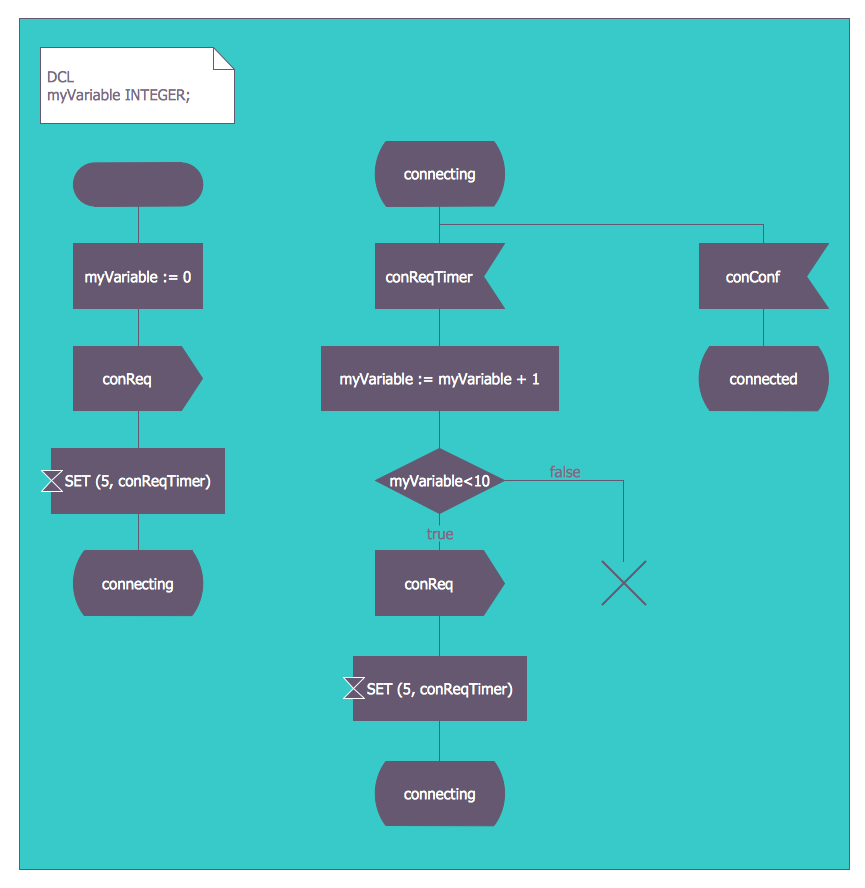
Picture: FSM — Finite-state Machine
Related Solution:
ConceptDraw DIAGRAM is a powerful software for creating professional looking Flowcharts quick and easy.
Picture:
Flowchart
What is Flowchart
Related Solution:
The Pie Chart visualizes the data as the proportional parts of a whole and looks like a disk divided into sectors. The pie chart is type of graph, pie chart looks as circle devided into sectors. Pie Charts are widely used in the business, statistics, analytics, mass media. It’s very effective way of displaying relative sizes of parts, the proportion of the whole thing.
Picture: Pie Chart Word Template. Pie Chart Examples
Related Solution:
Learn about Virtual Private Networks (VPNs), and how they work, exploring VPN Networks with diagrams. ✔️ How to create VPN flowcharts using the ConceptDraw DIAGRAM software?
Picture:
What is a Virtual Private Network?
VPN Diagram Examples
Related Solution:
You want design the Cross Functional Diagram and need powerful software? Then ConceptDraw DIAGRAM diagramming and vector drawing software extended with Cross-Functional Flowcharts Solution is exactly what you need.
Picture: Cross Functional Diagram
Related Solution:
What is a Process Flow Map? It is a chart which visually illustrates a business process and how its steps work together. Process Flow Maps help companies define problem areas, inefficient activities for the purpose of further increasing performance and profitability of businesses. ConceptDraw DIAGRAM diagramming and vector drawing software extended with Flowcharts solution from the Diagrams area of ConceptDraw Solution Park is efficient and productive software for fast and simple creating professional looking Process Flow Map.
Picture: Process Flow Maps
Related Solution:
What is a computer network? This is a set of devices and systems that are connected to each other (logically or physically) and communicate with each other. This could include servers, computers, phones, routers, and so on. The size of this network can reach the size of the Internet, and can consist of only two devices connected by a cable.
This sample shows the connection scheme of the home WLAN equipment to the Internet.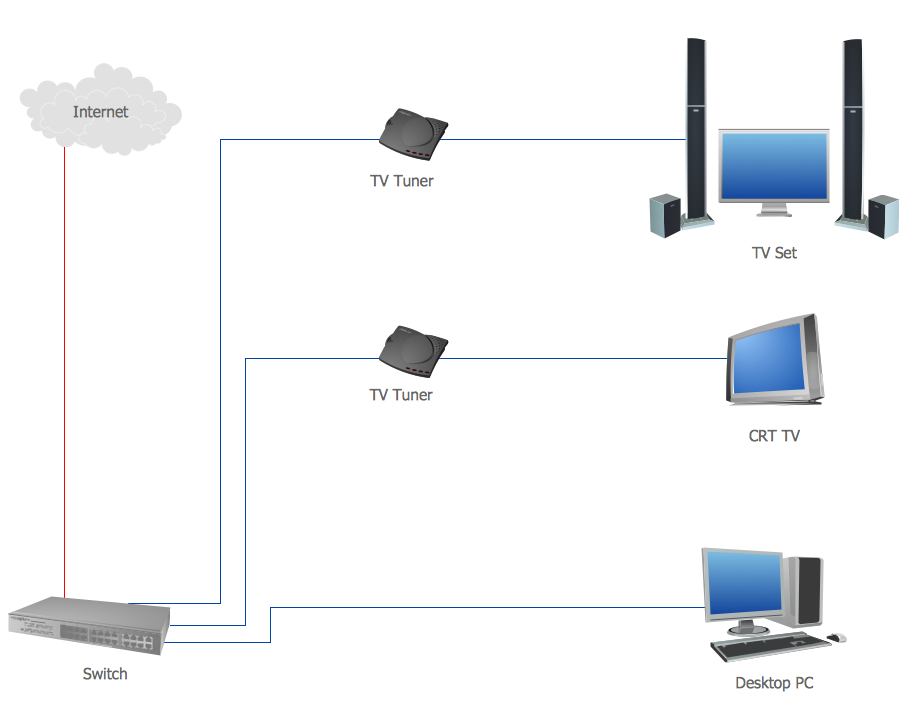
Picture: Diagram of a Basic Computer Network. Computer Network Diagram Example
Related Solution:
How to design landscape? You can draw it by hand on a sheet of paper, but for this you need to know the bases of the perspective, you need to have good artistic abilities and to know how to depict the natural elements. But it is much easier and convenient to use the modern ConceptDraw DIAGRAM diagramming and vector drawing software extended with Landscape & Garden Solution from the Building Plans Area.
Picture: How to Design Landscape
Related Solution:

