
Sample 1. Team psychological characteristics - Concept map.
ConceptDraw DIAGRAM ector diagramming and business graphics software enhanced with with templates, samples and stencil libraries from ConceptDraw Solution Park helps you to easily draw flowcharts, block diagrams, bar charts, histograms, pie charts, divided bar diagrams, line graphs, area charts, scatter plots, circular arrows diagrams, Venn diagrams, bubble diagrams, concept maps, and others.
Use ConceptDraw DIAGRAM with Solution Park to draw and present your own diagrams, charts and graphs on Mac and Win.
See also Samples:
TEN RELATED HOW TO's:
This sample shows the Booch OOD diagram of the environment. The Booch method (developed by Grady Booch) is an object modeling language and methodology used in software engineering.
This sample was created in ConceptDraw DIAGRAM diagramming and vector drawing software using the Rapid UML Solution from the Software Development area of ConceptDraw Solution Park.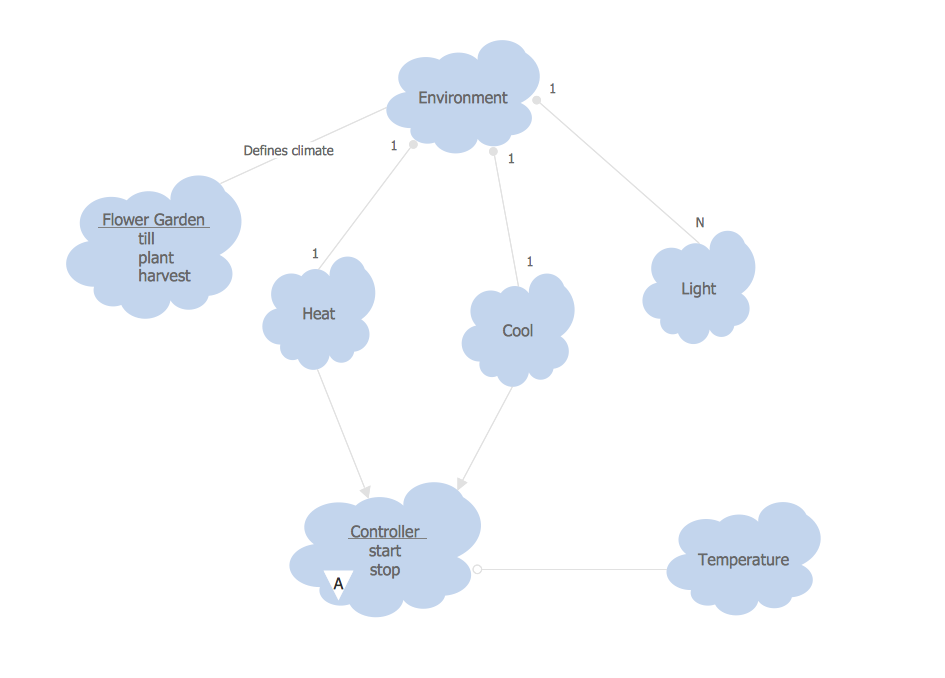
Picture: Object-Oriented Development (OOD) Method
Related Solution:
A waterfall model describes software development process as a sequence of phases that flow downwards. SSADM is one of the implementations of waterfall method. It’s easier to learn about structured systems analysis and design method (SSADM) with ConceptDraw DIAGRAM because this software has appropriate tools for creating data flow diagrams. You can use all the three main techniques of SSADM method with special tools and predesigned templates.
This data flow diagram illustrates the Structured Systems Analysis and Design Method. This method method considers analysis, projecting and documenting of information systems. Data flow models are the most important elements of SSADM and data flow diagrams are usually used for their description. It includes the analysis and description of a system as well as visualization of possible issues.
Picture: Structured Systems Analysis and Design Method. SSADM with ConceptDraw DIAGRAM
Related Solution:
ConceptDraw DIAGRAM diagramming and vector drawing software extended with Mathematics solution from the Science and Education area is the best for creating: mathematical diagrams, graphics, tape diagrams various mathematical illustrations of any complexity quick and easy.
Mathematics solution provides 3 libraries: Plane Geometry Library, Solid Geometry Library, Trigonometric Functions Library.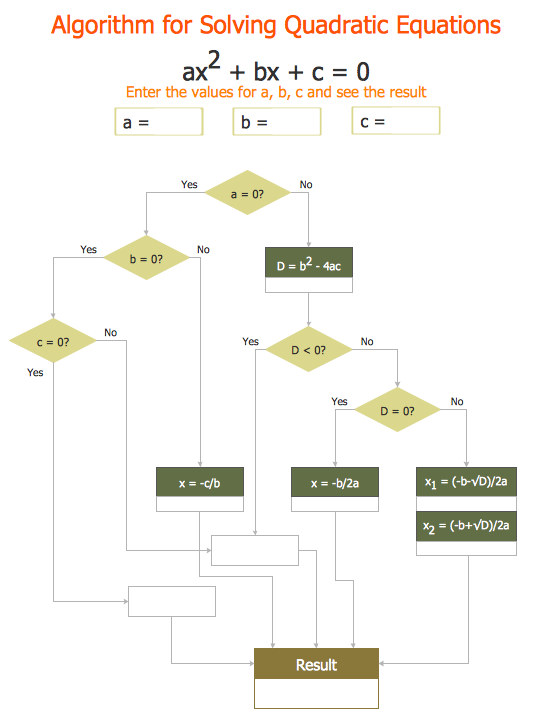
Picture: Mathematical Diagrams
Related Solution:
The purchasing process follows very specific guidelines and includes a purchasing cycle flowchart and receiving process flow chart. Common key elements of purchasing process.
It is important to know how purchasing processes work and how each operation is done.
Picture: Purchase Process Flow Chart,Receiving Process Flow Chart,Accounting Flowchart Example.
Related Solution:
Mechanical design is a labour-intensive process. To facilitate the task of Mechanical Engineering Diagrams creating, ConceptDraw DIAGRAM diagramming and vector drawing software was extended with Mechanical Engineering solution from the Engineering area. Now, ConceptDraw DIAGRAM is a powerful Mechanical Design Software.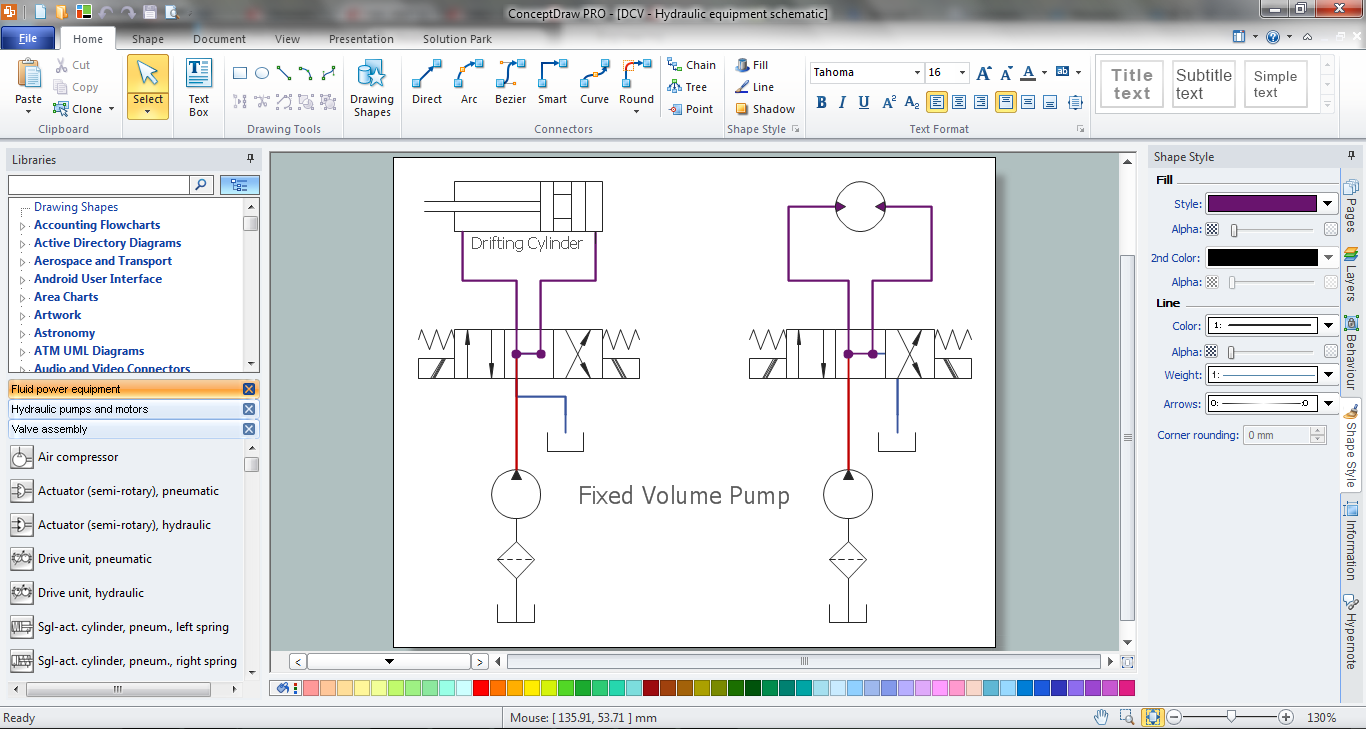
Picture: Mechanical Design Software
Related Solution:
Tool to draw Metro Map styled inforgraphics. London Tube map sample.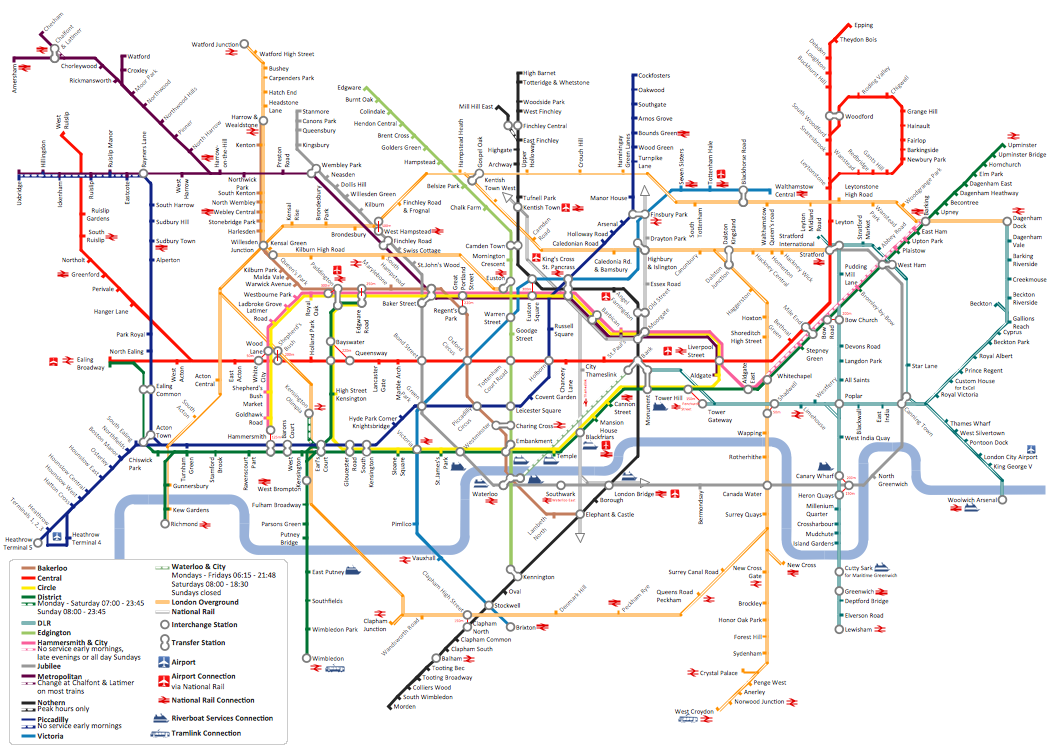
Picture: How to draw Metro Map style infographics? (London)
Related Solution:
Database model is a graphic representation need at the beginning of project development. You won't have any problems with drawing ER diagrams on a Mac anymore with ConceptDraw DIAGRAM application. Special libraries that contain all the symbols of both Chen's and Crow’s foot notation allow you to start database modeling within a few minutes.
Creating entity-relationship diagrams on Mac is fun and effortless when you use a software designed for professional ERD drawing tailored to specific characteristics of Apple OS X. ConceptDraw DIAGRAM is a business diagramming software for those using OS X.
The Entity-Relationship Diagrams solution for ConceptDraw has 2 libraries containing about 50 vector icons, depicting ERD symbols of the most popular Chen's and Crow’s Foot Notations. The other valuable component of the solution is a collection of ERDs samples and templates that can be opened on Macs and PCs.
Picture: Drawing ER diagrams on a Mac
Related Solution:
Despite the fact that the maps surround us everywhere in our life, usually the process of their drawing is sufficienly complex and labor-intensive. But now, thanks to the ConceptDraw DIAGRAM diagramming and vector drawing software extended with Germany Map Solution from the Maps Area of ConceptDraw Solution Park, we have the possibility to make easier this process. Design fast and easy your own pictorial maps of Germany, map of Germany with cities, and thematic Germany maps in ConceptDraw DIAGRAM!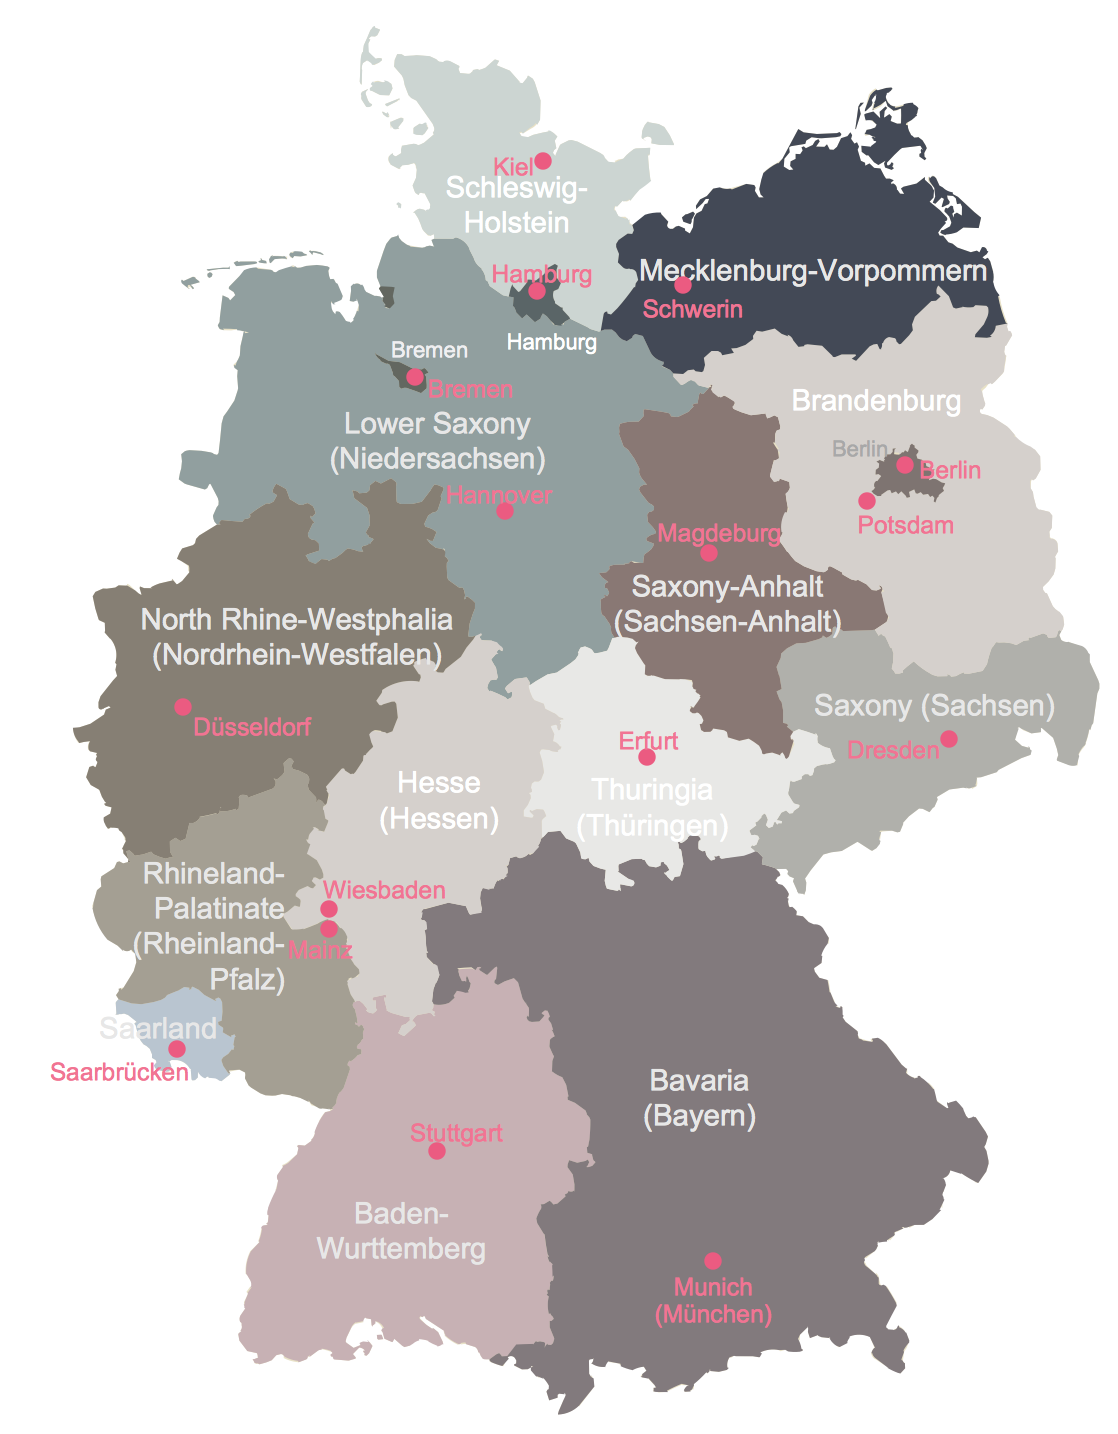
Picture: Maps of Germany With Cities
Related Solution:
What is a Concept Map and what software is effective for its design? A concept map or conceptual diagram is a diagram that depicts suggested relationships between concepts. As for effective software - we suggest you to pay attention for the ConceptDraw DIAGRAM diagramming and vector drawing software. Extended with Concept Maps Solution from the Diagrams Area it is a real godsend for you.
Picture: What Is a Concept Map
Related Solution:
The Social Media Response solution creates interactive social media flow charts and action mind maps. The solution includes a video tutorial and a number of samples helping social media teams refine and organize their response process.
Picture: How to Connect Social Media DFD Flowchart with Action Maps
Related Solution: