Flowchart Definition: A Complete Guide
What is a Flowchart? An In-Depth Definition
Acquaintance with flowcharting starts from getting into basic terms. Flowchart definition is quite clear — a Flowchart is a graphical representation of the structure of a process or system, algorithm, or step-by-step solution of a problem. It describes the flow of data through an information processing systems and the parts of the flows. The flow, in turn, is a set of logic operations that meet certain requirements.
Specific shapes and graphic symbols linked by lines and directional arrows are used to depict the steps. The main standard shapes are rectangle or box, rounded box, diamond, and circle.
Representing some kind of process, system, algorithm, or some problem’s solution by showing it as a structured scheme is always better in a way of Flowchart. It is a convenient way to observe the follow of the process from beginning to end, it lets improve the work of process, highlight the key elements, and detach not essential or even excessive steps. It is a way to follow the logical operations that happened, in order to illustrate it.
Creating a Flowchart diagram is a way to see how the system or process can be improved. Also, it allows us to find the key elements of the system and to edit them the way they have to look in the end. When looking for the final solution, it is necessary to structure the basic information and to make this data work the way it pleases you.
Simplifying Complex Processes: Types of Flowcharts
The Flowcharts can have different levels of detail. One differs the following types, which have their strengths and weaknesses:
- High-Level Flowchart displays the entire system, the most important steps or activities of the process. It also identifies the changes that take place in the process. It is a flowchart simple to construct.
- Detailed Flowchart represents all the steps and activities that take place in the process, decision points, and waiting periods. It is a detailed picture of the process that allows defining the problems and the areas of ineffectiveness that must be reworked and improved.
- Deployment or Matrix Flowchart is a Flowchart in the form of a matrix that shows the participants of the process and the flows of steps between them.
One differs also the following most common types of Flowcharts:
- Process Flowcharts
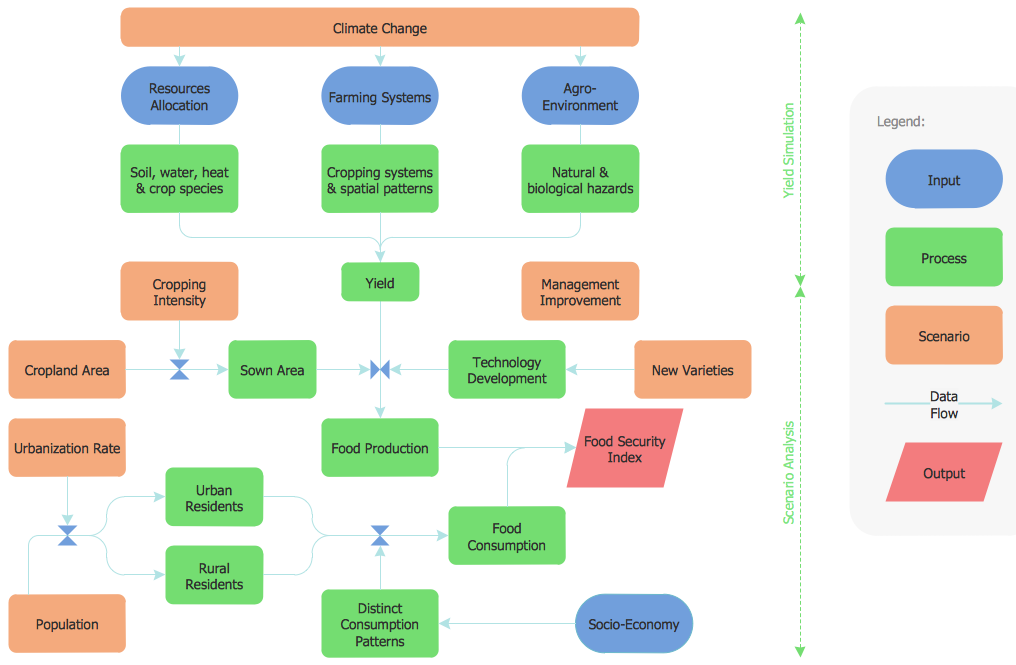
- Data Flow Diagrams
- Swimlane Flowcharts
- Workflow Flowcharts
- Cross-Functional Flowcharts

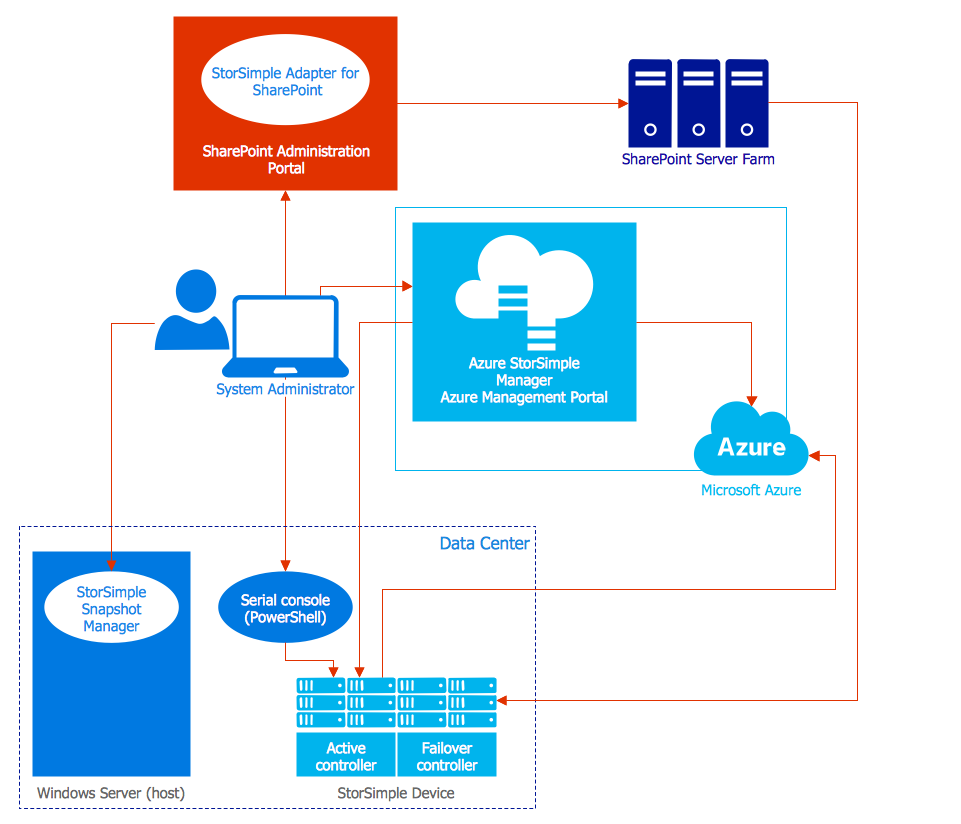
Example 1. Flowchart Definition with ConceptDraw DIAGRAM (MacOS™ and Windows™)
A Complete Guide to Flowchart Purpose
A Flowchart allows us to see how the work of the process can be improved, find the key elements of the process, and detach the steps that are not essential or even excessive. Flowcharting is an irreplaceable tool for IT specialists, project managers, and anyone who wants a clear understanding of any imaginable process. Flowcharts are useful in business, help to clarify processes, improve communication, and streamline operations. They play a critical role in marketing by helping to visualize strategies, campaigns, and workflows. Flowcharts bring clarity to complex processes, enhance collaboration, and ensure smoother execution of marketing plans. They are also perfect illustrative materials for education.
Flowcharts are incredibly useful for programmers when developing programs of any complexity and using any high-level language. The programmers use them to draw on the first stage of computer program development. Flowcharts give a simple understanding of the logic of complex problems and help to explain their solution to other people, they allow to form a common understanding of the process among the participants. An especially effective way of creating Flowcharts is the group discussions, because the participants may not know completely the details of the whole process. The Flowcharts allow us to see the inputs or resources of the team members and help to identify the areas for monitoring, improvement, or increased efficiency.
Flowchart Notation
The American National Standard Institute (ANSI) was provided the standard flowchart symbols (process symbols, decision symbols, terminators, connectors, flow lines, and some others) and rules for creating the Flowcharts. Here are some main standard symbols:
- Rectangle or box is used to represent the activity or the step. Each step or activity inside a process is indicated by a single rectangle. It is the most often used symbol.
- Rounded box is used to represent the events that occur automatically and cause the next action.
- Diamond is used for representing the decision point. This symbol involves the branching yes/no. It is necessary to answer the question written inside the diamond and make the decision that will determine the next step.
- Circle is used to represent the point at which the Flowchart connects with another process.
- Flow lines are used to show the progression or transition from one step to another.

Example 2. Flowchart Definition — Order Process Flowchart
The Flowchart Constructing Involves the Following Steps:
The Flowchart creation is easy when you have a powerful application ConceptDraw DIAGRAM. Use it for step by step Flow chart drawing:
- Define the process and the scope of the Flowchart.
- Determine the project team members for creating a Flow chart.
- Define the steps of the process and the interrelations between them. Use the "five-minute rule" which means to put the symbol no longer five minutes; if the decision is unclear, put a note or a cloud symbol and go next.
- Discuss the Flowchart with all the participants. Analyze the symbols and transitions. Verify the decision symbol generates the responses yes or no and the flow of the diagram is logical. Examine the improvement and problem areas. Make the modifications and create the final variant of the Flowchart.
- Update the Flowchart, as needed.
ConceptDraw DIAGRAM Flowcharting Software
Flowchart is perhaps the most common form of diagrams used in both technical and social fields. Since a Flow chart is a method that allows to describe visually any consequent process and it can be used to show the flow of logic of any process.
Creating your own Flowchart, simple or detailed Flow diagram is fast and easy using the powerful ConceptDraw DIAGRAM diagramming and vector drawing software. Use the tools of the Flowcharts solution from the Diagrams area to create quickly and easily various types of Flowcharts which will help visually explain the flowchart definition and symbols.
The Flowcharts solution is available for all ConceptDraw DIAGRAM users from the ConceptDraw STORE. All source documents are vector graphic documents. They are available for reviewing, modifying, or converting to a variety of formats such as PDF file, MS PowerPoint, MS Visio, and many other graphic formats.
")
Example 3. ConceptDraw STORE (Flowchart solution)
Examples
Many different Flowcharts are well known and available nowadays in ConceptDraw STORE as there are lots of stencil libraries, samples, and templates that can be helpful in using the best program for flow chart ConceptDraw DIAGRAM while creating any kind of chart you need. Simple Flowchart, High-level Flowchart, Deployment or Matrix Flowchart, as well as detailed ones, is not a comprehensive list of existing Flowcharts and you have this chance today to make your own professional charts using our software.
The samples you see on this page were created in ConceptDraw DIAGRAM flowchart program using the tools of the Flowcharts solution for ConceptDraw DIAGRAM Solution Park. An experienced user spent 10 minutes creating these samples.
Conclusion
ConceptDraw DIAGRAM flowcharting and vector diagramming software is over 30 years of demonstrated value and a strong emphasis on customer experience. We provide innovative products, a free customer resource center, and no charge live support & web support.
Create your own Flowcharts of order processing steps and explain the definition flowchart using the best flow chart program ConceptDraw DIAGRAM extended with Flowcharts Solution from the Diagrams area of ConceptDraw Solution Park.