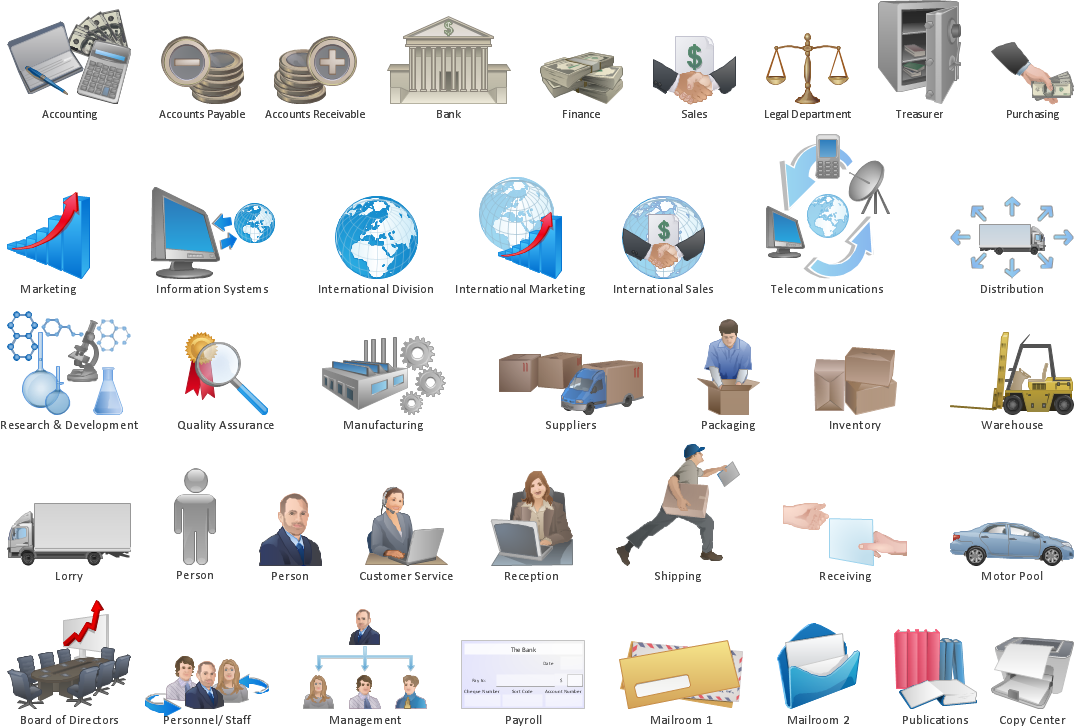
Pic. 1 Design elements of Workflow diagram.
The Workflow Diagrams solution extends ConceptDraw DIAGRAM software with samples, templates and library of vector stencils for drawing workflow charts.

Pic. 2 Drawing Workflow Diagrams (Mac OS X® and Windows®)
Workflow diagrams represent the transferring of data, documents, and tasks during performance of a work process.

Pic. 2 Workflow Diagrams solution
Use workflow flowcharts to analyze the work processes, to show the path of the tasks, the responsible persons and the associated documents, to identify required resources, to optimize a workflow, and to discover its inherent weak points.
See also Samples:
NINE RELATED HOW TO's:
Relationships Analysis. Relations Diagram - factors analysis, factors relations. Create Relations Diagram with ConceptDraw DIAGRAM.
The Seven Management and Planning Tools is a tool for Interaction diagram drawing. This diagram identifies causal relationships. Determine what factors are causes and which factors are effects. Interaction diagram helps establish KPIs to monitor changes and the effectiveness of corrective actions in resolving the problem.
Picture: Relationships Analysis
While creating flowcharts and process flow diagrams, you should use special objects to define different statements, so anyone aware of flowcharts can get your scheme right. There is a short and an extended list of basic flowchart symbols and their meaning. Basic flowchart symbols include terminator objects, rectangles for describing steps of a process, diamonds representing appearing conditions and questions and parallelograms to show incoming data.
This diagram gives a general review of the standard symbols that are used when creating flowcharts and process flow diagrams. The practice of using a set of standard flowchart symbols was admitted in order to make flowcharts and other process flow diagrams created by any person properly understandable by other people. The flowchart symbols depict different kinds of actions and phases in a process. The sequence of the actions, and the relationships between them are shown by special lines and arrows. There are a large number of flowchart symbols. Which of them can be used in the particular diagram depends on its type. For instance, some symbols used in data flow diagrams usually are not used in the process flowcharts. Business process system use exactly these flowchart symbols.
Picture: Flowchart Symbols: Meaning and Examples
Related Solution:
Database design is an important part of any project, as databases become more and more complex nowadays. To make the model more representative, entity relationship diagrams are widely used in software engineering area. These diagrams show sets of entities as rectangles connected via lines labeled with their cardinalities.
This an example of the ER-diagram developed to store information regarding some online role-playing game. It includes three main elements of ER diagram: entities, relationships and attributes. The entities, attributes and relationships on this ER-diagram is depicted according to the Chen's notation. Chen's notation for Entity Relationship diagrams admits using of rectangles to depict entities, ovals for attributes and ,at least, diamonds to show relationships. ConceptDraw Entity-Relationship Diagrams solution was applied as ERD software to create this diagram.
Picture: ConceptDraw DIAGRAM ER Diagram Tool
Related Solution:
Event-Driven Process Chain Diagrams for improvement throughout an organisation.
ConceptDraw DIAGRAM - software that reduces the time needed to create a business process model.
Picture: Beauty of Event-driven Process Chain (EPC) diagrams
Related Solution:
Automatically create a presentation-quality diagram in one click with ConceptDraw DIAGRAM.
Picture: Visual Presentations Made Easy with Diagramming Software
Related Solution:
When thinking about the process of decision making, it's easy to imagine it as a pyramid. We will look at a three level pyramid model as an example. Operational decisions are first that come to mind, and it's the first level. Tactical and strategic decisions are the second and the third levels.
Pyramid (triangle) diagrams are used to show some hierarchical data. Because to the pyramid form of diagram, each diagram slice has a different width. The width of each segment depends on its hierarchical level.
The current image illustrates the model of information system types. Most graphically the model can be represented as a three level pyramid. The first level shows a system of transaction processing It is concentrated on operational tasks. The second level is devoted to tactical solutions of the information system management. And at least, the third level addresses strategy and represents the executive information system. This three level pyramid sample is supplied with the ConceptDraw Pyramid Diagrams solution from Marketing area of ConceptDraw Solution Park.
Picture: Pyramid Diagram
Related Solutions:
ConceptDraw DIAGRAM diagramming and vector drawing software extended with Target and Circular Diagrams solution from the Marketing area of ConceptDraw Solution Park is perfect for the Circular Flow Diagram creating.
Picture: The Circular Flow Diagram
Related Solution:
This sample was created in ConceptDraw DIAGRAM diagramming and vector drawing software using the Workflow Diagrams Solution from the Software Development area of ConceptDraw Solution Park.
This sample shows the Workflow Diagram that clearly illustrates stages a BPM consists of and relations between all parts of business. The Workflow Diagrams are used to represent the transferring of data during the work process, to study and analysis the working processes, and to optimize a workflow.

Picture: Software Work Flow Process in Project Management with Diagram
Related Solution:
To pull a social media team together, to set your objectives, to develope an integrated communications strategy.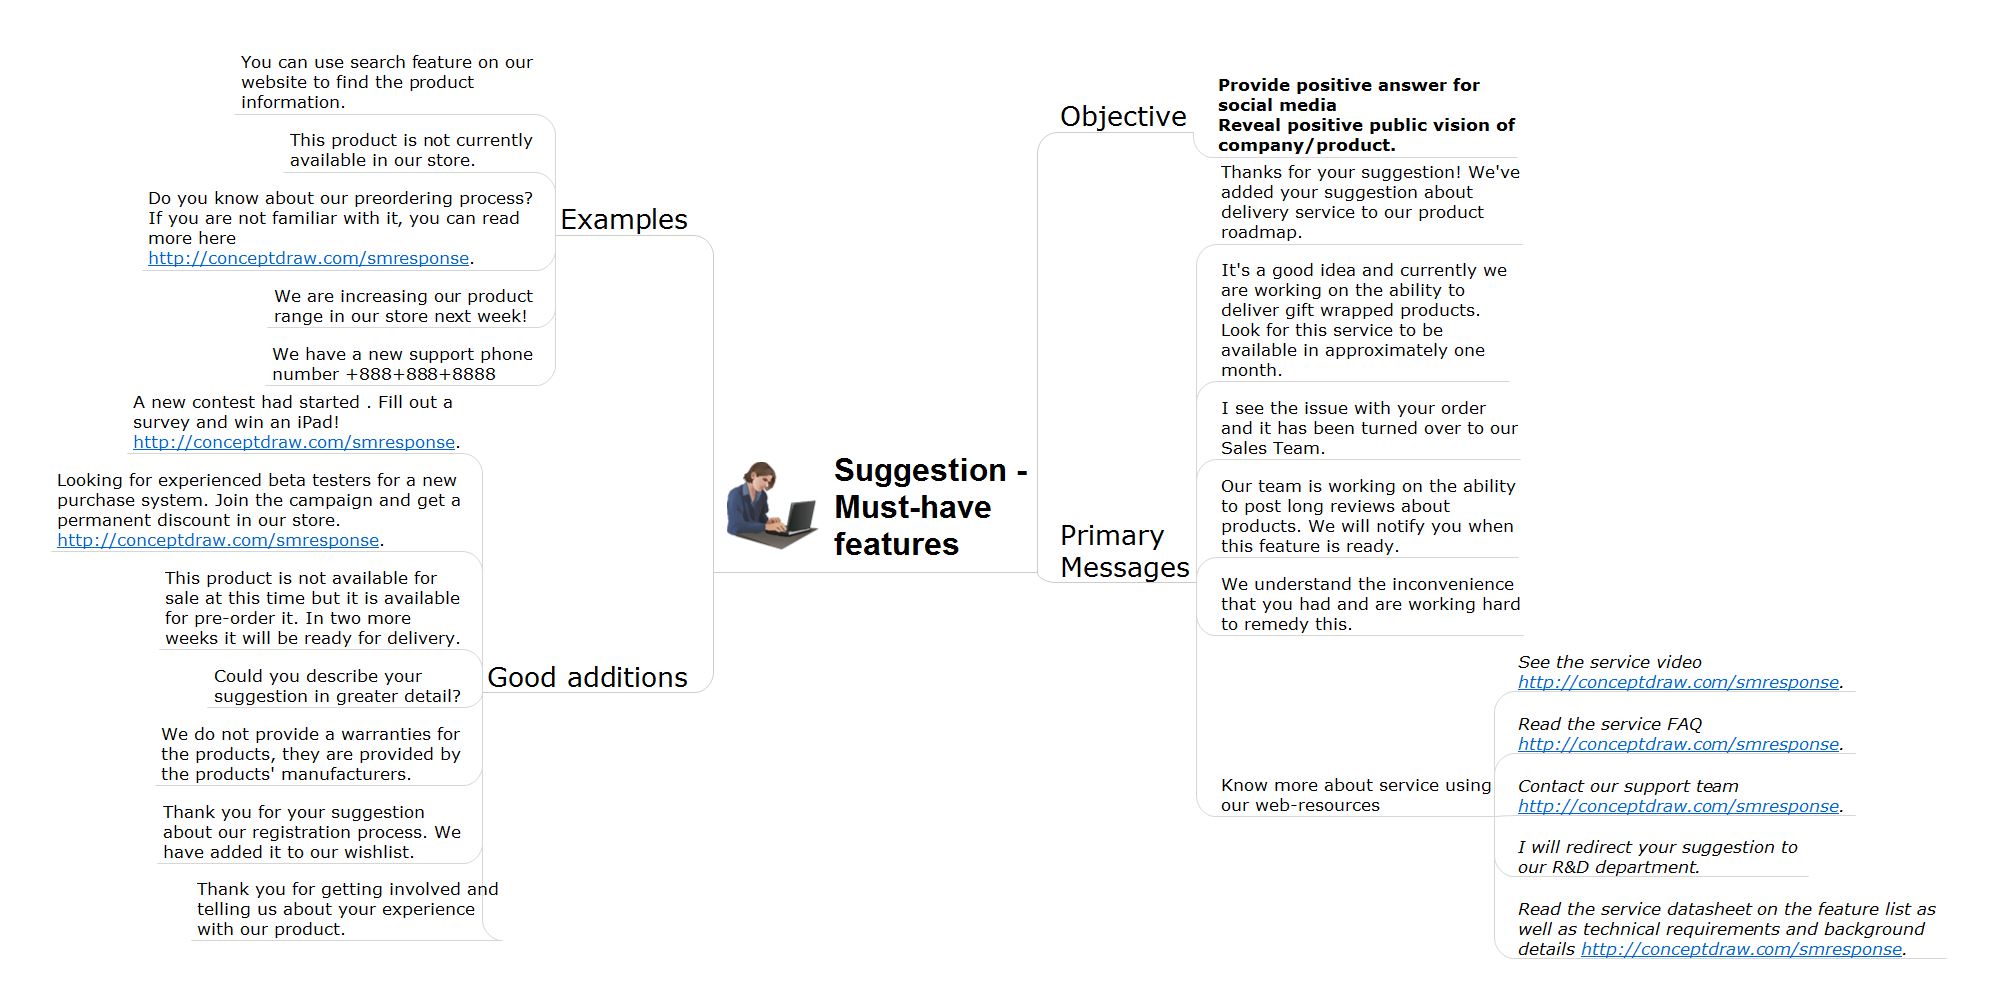
Picture: How to Present Workflow to Team
Related Solution:

