Business Productivity - Management
ManagementBenefitsManagement Diagrams (Matrixes, Deployment Charts, Organizational Charts, Cause & Effect (Fishbone) Diagrams, Timelines) and Mind Maps (decision making, scheduling, thinking ideas, problem solving, business planning, company organizing, SWOT analysis, preparating and holding the meetings and presentations). ObjectiveVisually document and communicate information to management. Solution PurposeBuild management diagrams and mind maps quickly and easily. Intended ForManagers who want to improve their productivity by using visual documenting and communication tools. Products and methodsTo support you in your tasks you can use the power of ConceptDraw DIAGRAM providing intelligent vector graphics that are useful for management diagramming and ConceptDraw MINDMAP for key management mind maps. |

Example 1. Business Planning
Example 2. Company Organization
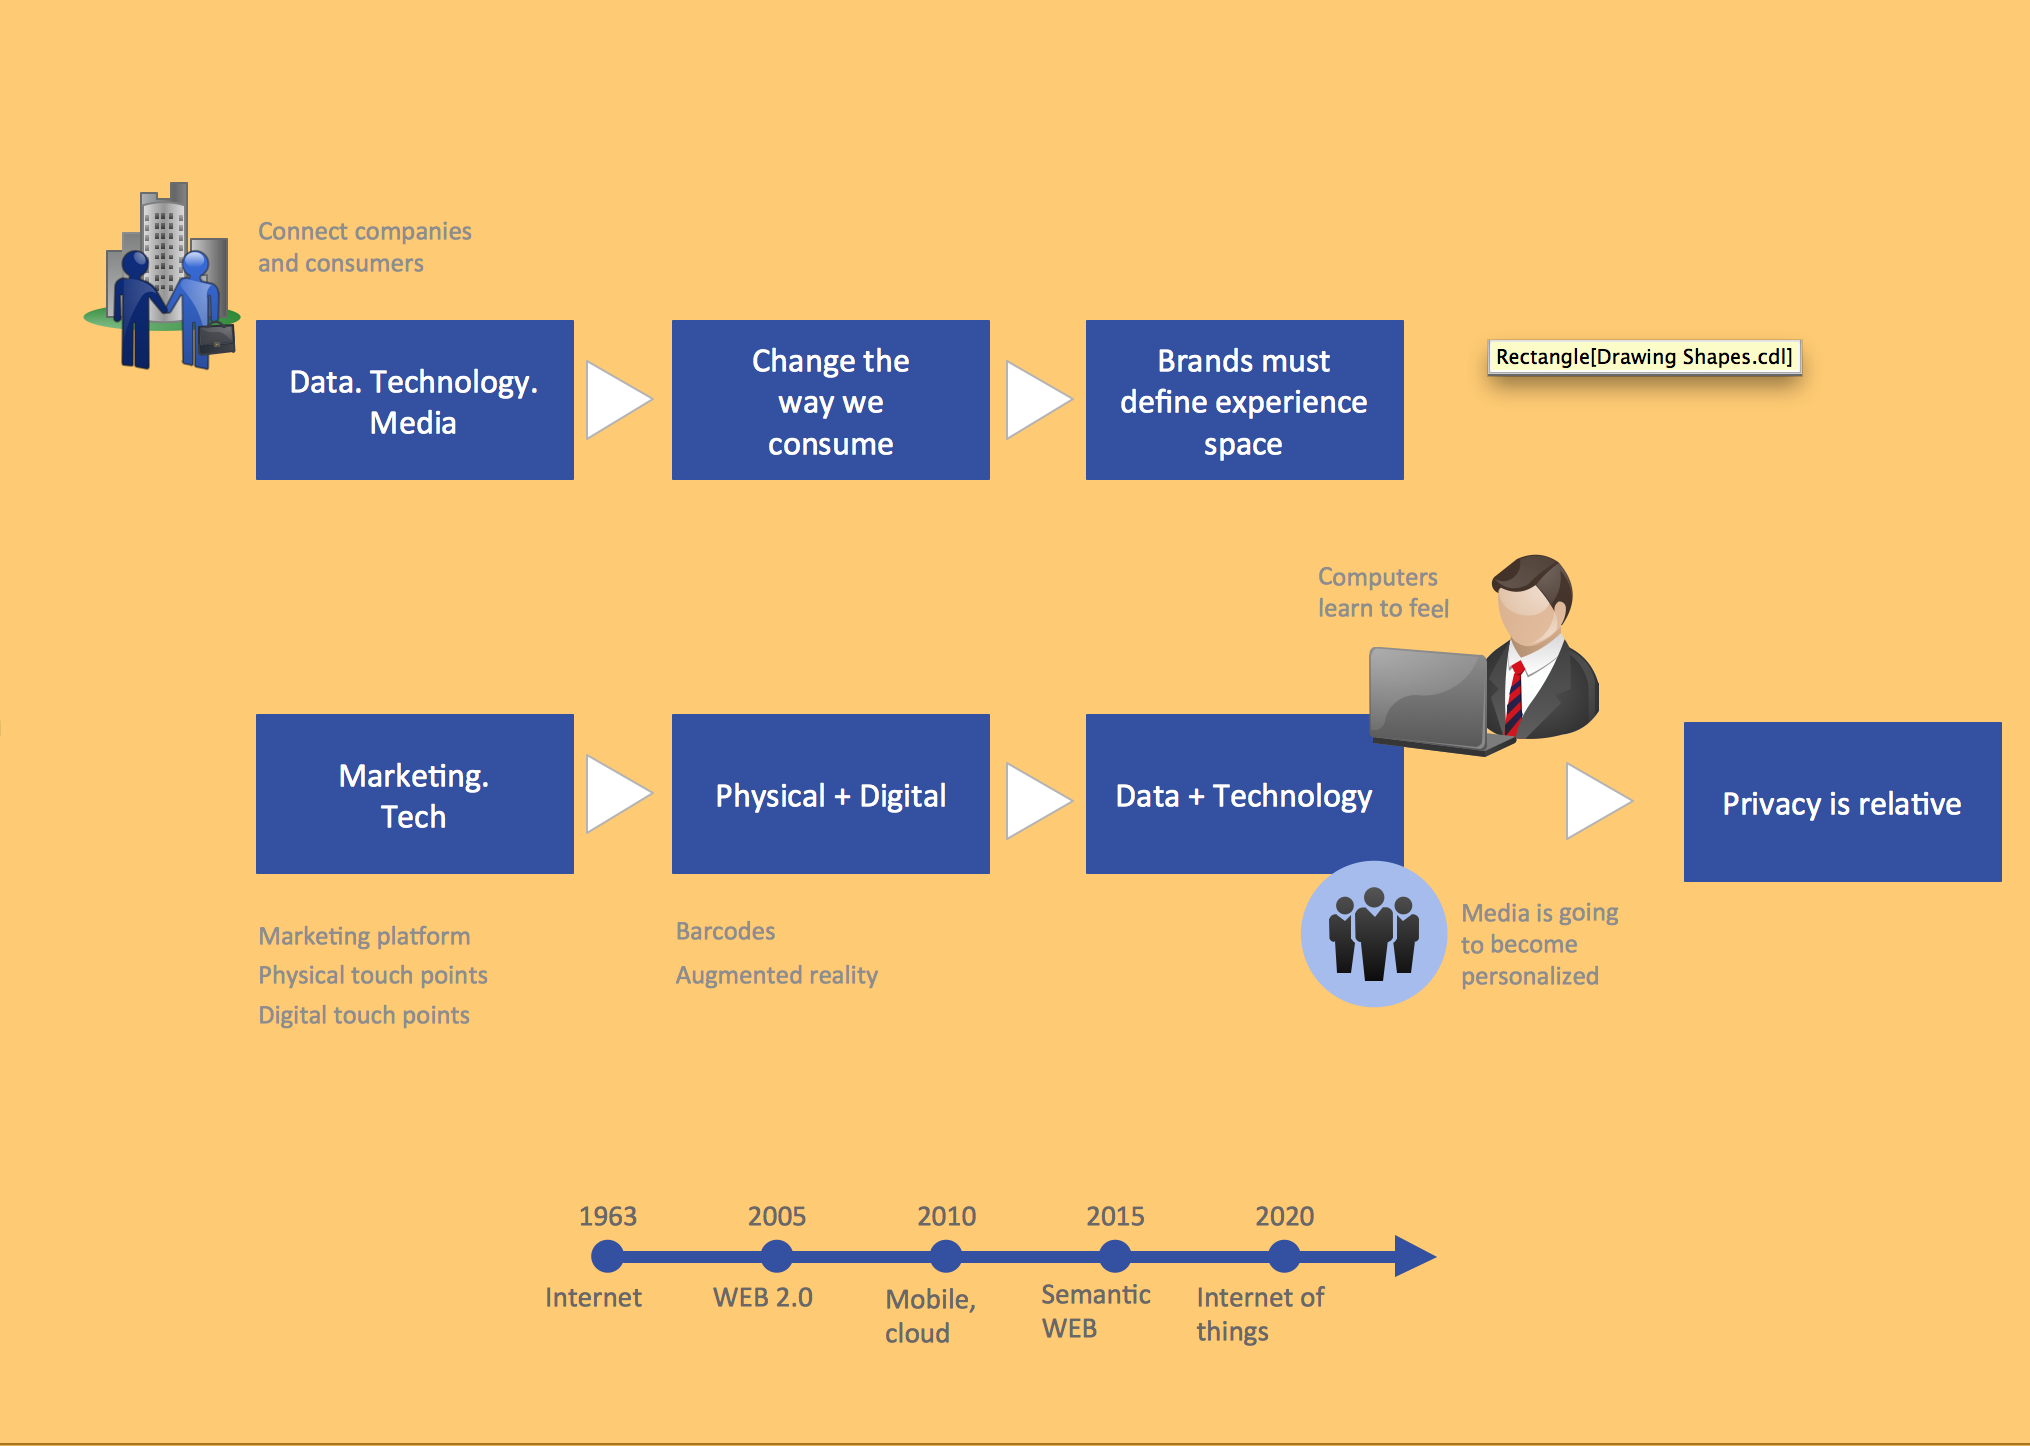
Example 3. Strategy Map
Example 4. SWOT Analysis
Example 5. Department Organizational Chart
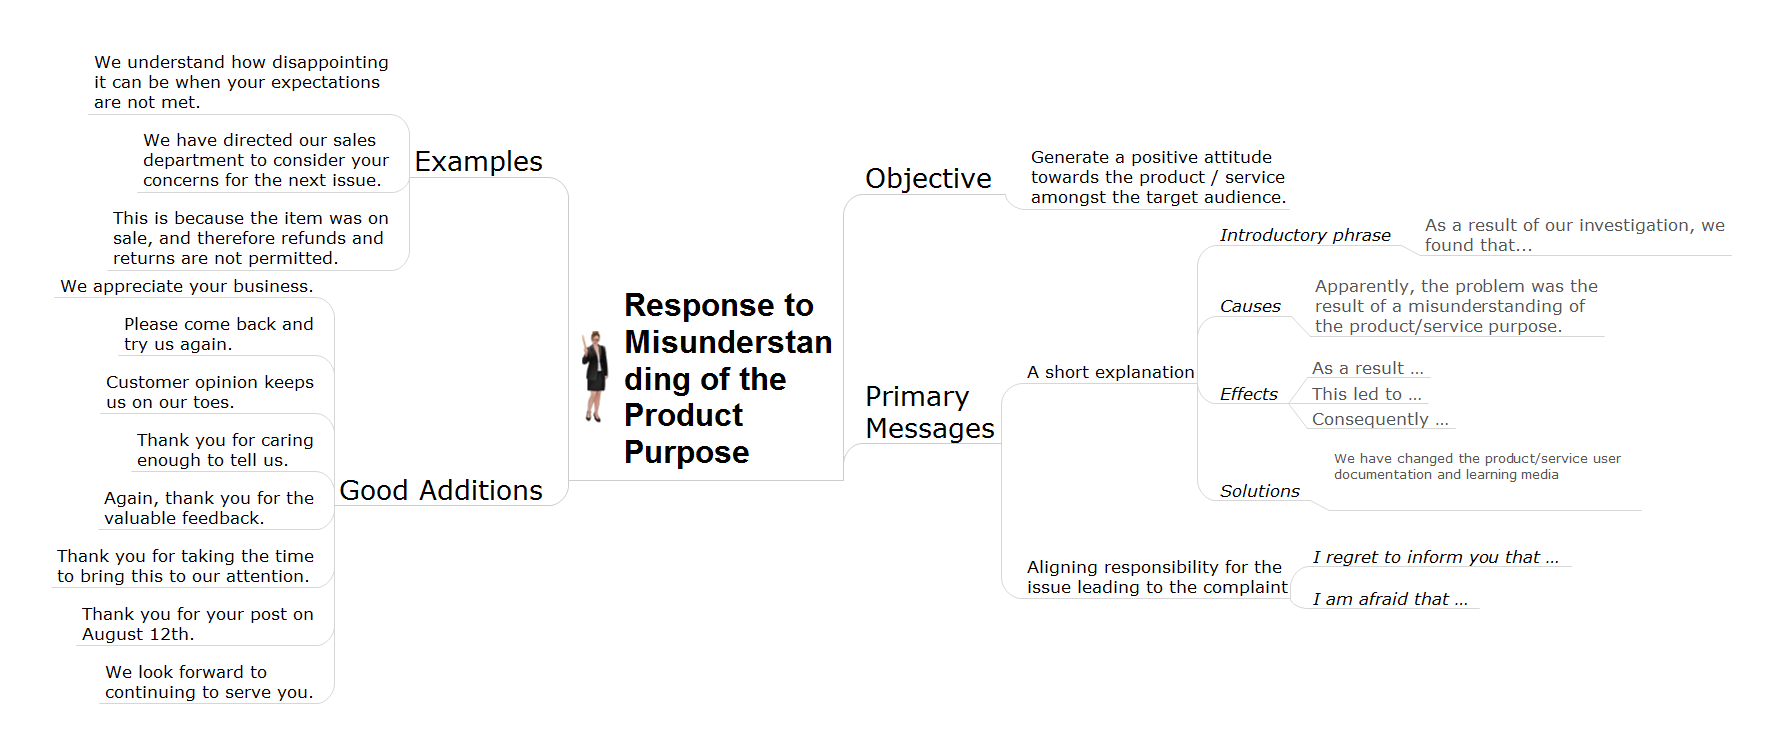
Example 6. Management Decision Making
Example 7. Organizational Chart
The Benefits for ConceptDraw MINDMAP Brainstorming Software
- ConceptDraw MINDMAP is effective for brainstorming, designing mind maps, idea generating, creative and lateral thinking, creativity and problem solving.
- ConceptDraw MINDMAP is ideal for team and personal work in Business, Marketing and Project Management.
- The libraries with large quantity of vector objects help to illustrate your mind maps and to make them bright, visual and comprehensible.
- Use of View Navigator tool lets create presentations from a mind map: you can simply select the map parts you want to present, sequence your slides, and preview the presentation.
- ConceptDraw MINDMAP provides wide capabilities of importing and exporting in various formats: Microsoft PowerPoint, Microsoft Word, MS Excel, Mindjet MindManager, image, HTML, PDF file.
TEN RELATED HOW TO's:
Quality Mind Maps - samples and templates →
Use samples and templates to describe your own quality processes, brainstorm, and structure quality issues.
Response to Complaint →
This action mindmap helps to respond to customer complaints and quickly composes short or long response messages. The example contains ready to use response phrases organized into a mindmap for quick composing and tweeting/posting of response messages.
Address to User Story Question →
This action mindmap helps respond to questions related to a user story from customers looking for advice on product applicability for professional tasks. The example contains ready to use response phrases organized into a mindmap for quick composing and tweeting/posting of the response messages.
Social Brand Strategy →
A mindmap organizing research and methods for social brand strategy.
Hypercube Network Topology →
This sample was created in ConceptDraw DIAGRAM diagramming and vector drawing software using the Computer and Networks solution from Computer and Networks area of ConceptDraw Solution Park. This sample shows the Hypercube network topology. Network topology is the topological structure of the computer network. Hypercube is a type of the toroidal network. The Torus is a topology with n-dimensional grid network with circularly connection of the nodes. If the number of nodes along each dimension of the toroidal network is 2, it is a Hypercube network topology.
Create Organizational Chart →
Creating diagrams and schemes is a pleasure with proper software. You don’t need any additional skills to create organizational chart quick and effectively with our diagramming tool. Create your ConceptDraw account today and start your diagramming experience. This is the most regular type of organizational chart - hierarchical. It is created using the ConceptDraw Organizational Charts solution. Its composition can be displayed as a pyramid, with an only person in authority at the top, with sub-levels of management below them. According to hierarchy, an employee communicates only to his immediate head or subordinates. A hierarchical organizational structure may be choice for a businesses that work on multiform markets or any other organization that has a workflow requiring a multilevel structure of middle management.
Risk Diagram (Process Decision Program Chart) →
Analyze each identified action separately in the tree of all actions and then develop a preventive action in response to potential obstacles or circumstances have been identified as a risk. The PDPC determines the risks when corrective action is not performed correctly. Also, it helps develop descriptions for preventive actions at the level of execution.
7 Management & Planning Tools →
The "7 Management and Planning Tools" solution implements well-known methodologies for problem analysis and solving. Different products from the ConceptDraw Office suite can be used as a complete solution for any of the methodologies in this solution. ConceptDraw Office provides visual communication during every stage of work.
Quality Mind Maps →
ConceptDraw map templates are great starting points to identify, track, and address quality initiatives in your organization.