What is a Cross Functional Flow Chart?
Drawing diagrams fast
How should diagramming software work? Is it possible to develop a diagram as quickly as the ideas come to you?
The innovative ConceptDraw Arrows10 Technology included in ConceptDraw DIAGRAM is a powerful drawing flowcharting software that changes the way diagrams are produced. While making the drawing process easier and faster.
ConceptDraw DIAGRAM is a powerful tool that helps you create professional looking cross-functional flowcharts with the well-designed objects. ConceptDraw DIAGRAM allows you to focus on work, not the drawing process. ConceptDraw Arrows10 Technology allows to draw connectors with smart behavior that gives flexibility to you during work process.
See also Videos:
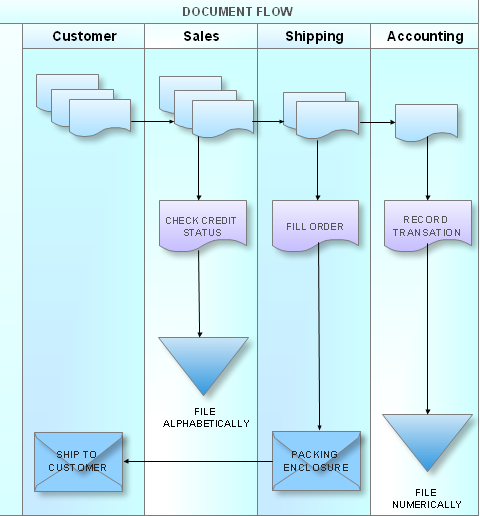
Sample 1. Cross-functional flowchart
TEN RELATED HOW TO's:
Accounts Payable Process Flow Chart - ConceptDraw DIAGRAM diagramming and vector drawing software extended with Accounting Flowcharts Solution provides the useful tools that will help you create easily and quickly.
The Accounts Payable Process Flow Chart is very popular and widely used type of accounting flowcharts. Now their designing is simple thanks to the Accounting Flowcharts Solution that provides the Accounting Flowcharts library of predesigned commonly-used shapes and a set of templates and samples.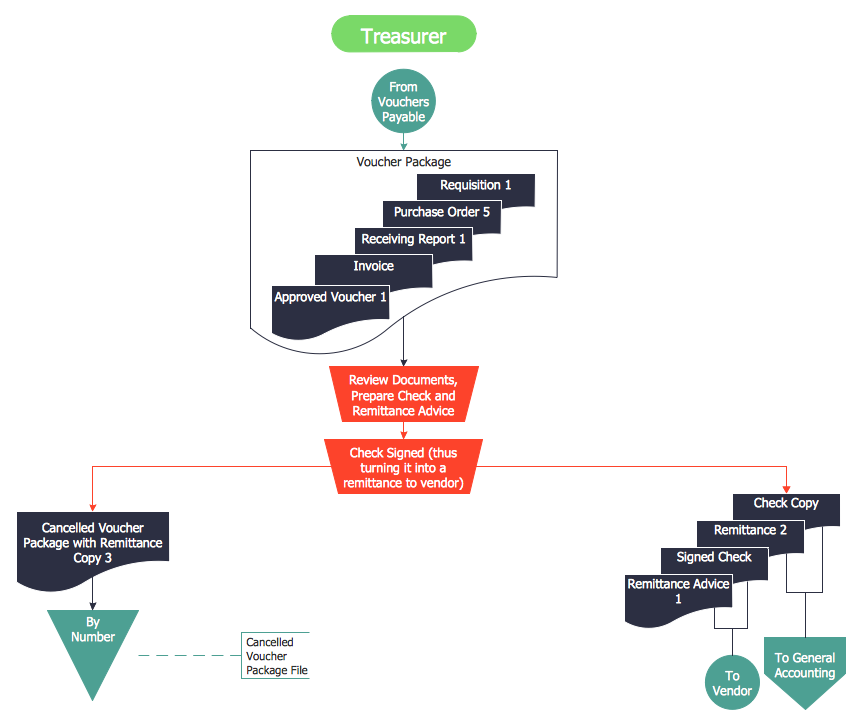
Picture: Accounts Payable Process Flow Chart
Related Solution:
Activity Network Diagram - This sample was created in ConceptDraw DIAGRAM diagramming and vector drawing software using the Seven Management and Planning Tools solution from the Management area of ConceptDraw Solution Park.
This sample shows the PERT (Program Evaluation Review Technique) chart of the request on proposal. A request for proposal (RFP) is a request of the company or the organization to potential suppliers to submit the business proposals for service or goods that it is interested to purchase. The RFP is represented on the initial procurement stage and allows to define the risks and benefits.
Picture: Activity Network Diagram Method
Related Solution:
Explore practical flowchart examples including business process diagrams, workflow charts, swimlane flowcharts, and IT troubleshooting flows. Review common patterns and start from ready templates.
Picture: Flowchart Examples
Related Solution:
The behavior of worker in organization is influences organizational effectiveness. A simple block diagram made with ConceptDraw Block diagrams solution can improve the understanding of expectations of workers regarding what they l contribute to organization and what they wait to obtain. Making block diagram depicting the individual behavior in organization is used in HR management to obtain an optimal and positive overall contribution to the organization.
The behavior of worker in organization is influences organizational effectiveness. A simple block diagram made with ConceptDraw Block diagrams solution can improve the understanding of expectations of workers regarding what they l contribute to organization and what they wait to obtain. Making block diagram depicting the individual behavior in organization is used in HR management to obtain an optimal and positive overall contribution to the organization.
Picture: Basic Diagramming
Related Solution:
If you want to use effective methods for your business, you may need a tool which may let you represent your ideas and goals in graphic way.
Software with different flowchart templates for each type of business will be your lifesaver. ConceptDraw DIAGRAM with its business samples, libraries and design elements is a point to start.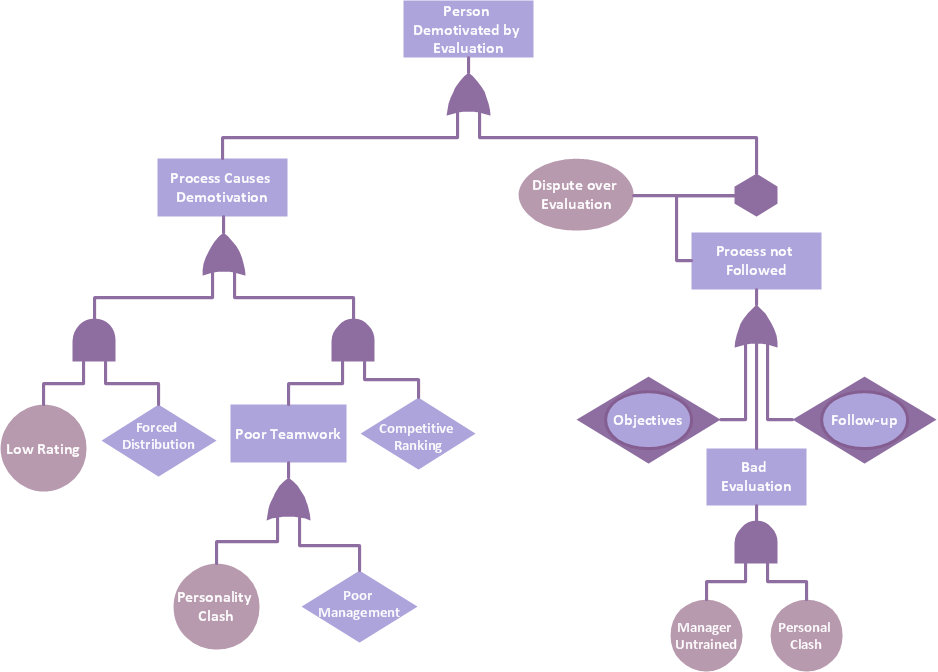
Picture: Graphics Software for Business
UML Interaction Overview Diagram schematically shows a control flow with nodes and a sequence of activities that can contain interaction or sequence diagrams.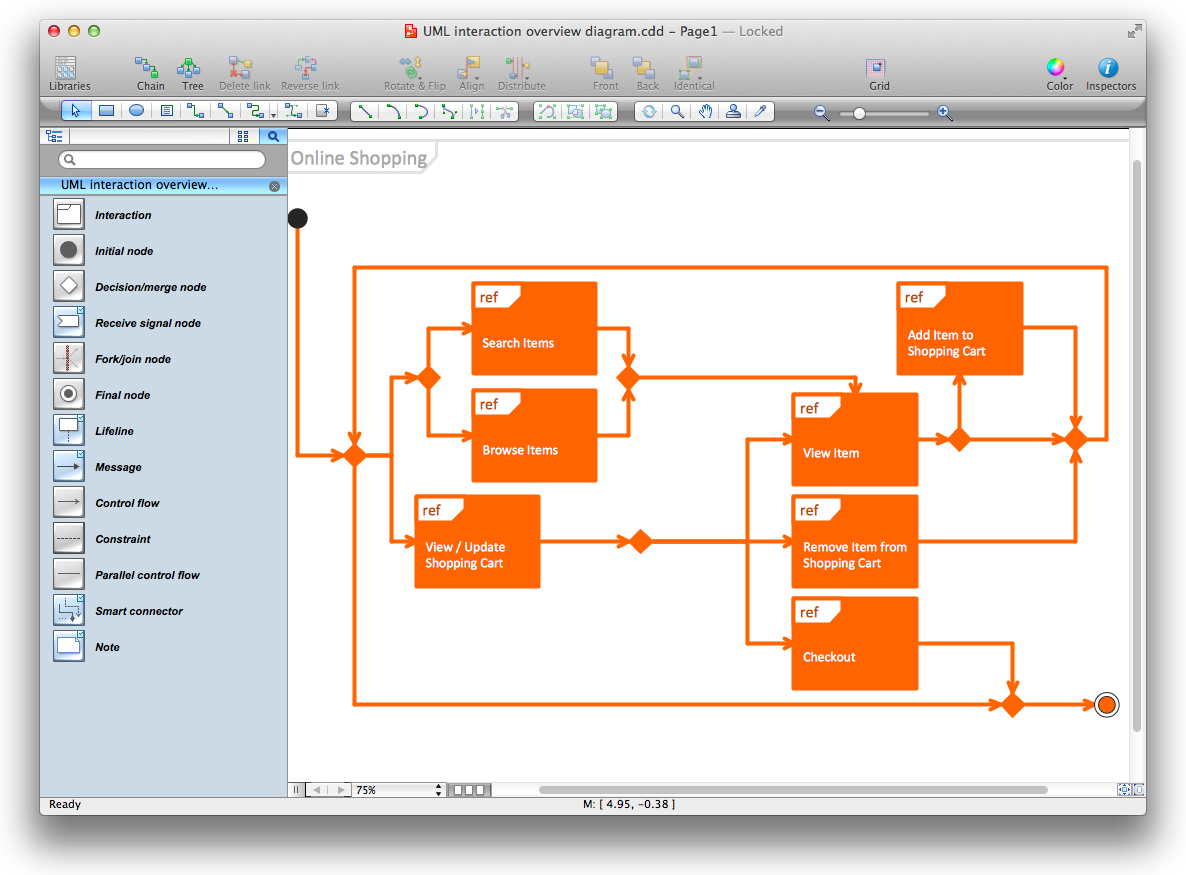
Picture: Diagramming Software for Design UML Interaction Overview Diagrams
The Total Quality Management Diagram solution helps your organization visualize business and industrial processes. Create Total Quality Management diagrams for business process with ConceptDraw software.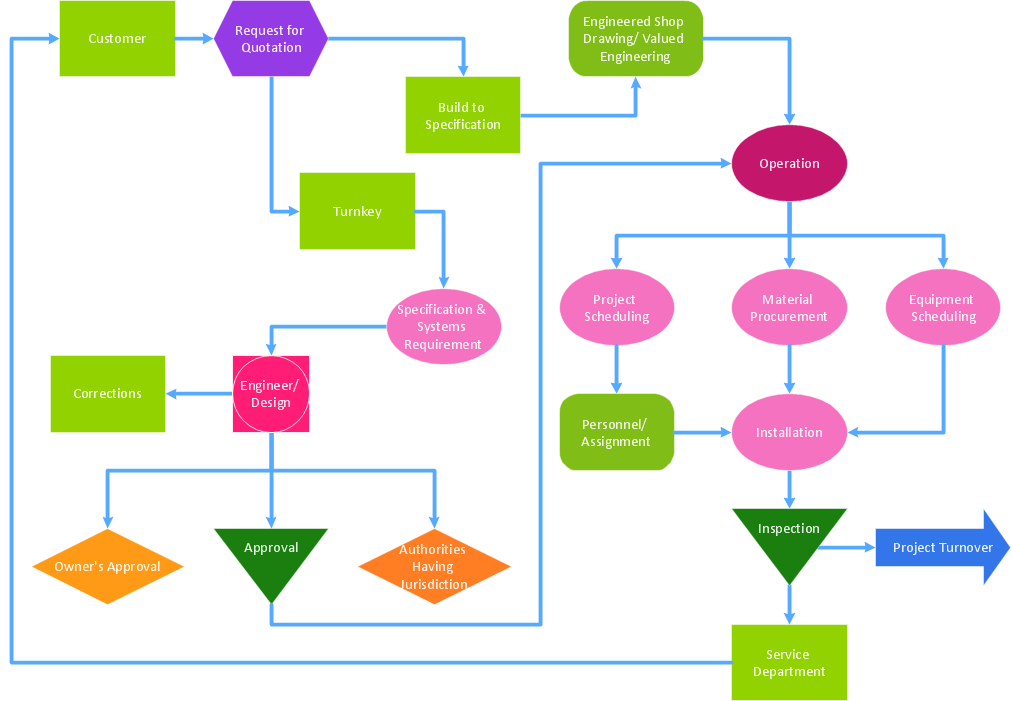
Picture: Best Value — Total Quality Management
Related Solution:
This sample was created in ConceptDraw DIAGRAM software using the Flowcharts solution.
Picture:
Copying Service Process Flowchart.
Flowchart Examples
Related Solution:
Chemical and Process Engineering solution contains variety predesigned process flow diagram elements relating to instrumentation, containers, piping and distribution necessary for chemical engineering, and can be used to map out chemical processes or easy creating various Chemical and Process Flow Diagrams in ConceptDraw DIAGRAM.
Picture: Process Flow Diagram Symbols
Related Solution:
When you need to focus on the problem, professional diagramming tool helps you create a Fishbone diagram also known as Ishikawa diagram. Understanding of the problem via Fishbone diagram will improve the processes between departments and teams.
ConceptDraw DIAGRAM extended with Fishbone Diagrams solution gives a powerful tool for improving problem solving and focus with Fishbone diagrams.
Picture: Improving Problem Solving and Focus with Fishbone Diagrams
Related Solution:
ConceptDraw
DIAGRAM 18