Flowchart Example: Flow Chart of Marketing Analysis
ConceptDraw DIAGRAM allows you to draw flowcharts of any complexity from very simple Flow Chart of Marketing Analysis example to multilevel marketing analysis flowcharts providing a marketing team with detailed instruction for marketing analysis for exact case. Use ConceptDraw DIAGRAM software extended with Marketing Diagrams solution from ConceptDraw Solution Park to produce a flow chart of marketing analysis.
Flow Chart of Marketing Analysis
The sample you see on this page was created in ConceptDraw DIAGRAM using the Marketing Diagrams solution, and demonstrates the solution's capabilities and the results you can achieve using this solution.
All source documents are vector graphic documents. They are available for reviewing, modifying or converting to a variety of formats (PDF file, Power point Presentation, image or MS Visio) from ConceptDraw STORE, for all users who have installed Marketing Diagrams solutions.
TEN RELATED HOW TO's:
During the planning, discussing and execution of a project you may need to prepare a presentation using project views such as the Gantt Chart, Multiproject Dashboard or Resource Usage View. It’s easy do with ConceptDraw PROJECT!
Picture: How to Create Presentation of Your Project Gantt Chart
Process mapping helps with sharing business results and reorganizing workflow. In almost every case, after creating a sales process flowchart the steps that are redundant become obvious for a manager. It's easy to find a flowchart examples that will help in developing one for your business.
This sales process flowchart consists of a sequence of steps that represent a simple sale process. Each step is shown graphically by a rectangle representing processing steps or an activity, or a diamond representing a decision. These rectangles are linked by arrows, that indicate the direction of the sales workflow. ConceptDraw Sales Flowcharts solution delivers a the full set of classical flowchart notation symbols, along with sales-related icons and pictograms.
Picture:
Sales Process Flowchart
Flowchart ExamplesRelated Solutions:
A Data Flow Diagram (DFD) is a graphical technique which allows effectively model and analyze the information processes and systems. The ability to fast and easy create the DFDs is made possible with Data Flow Diagrams solution from the Software Development area of ConceptDraw Solution Park. For designing the Data Flow Diagrams are used simple DFD flowchart symbols which are connected each other by arrows depicting the data flow from one step to another.
Picture: DFD Flowchart Symbols
Related Solution:
Organizing and Selecting Social Media Response Messages.
Interactive Flowcharts can change the way one creates and organizes their social media response process.
Picture: What is Interactive Flowcharts
Related Solution:
If you want to find a way to understand complex things in minutes, you should try to visualize data. One of the most useful tool for this is creating a flowchart, which is a diagram representing stages of some process in sequential order. There are so many possible uses of flowcharts and you can find tons of flow charts examples and predesigned templates on the Internet. Warehouse flowchart is often used for describing workflow and business process mapping. Using your imagination, you can simplify your job or daily routine with flowcharts.
Warehouse flowcharts are used to document product and information flow between sources of supply and consumers. The flowchart provides the staged guidance on how to manage each aspect of warehousing and describes such aspects as receiving of supplies; control of quality; shipment and storage and corresponding document flow. Warehouse flowchart, being actual is a good source of information. It indicates the stepwise way to complete the warehouse and inventory management process flow. Also it can be very useful for an inventory and audit procedures.
Picture: Flow Chart Example: Warehouse Flowchart
Related Solution:
An example flowchart of marketing analysis shows main steps you have to challenge writing a marketing analysis.
Picture: Flowchart Example: Flow Chart of Marketing Analysis
Related Solution:
Many professionals have to solve problems every day. Designing of the process algorithm contribute to understand where the problem is in the process. A Flowchart is a graphical tool that most usable for breaking down processes.
Definition of flowchart - a diagram that shows step-by-step progression through a procedure or system especially using connecting lines and a set of conventional symbols.
All the icons, symbols and connectors needed for creating standardized notation flowcharts are contained within Software Flow Chart.
Picture: Software Flow Chart
Related Solution:
ConceptDraw RapidDraw technology is a simple point-and-click design that helps create professional, presentation-ready business process diagrams quickly and efficiently.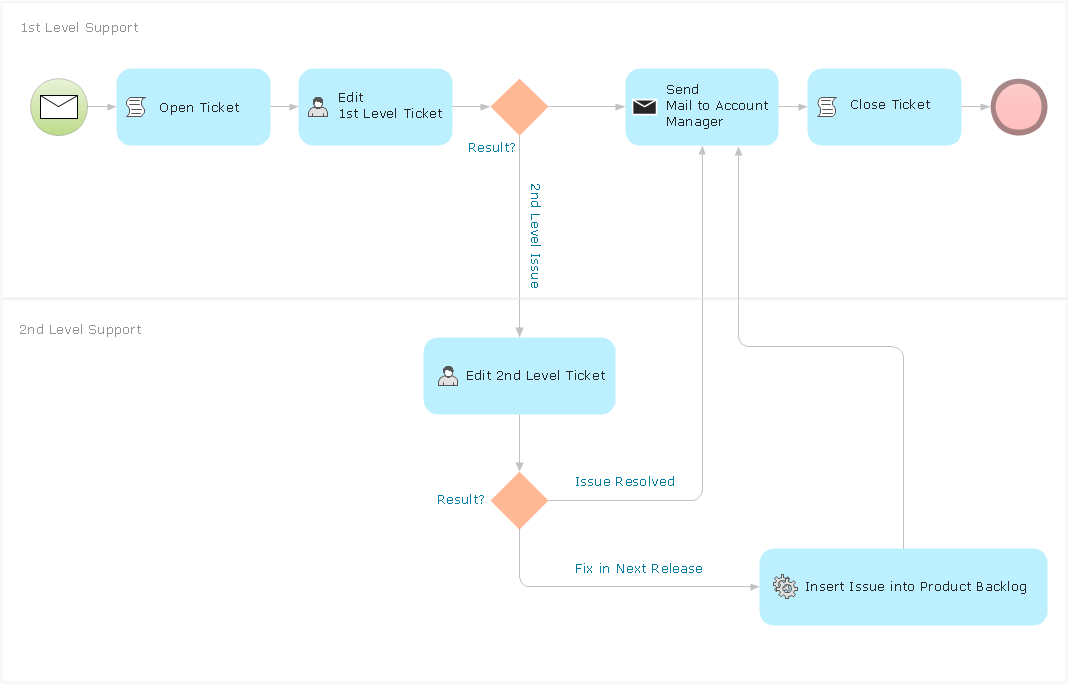
Picture: Business Process Management
Lean Six Sigma (LSS) is a well-known in all over the world methodology of quality improvement and business perfection. ConceptDraw DIAGRAM diagramming and vector drawing software is a powerful Lean Six Sigma Diagram Software thanks to the included Value Stream Mapping solution from the Quality Management Area of ConceptDraw Solution Park.
Picture: Lean Six Sigma Diagram Software
Related Solution:
Start your business process mapping with conceptDraw DIAGRAM and its Arrows10 Technology. Creating a process map, also called a flowchart, is a major component of Six Sigma process management and improvement. Use Cross-Functional Flowchart drawing software for business process mapping (BPM).
Use a variety of drawing tools, smart connectors and shape libraries to create flowcharts of complex processes, procedures and information exchange. Define and document basic work and data flows, financial, production and quality management processes to increase efficiency of you business.
Picture: Cross Functional Flowchart for Business Process Mapping
ConceptDraw
DIAGRAM 18