
Example 2. Vertical bar graph - Composition of lunar soil.
"The term lunar soil is often used interchangeably with "lunar regolith" but typically refers to only the finer fraction of regolith, that which is composed of grains one cm in diameter or less. Lunar dust generally connotes even finer materials than lunar soil. There is no official definition of what size fraction constitutes "dust", some place the cutoff at less than 50 micrometres in diameter, others at less than 10. ...
Lunar soil is composed of various types of particles including rock fragments, mono-mineralic fragments, and various kinds of glasses including agglutinate particles and volcanic and impact spherules. The agglutinates form at the lunar surface by micrometeorite impacts that cause small-scale melting which fuses adjacent materials together with tiny specks of metallic iron (Fe0) embedded in each dust particle’s glassy shell.
Over time, material is mixed both vertically and horizontally (a process known as "gardening") by impact processes. However, the contribution of material from great distances is relatively minor, such that the soil composition at any given location largely reflects the local bedrock composition.
There are two profound differences in the chemistry of lunar regolith and soil from terrestrial materials. The first is that the Moon is very dry. As a result, those minerals with water as part of their structure such as clay, mica, and amphiboles are totally absent from the Moon. The second difference is that lunar regolith and crust are chemically reduced, rather than being significantly oxidized like the Earth's crust. In the case of the regolith, this is due in part to the constant bombardment of the lunar surface with hydrogen (H) from the solar wind. One consequence is that iron on the Moon is found in the metallic 0 and +2 oxidation state, whereas on Earth iron is found primarily in the +2 and +3 oxidation state."
[Lunar soil. Wikipedia]
This bar chart was redesigned using the ConceptDraw DIAGRAM from the Wikimedia Commons file: Composition of lunar soil.svg.[commons.wikimedia.org]
See Also:
TEN RELATED HOW TO's:
Waterfall chart shows the changing of the value from one state to another through the series of intermediate changes. The waterfall diagrams are widely used in the business. They are used to represent the set of figures and allow link the individual values to the whole.
Picture: Waterfall Bar Chart
Related Solution:
This sample was created in ConceptDraw DIAGRAM diagramming and vector drawing software using the Business Process Diagram Solution from the Business Processes area of ConceptDraw Solution Park. The Business Process Solution is based on the standard BPMN 2.0 and includes the set of libraries of ready-to-use objects.
Picture: BPR Diagram. Business Process Reengineering Example
Related Solution:
The innovative GHS Hazard Pictograms Solution from the Industrial Engineering Area of ConceptDraw Solution Park offers for ConceptDraw DIAGRAM users the whole collection of predesigned GHS label pictograms with GHS labels meanings. Their use helps to overcome easily all the difficulties that can arise while creating professional-looking chemical safety diagrams and infographics.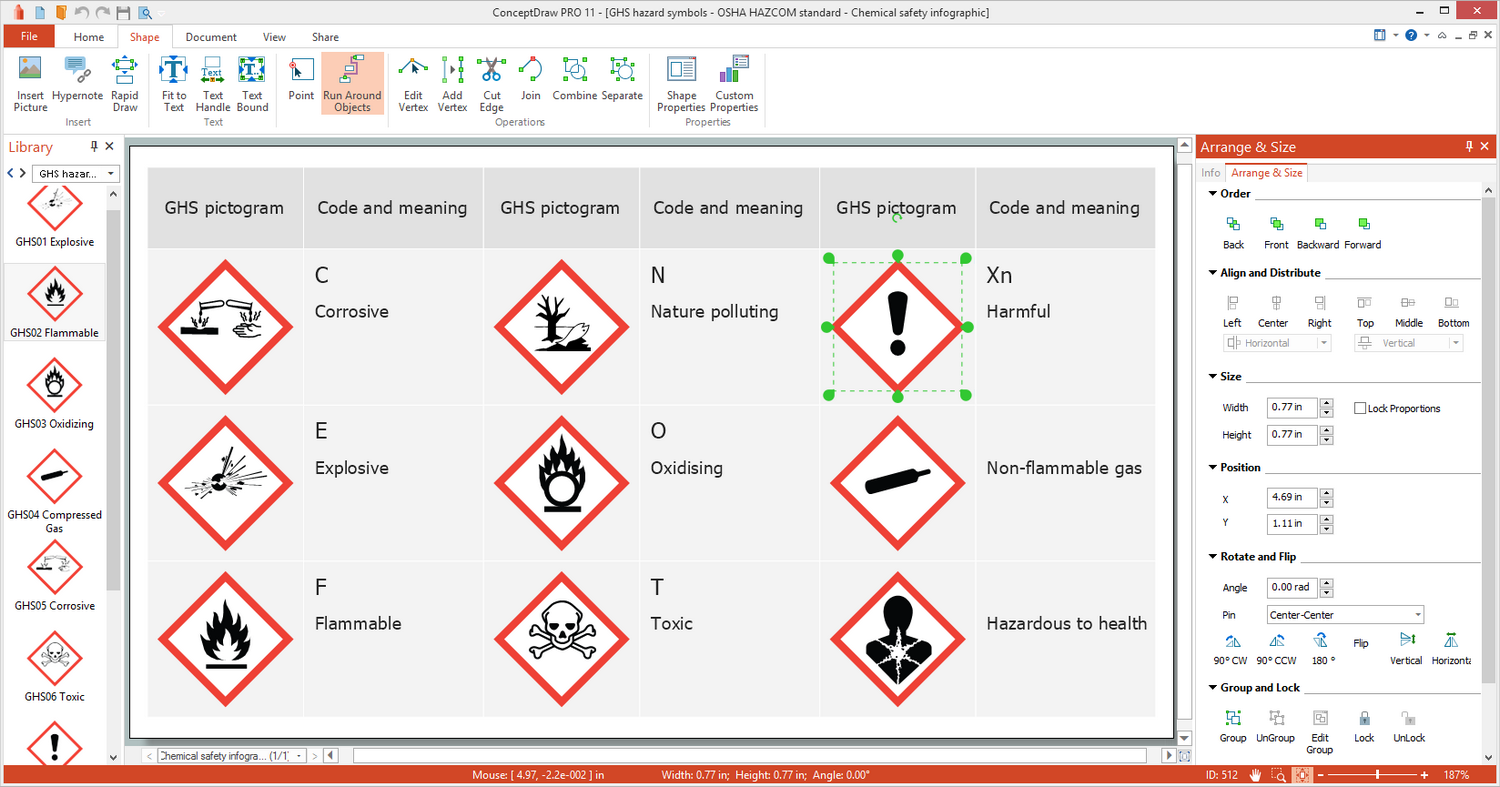
Picture: GHS Labels Meanings
Related Solution:
Network community structure is a network which nodes can be easily grouped into the sets of nodes with dense internally connections.
This example shows a network that displays the community structure with three groups of nodes with dense internal connections and sparser connections between the groups.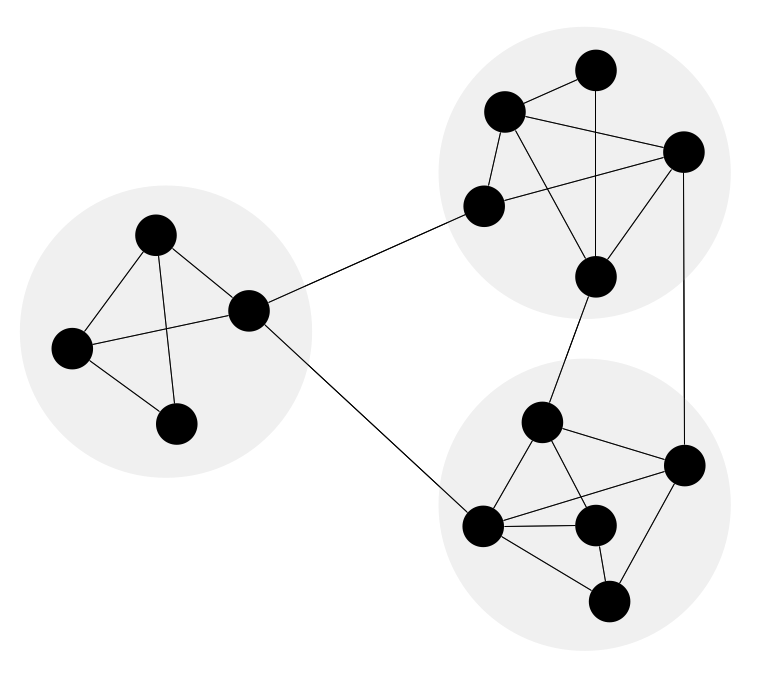
Picture: Network Community Structure. Computer and Network Examples
Related Solution:
ConceptDraw DIAGRAM is a professional software for creating great looking flowcharts. The samples included in this set of software allows users to draw any type of flowchart.
Picture: Flowchart Process Example
Related Solution:
The Value Stream Mapping solution continues to extend the range of ConceptDraw DIAGRAM into a business graphics tool that can be used to document processes of Lean Manufacturing.
Picture: Lean Manufacturing Diagrams
Related Solution:
Sometimes it’s quite useful to look on a problem from another view. To gain insight into an obstacle you should use SWOT analysis, and this will help you to see the whole situation. When composing a SWOT matrix, you divide your problem onto four elements - strengths, weaknesses, opportunities and threats and place them into matrix.
This sample SWOT analysis matrix of the athletic shoes producing company was designed on the base of template provided by ConceptDraw SWOT and TOWS Matrix Diagrams solution. It delivers number of easy-to-use templates and samples of SWOT and TOWS matrices for ConceptDraw DIAGRAM. Applying one of these templates, enables to quickly find out Strengths, Weaknesses, Opportunities, and Threats. After creating a list managers can consider methods the business can use to amplify strengths and to decrease weaknesses; realize opportunities; and avoid threats.
Picture: SWOT Analysis
Related Solution:
No building project can exist without an electrical circuit map. It’s more convenient to develop electrical drawing with a proper software which would contain vector shapes and electrical symbols. This will help in the future if any problems appear.
This circuit diagram shows the scheme of a location of components and connections of the electrical circuit using a set of standard symbols. It can be use for graphical documentation of an electrical circuit components. There are many of different electric circuit symbols that can be used in a circuit diagram. Knowing how to read circuit diagrams is a useful skill not only for professionals, but for any person who can start creating his own small home electronic projects.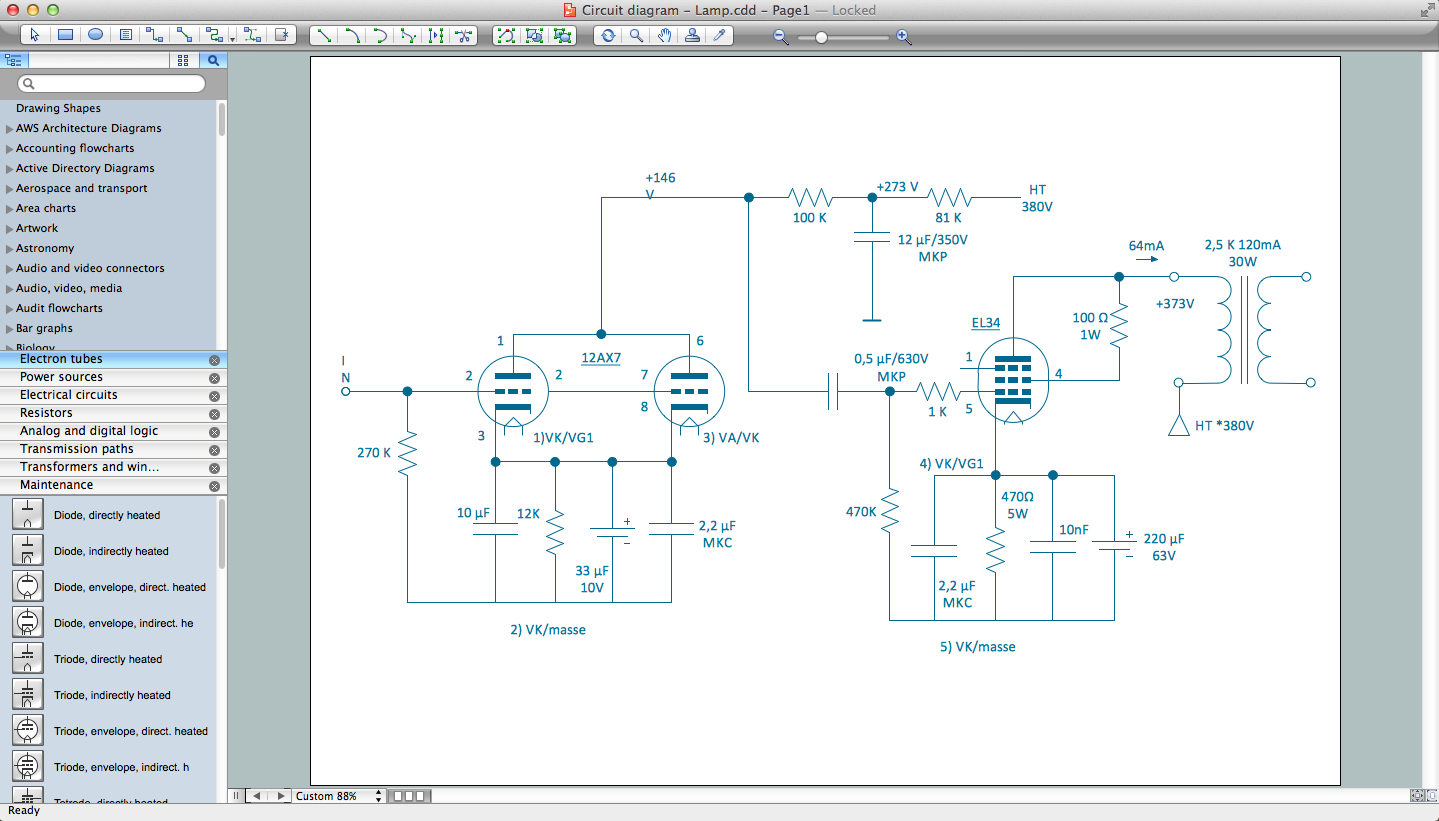
Picture: Electrical Drawing Software and Electrical Symbols
Related Solution:
How to design a Bubble Chart? It’s very easy! All that you need is a powerful software. Never before creation of a Bubble Chart wasn’t so easy as now with tools of Business Diagrams Solution from the Management Area for ConceptDraw Solution Park.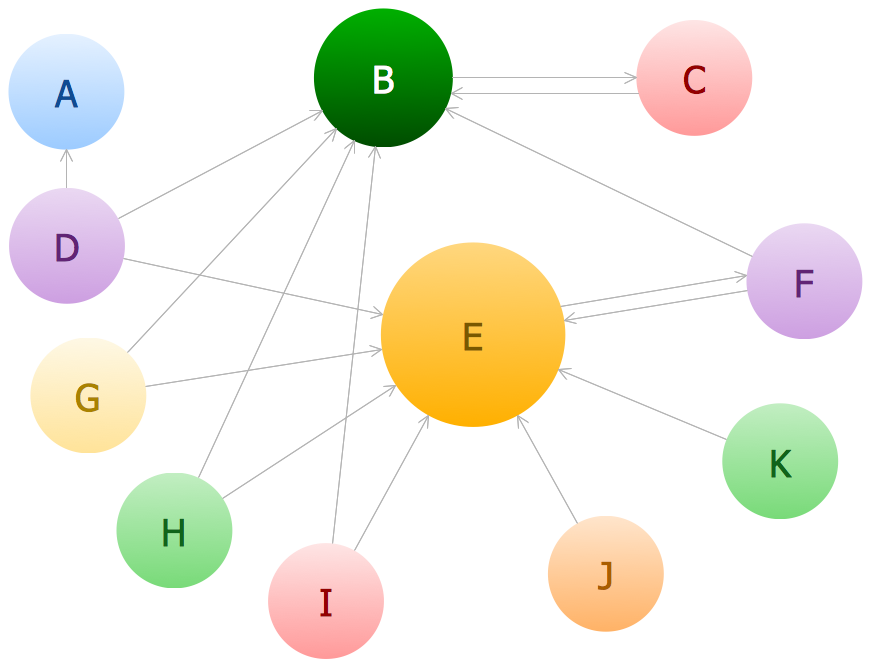
Picture: Bubble Chart
Related Solution:
Different organizations have different organizational structures. Matrix organization is one of the most popular and widely used type of organizational structure. Use ConceptDraw DIAGRAM diagramming and vector drawing software extended with 25 Typical Orgcharts solution from the Management area of ConceptDraw Solution Park for fast and easy designing matrix organizational chart for your company.
Picture: Matrix Organization
Related Solution:

![[commons.wikimedia.org]](commons.wikimedia.org/wiki/File:Composition_of_lunar_soil.svg)