Venn Diagram Template for Word
This template shows the Venn Diagram. It was created in ConceptDraw DIAGRAM charting and vector drawing software using the ready-to-use objects from the Business Diagrams Solution from the Management area of ConceptDraw Solution Park.
Venn Diagrams visualize all possible logical intersections between several sets and are widely used in mathematics, logic, statistics, marketing, sociology, philosophy, etc.

Example 1. Venn Diagram Template
This Venn Diagram shows the logical intersections between 4 sets.
Using the Business Diagrams Solution for ConceptDraw DIAGRAMM you can create your own professional looking Venn Diagrams quick and easy.

Example 2. Venn Diagram Template for Word
This picture shows the Venn Diagram in the MS Word.
TEN RELATED HOW TO's:
ConceptDraw MINDMAP an Alternative to MindJet MindManager - The power, economy, and versatility of ConceptDraw MINDMAP takes personnel and team productivity to another level. Discover today what this means to you.
Picture: Why People Select ConceptDraw MINDMAP
Related Solution:
Each business is created, exists and develops according to its type of business structure. Creating new business or developing existing, you may need a powerful software for representing its business structure. In this case ConceptDraw DIAGRAM diagramming and vector drawing software extended with 25 Typical Orgcharts solution from the Management area is exactly what you need.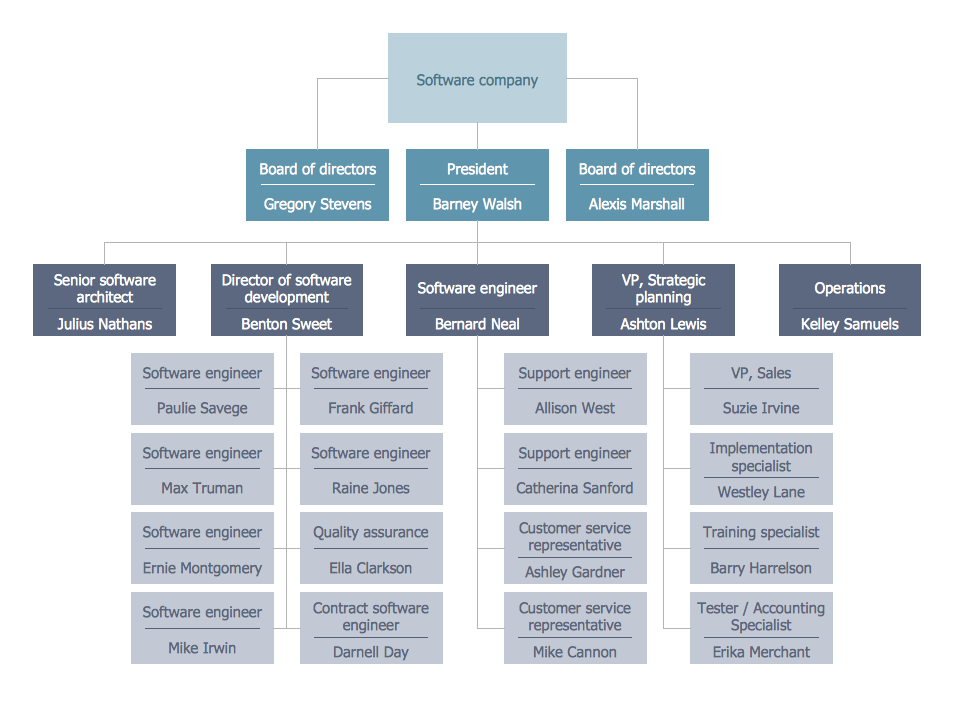
Picture: Business Structure
Related Solution:
Interactive tool helps you find the appropriate response to social media mentions quickly.
Picture: How to Use the ″Online Store PR Campaign″ Sample
Related Solution:
Perfect charts and graphics diagramming software with rich examples and template. ConceptDraw is ideal to draw Charts and Graphics.
Picture: Basic Diagramming
Related Solution:
ConceptDraw DIAGRAM — tool to draw Metro Map style inforgraphics.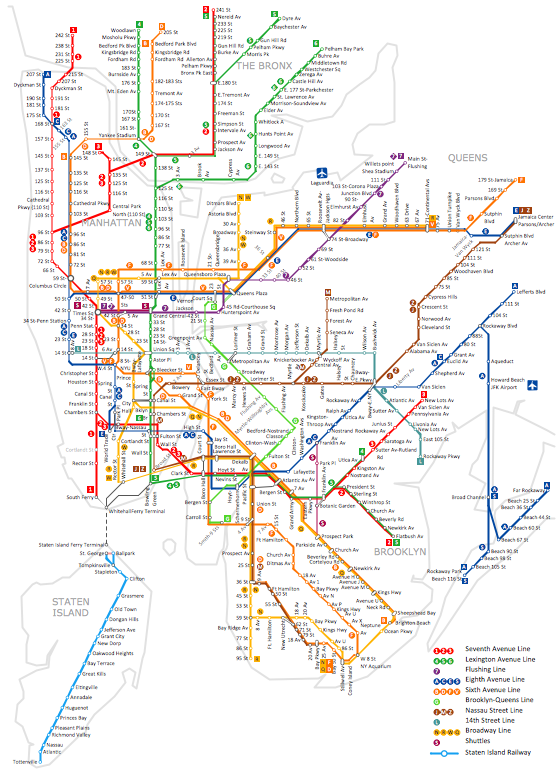
Picture: Infographic software: the Sample of New York City Subway Map
Related Solution:
A pie chart or a circle graph is a circular chart divided into sectors, illustrating numerical proportion. In a pie chart, the arc length of each sector and consequently its central angle and area, is proportional to the quantity it represents.
Pie chart examples and templates created using ConceptDraw DIAGRAM software helps you get closer with pie charts and find pie chart examples suite your needs.
Picture: Pie Chart Examples and Templates
Related Solution:
This sample shows the Flowchart that displays the architecture of SQL Exception Translation.
This sample was created in ConceptDraw DIAGRAM diagramming and vector drawing software using the Flowcharts solution from the Diagrams area of ConceptDraw Solution Park.
Picture: Sample Project Flowchart. Flowchart Examples
Related Solution:
ConceptDraw DIAGRAM is the best flowchart software that suits the following key factors: ease of use, functions, easy-to-use tools, pre-made elements and templates, customization, collaboration, compatibility, support, updates,cost
Picture: Flowchart Software: A Step-by-Step Guide
Related Solution:
Visio for Mac and Windows - ConceptDraw as an alternative to MS Visio. ConceptDraw DIAGRAM delivers full-functioned alternative to MS Visio. ConceptDraw DIAGRAM supports import of Visio files. ConceptDraw DIAGRAM supports flowcharting, swimlane, orgchart, project chart, mind map, decision tree, cause and effect, charts and graphs, and many other diagram types.
Picture: Is ConceptDraw DIAGRAM an Alternative to Microsoft Visio?
Column chart examples from ConceptDraw collection can help you find the best visual depiction for you data. You can easily modify column chart examples according to data you want to visualize.
Picture: Column Chart Examples
Related Solution:
ConceptDraw
DIAGRAM 18