Made with
ConceptDraw
DIAGRAM 17

Concept Maps

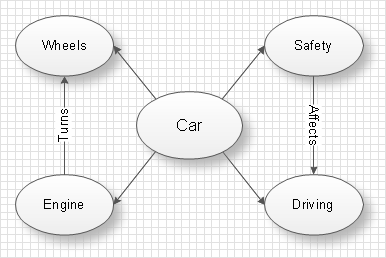
Concept maps are a perfect method of visual presentation of ideas and concepts. This method was created in 60th of the last century by Professor J. Novak from Cornell University.

Concept map is a diagram which visually presents links between some amount of main ideas or concepts. Each concept is presented in the diagram as a named object of arbitrary form. It can be rectangle, oval, circle or any other figure. Links are presented as arrows. These arrows can be lop-sided or two-forked. Also links can have names for clearing the concepts relationship.

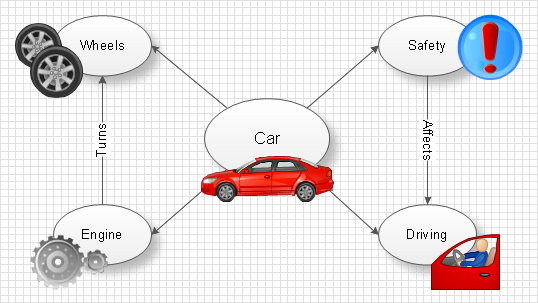
The main idea of the concept maps is that complex structures could be presented graphically and you will be able to see the picture as a whole. Moreover, you can illustrate concepts using pictures to ease the visual perception, that is very important in teaching or if you are using a concept map in presentation.

It is necessary to define the difference of concept maps from «mind maps» more exactly. The concept maps were created first and the «mind maps» was developed as an evolution of this idea. According to the main «mind maps» ideologist T. Buzan, «mind map» is a diagram with one central idea and branches radiating out from it, which detail the central or main idea. A «mind map» focuses on one idea while a concept map examines a set of ideas and their relations. «Mind maps» are limited by one idea and corresponding radial or tree structure. Unlike the «mind maps» concept maps can represent complex concepts, which could require creation of different hierarchies for describable objects and defining of lots of intersecting links. Using concept map you can describe relations between several complex structures, while each of these structures can be described in separate «mind map». For creation of a concept map you can use the corresponding software. For example, ConceptDraw is a professional cross-platform software product for diagrams creating and technical drawing.

ConceptDraw DIAGRAM diagramming and vector drawing software extended with Concept Maps Solution from the "Diagrams" Area is effective tool for creating professional looking Concept Maps.

As concept map consists from conception-blocks and links between them, you can use ConceptDraw library objects and add to a document as much objects as you need.

ConceptDraw tools let you to edit, group, move objects, change their appearance and add text signs and raster or vector pictures.

As links between concepts you can use simple lines as well as «smart» ConceptDraw connectors. The convenience of using of connectors is that when you are moving an object, which presents a concept, the links between it and another objects will be automatically repainted. You can add text signs to the connectors and change their appearance – edit type and direction of arrows, lines type, their thickness and color.

To prevent masses of text signs in complex maps you can use the dialog of object properties, which will show given information about the selected object.

Another useful ConceptDraw ability is the possibility of programming objects for representation only the selected map part. Such objects will show conceptions linked to them only by mouse click. It is very convenient for work with big complex maps hard to examine, which consist of lots of conceptions and links. For example if your map was organized as a tree, you can program every object so representation of its sub-objects will happen only by mouse-click on this object. This property can be used in teaching process or during a presentation for step by step explanation of complex concepts.

Concept Maps *

Example 1. Concept Maps - Internet Marketing

This Concept Map was created in ConceptDraw DIAGRAM using the tools of Concept Maps Solution for ConceptDraw Solution Park and illustrates the principles and components of internet marketing. An experienced user spent 15 minutes creating this sample.

Use the Concept Maps Solution for ConceptDraw DIAGRAM software to create your own professional looking Concept Maps of any complexity quick, easy and effective.

All source documents are vector graphic documents. They are available for reviewing, modifying, or converting to a variety of formats (PDF file, MS PowerPoint, MS Visio, and many other graphic formats) from the ConceptDraw STORE. The Concept Maps Solution is available for all ConceptDraw DIAGRAM or later users.


TEN RELATED HOW TO's:
Mind map of a physical activity sample plan detailing a proposal to incorporate more physical activity into a college community.Physical Activity Plan *
Picture: Physical Activity Plan
Related Solution:
Any business process consists from a number of tasks carrying out the certain business goal. It is useful to diagram business processes to ensure that they are as foolproof, logical and sequential as possible. This business process diagram describes a typical booking process flow by the example of a cab booking process. It can be used as a roadmap for any booking system implementation. Diagramming a business process allows you to look at the entire project and take into account all types of possible scenarios. Business process diagram helps you investigate and clarify the process thoroughly so that you can find out how it can be improved. Business process diagram supports team communications by ensuring that each process element is clear and everyone in the team is on the same page. Sometimes your company brings you less profit than you expect it to be, and it’s difficult to reveal the causes. Maybe it’s time to learn new technologies, because business diagram are easily developed by means of special software, so you won’t make any extra effort. In return, you will increase your productivity and get more done in a less time.Business Diagram Software *
Picture: Business Diagram Software
Related Solutions:
Sometimes it's difficult to find a path in work processes or to understand the requirements, especially when you are a newcomer. To get your thoughts straight, create a workflow diagram, and put everything on it. This will not only help you to get into the workflow, but also show it’s weaknesses. This illustration captures the workflow process of payment an invoice for the electricity consumed by certain enterprise. It was drawn in ConceptDraw DIAGRAM using its solution for Workflow Diagrams. Making a workflow charts means that you need to depict consistently all processes engaged to the workflow process. Then, you should connect them with symbols meaning study and analysis. Next, add symbols of decisions. A work flow diagram made precisely and correctly can help to clarify your work flow to any person.Workflow Diagram *
Picture: Workflow Diagram
Related Solution:
ConceptDraw Note Exchange Solution permits users to develop and organize notes and tasks in ConceptDraw MINDMAP. Your work can be accessed later, just with one click, regardless of preferred platform.Detail Specifications Exchanging Mind Maps with Evernote *
Picture: Detail Specifications Exchanging Mind Maps with Evernote
Related Solution:
Systems engineering is an interdisciplinary field of engineering that focuses on how to design and manage complex engineering systems over their life cycles. ConceptDraw DIAGRAM supplied with SysML Solution from the Software Development Area of ConceptDraw Solution Park is a powerful and effective systems engineering software.Systems Engineering *
Picture: Systems Engineering
Related Solution:
ConceptDraw DIAGRAM extended with the Baseball solution provides access to libraries, templates and samples allows creating baseball diagrams and schemas. Fields objects are designed according to real fields dimensions. A set of fields samples includes dimensions. All plays and positions diagrams are available as ready-to-modify samples.Baseball Diagram – Baseball Field – Corner View – Template *
Picture: Baseball Diagram – Baseball Field – Corner View – Template
Related Solution:
Exam Preparation Mind Map *
Picture: Exam Preparation Mind Map
Related Solution:
A list of parameters on which networks differ is very long. A large network with a range up to 50 kilometers is called metropolitan area network (MAN), and this type of network can include several local area networks. Metropolitan networks in their turn connect into global area networks. Here you will see a Metropolitan Area Network (MAN). This is an extensive network which occupies a large territory including a few buildings or even the whole city. The space of the MAN is bigger than LAN, but lower than WAN. MAN comprise a lot of communication equipment and delivers the Internet connection to the LANs in the city area. Computer and Networks solution for ConceptDraw DIAGRAM provides a set of libraries with ready-to-use vector objects to design various kinds of computer networks.Metropolitan area networks (MAN). Computer and Network Examples
Picture: Metropolitan area networks (MAN). Computer and Network Examples
Related Solution:
Charting Software allows you to create diagrams, charts, graphs, flowcharts, and other business graphics. ConceptDraw DIAGRAM include simple shape drawing tools, examples, templates, and symbol libraries.Create Graphs and Charts *
Picture: Create Graphs and Charts
Related Solution:
Video tutorials on ConceptDraw products. Try it today!How to Draw a Bubble Chart *
Picture: How to Draw a Bubble Chart
Related Solution:
ConceptDraw
DIAGRAM 17