Garrett IA Diagrams with ConceptDraw DIAGRAM
|
Garrett IA diagrams are used at development of Internet-resources, in particulars at projecting of interactions of web-resource elements. The diagram of information architecture of the web resource which is constructed correctly with necessary details presents to developers the resource in comprehensible and visual way. Diagram contains the information about the structure and organization of the contents of the resource pages. The main task of such diagram is to give an idea on how the user surfs on the resource pages, performing a concrete task and not to describe the navigation structure as a whole. At the diagram creation it shouldn’t be overloaded with details and with description of each interface element, used at task execution. It is enough to denote resource objects which are used, for example, which pages the user downloads. It is not necessary to denote which buttons he presses to download the next page because the diagram may turn out too overloaded with details, too intricate and difficult for study and analysis. The main concepts of Garrett IA diagram:
The main elements used at creation of Garrett IA diagram
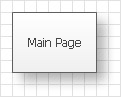
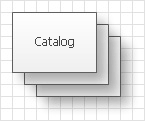
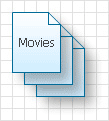
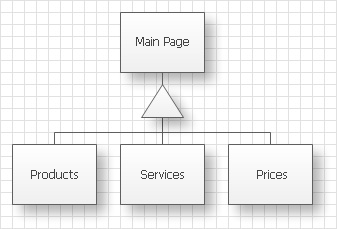
Pay attention that the page on the diagram should correspond to the page displayed on the resource at browsing even if it consists of several HTML files or frames. On the contrary, files are only files which just displayed on the resource as links (downloaded documents, audio or video files, programs and so on) or simply used at the resource work, for instance background music and data base. For indication of the group of pages of similar meaning (E.g. a catalogue of the production types) or the group of files (set of documents for downloading) use elements pagestack and filestack. You can use any convenient for you way of indication of concrete diagram elements- text signs and alphanumeric indications. Connections between elements on the diagram are represented as simple lines. As a rule, the diagram is constructed in the form of a tree as the usual web-resource has the treelike structure (start or main page on which links to other pages are located) however this way of representation is not obligatory. If on the diagram there are represented variants of usage of a resource by a user at the execution of different tasks and in the presence of definite access rights, then you can use different kinds of arrows to show the direction of user’s movement on the resource and elements inaccessible for this user.
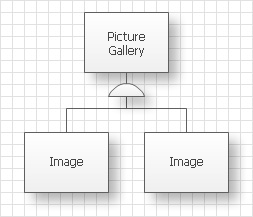
For representation of simultaneous output of several results it is used the arrow with semicircular insertion.
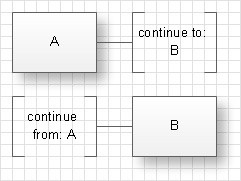
If the structure of the resource is sufficiently complicated or connected elements on the diagram are located far from each other then you can use breaks in connectors so that not to draw the connector through the whole diagram. Breaks and continuations are denoted with square brackets with the denotation of the element to which the connector leads and, correspondingly, from which the connector leads.
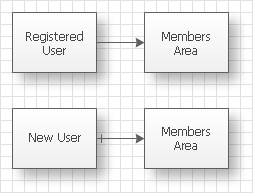
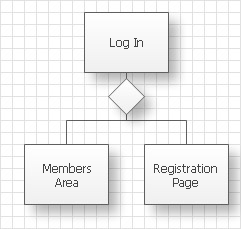
In case of a resource usage by users with different levels of access (registered users, unregistered users, administrators, moderators, etc.) with the help of conventional connectors or arrows on the diagrams there are indicated variants of users work at the execution of definite conditions. Conventional connectors and arrows are represented in dotted lines. It is also possible the usage of the branchy structure with elements of selection of further action at the fulfillment or non fulfillment of the condition.
Thus with the help of Garrett information architecture diagram you can completely and in details describe the structure of web-resource of any complication with necessary detailed elaboration and get the picture of possible work with the resource for users of different access levels. |