Made with
ConceptDraw
DIAGRAM 18

Organizational Structure

Draw Organizational Structure for Your Business

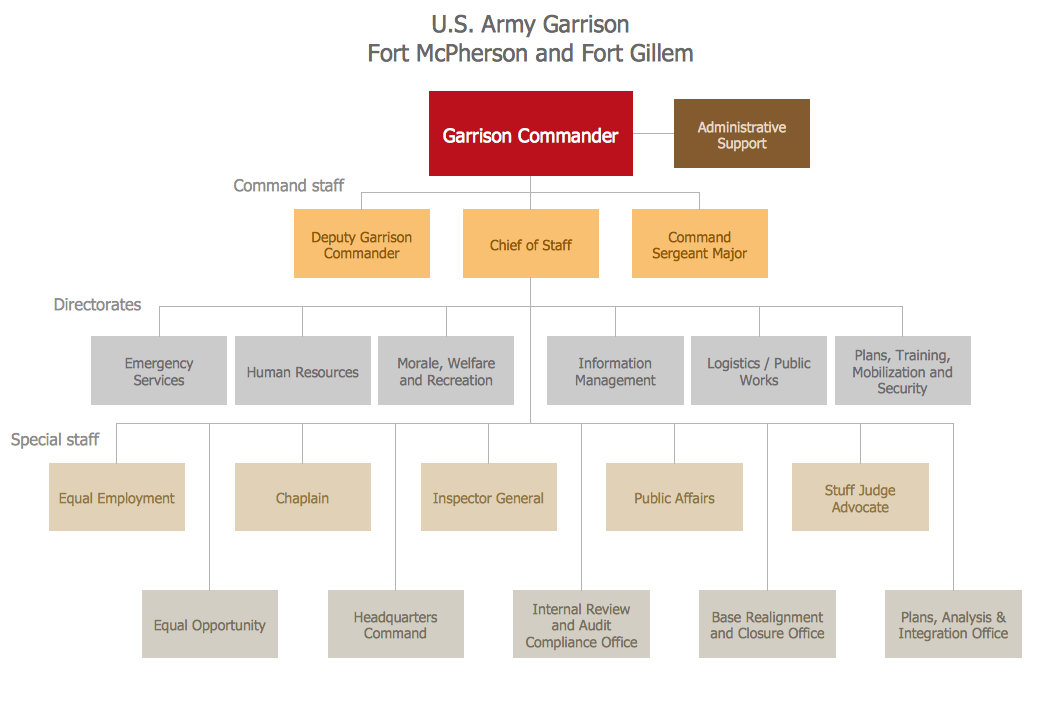
It is not an easy to task to visualize an organizational structure of any company or institution. Sometimes organisational structure could enclose more than thousand persons which work in different departments. Any types of organizational structure can be presented in the form of an organizational chart which creation is supported by ConceptDraw.

There are many methods of structuring an organization, determining how it might operate. Often the organizational structure adapts to the production process depending on the type of production and kind of production. The choice of the method depends on the business objectives, dealing with the fact that in the future it will affect organizational action in many ways. First, the structure provides the foundation for standard working operations. Second, it defines the group of people making key decisions in the company, and the extent to which their point of view affects the activities of the organization.

The most often-observed organizational structure is bureaucratic. This structure is the most standardized with its characteristic features like strictly defined roles and responsibilities and hierarchical structure. Such structure is common among large corporations and enterprises. Bureaucratic companies have well-developed levels of management starting with the top echelons of power ending with the heads of departments, which complicates immediate decision implementations due to the necessity of its adoption at many levels.

To facilitate the workers’ understanding of their responsibilities, and for a clear understanding how to action in all occurring situations, org charts are being created for every department. As the authority of such organizations is at the top, the information is distributed from the top to the bottom of the hierarchical tree. This is the bureaucratic structure main advantage for top managers, since the strategic decision-making process is quite fast. The disadvantage of this system is its inflexibility due to the rigidity of its policies, therefore, making significant changes and innovations almost impossible. Also, these corporations can discourage creativity which makes it difficult for a company to fit if the marketplace conditions change.

Another way to organize a company is to group people by their functions. Functional organization structure divides company onto departments basing on functional areas such as human resources, production or marketing.

Organizational chart is a type of diagram which presents a corporate structure as a tree, where the root is the head of a company, for example the President.

Data Flow Diagram - Order Processing

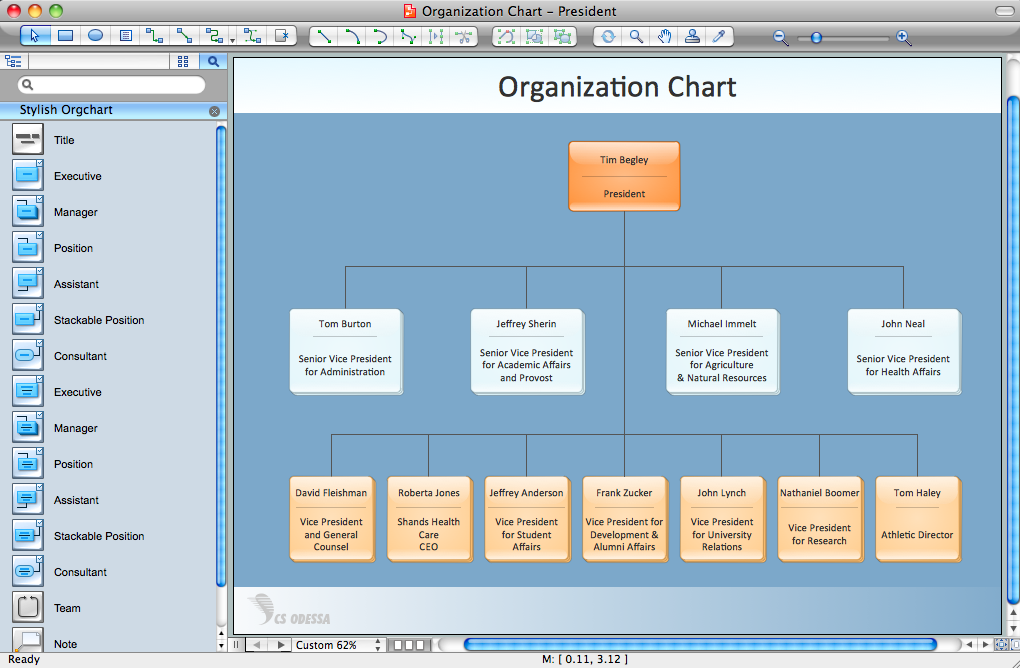
The first level of branches in this tree is a heads of different departments which submit directly to the President.

In such way you can add all workers to the diagram to completely depict the organizational structure of the company.

Moreover, using ConceptDraw you can create the corporate structure diagram from ready “smart” shapes with gradient color to get the clear picture of the hierarchy levels in the company organizational structure.

ConceptDraw has a set of sample organizational charts.

Organizational structure is a method of representing relationships within an organization, a structure of the interrelated groups of an organization. In most cases Organization structure is depicted in a special form Organizational Structure Chart or Org Chart.

Organizational Structure Chart - effective management tool

Organizational structure diagram is designed to represent the current structure of an organization, or show communication and coordination flows. It's recommended to draw an organizational structure diagram to display your vision of your organization.

CSOdessa team is happy to provide a cost effective Organizational structure chart software for company of any size.

Organizational Structure software - Organizational Structure sampleCompany Organizational
Structure Sample

ConceptDraw Organizational Structure Chart Software advantages:
  • Visualize a company structure via Organizational structure chart wizard
  • Automate Organizational structure chart creation. Import data from particularly any source.
  • Company Organizational structure chart with detailed staff information.
  • Specialized Organizational structure chart creation tools.
  • Single and multi-page Organizational structure chart with hyperlinks.
  • Extensive Export/Import possibilities (HTML, PDF, Flash, PowerPoint,etc).
  • Possibility to publish the Organizational structure chart and corporate contact information on the Web, intranet.
Only ConceptDraw Organizational structure chart software gives you all these benefits at such a reasonable price! ConceptDraw DIAGRAM allows you to draw all types of organizational structure of your company:
  • Functional Organizational Structure
  • This type of organizational structure diagram is designed according to functional areas. This type is best to be used for creating some specific, uniform products. The common drawback that can be found in such a kind of organizational structure is difficult communication. You can easily see this if you draw communication flows on the organizational structure diagram.

  • Divisional Organizational Structure
  • This type of organizational structure chart is grouped to reflect workflows in your organization. They can be divided by product lines, regions, etc. This organizational structure is very flexible and efficient but there are also some shortcomings.

Read more about ConceptDraw DIAGRAM - Organizational Structure softwareDownload free trial of - Organizational Structure software - ConceptDraw DIAGRAM

If you have any questions on how to use ConceptDraw for organizational structure diagramming, please email us.

Organizational Structure *


TEN RELATED HOW TO's:
Data Flow Diagram is used to depict the flow of data through the system, where it enters and exits the system, as well as where it is stored. To simplify the process of drawing a data flow diagram (DFD), ConceptDraw DIAGRAM provides a DFD Library - design elements that will help you make your diagram as informative, streamlined and understandable as possible. Data flow diagrams are useful to create a general overview of the system or to document major data flows. Here are the library of symbols used in data flow diagrams (DFD). Data Flow diagrams are graphic means of business process visualization. Any business process may involve the data transfer. It can be easily shown using data flow diagrams. DFDs are used to represent the processing and transformation of data within a business process. One can find out the Vector library of DFD symbols, that is a component of ConceptDraw solution for Data Flow Diagramming and is welcome to use in as addition to the common Conceptdraw DIAGRAM diagramming facilities.DFD Library — Design elements *
Picture: DFD Library — Design elements
Related Solution:
How to draw a Process Flow Chart? It's very fast and easy to draw any Process Flow Chart using the tools of special Process Flow Chart software free. Flowcharts Solution offers wide set of useful drawing tools, collection of samples, ready-to-use template and 2 libraries with predesigned vector elements which will help facilitate drawing process and designing professional looking process flow chart, process flow scheme, process block diagram, etc.Process Flow Chart Software Free *
Picture: Process Flow Chart Software Free
Related Solution:
You need design the Marketing Organization Chart and look for effective software? Now it's incredibly easy to do this in ConceptDraw DIAGRAM which was supplied with Marketing Diagrams Solution from the Marketing Area of ConceptDraw Solution Park.Marketing Organization Chart *
Picture: Marketing Organization Chart
Related Solution:
UML Interaction Overview Diagram schematically shows a control flow with nodes and a sequence of activities that can contain interaction or sequence diagrams.Interaction Overview Diagram *
Picture: Interaction Overview Diagram
ConceptDraw DIAGRAM creates drawings, diagrams and charts with great visual appeal in MacOSPercentage Spider Chart
Picture: Percentage Spider Chart
Related Solution:
The ConceptDraw Flowchart component includes a set of samples and templates. This geathered as flowchart maker toolbox which focused on drawing flowcharts of any industry standards.Flowchart Components
Picture: Flowchart Components
Related Solution:
Using mind mapping for quality management is a creative approach that allows one to structure all key quality points on the one page.Quality Control *
Picture: Quality Control
Related Solution:
Analyze the root causes of factors that influence the problem. A diagram is constructed separately for each high priority factor. Identify the root causes for a factor and then list possible corrective action. The diagram displays the structure of causes for a factor and possible corrective actions. The Root Cause Tree Diagram is used for further formulation of actions.Root Cause Tree Diagram *
Picture: Root Cause Tree Diagram
Related Solution:
Stakeholders are the groups of people or organizations whose contribution matters to the organization's success, this can be labour participation, financial participation, dissemination of information about organization, etc. So, the employees of the company, its suppliers, customers, media, public organizations, state authorities, all they are stakeholders of the company. ConceptDraw DIAGRAM diagramming and vector drawing software extended with Stakeholder Onion Diagrams Solution from the Management Area of ConceptDraw Solution Park is a powerful stakeholder mapping tool which allows easy create Stakeholder Onion diagrams and maps depicting the layers of a project, relationships of stakeholders to a project goal, and relationships between stakeholders.Onion Diagram as Stakeholder Mapping Tool
Picture: Onion Diagram as Stakeholder Mapping Tool
Related Solution:
ConceptDraw MINDMAP the will guide you in creating and demonstrating powerful mind map presentations.Program for Making Presentations *
Picture: Program for Making Presentations
Related Solution:
ConceptDraw
DIAGRAM 18