
Sample 1. Organization chart - University.
ConceptDraw DIAGRAM diagramming software provides vector shapes and connector tools for quick and easy drawing diagrams for business, technology, science and education.
Use ConceptDraw DIAGRAM enhanced with solutions from ConceptDraw Solution Park to create diagrams to present and explain structures, process flows, logical relationships, networks, design schemes and other visually organized information and knowledge.
TEN RELATED HOW TO's:
Bubble Charts are convenient way to visualize ideas and concepts by organizing them in a hierarchy. To show the importance of ideas you can use different bubble sizes and colors. ConceptDraw DIAGRAM diagramming and vector drawing software extended with Business Diagrams Solution from the Management Area affords you the easiest and fastest way for designing professional-looking Bubble Charts.
Picture: Bubble Charts
Related Solution:
The innovative ConceptDraw Arrows10 Technology included in ConceptDraw DIAGRAM Package is a powerful drawing software that changes the way diagrams could be created.
You don't have to guide your connectors, they do this automatically.
Get software for creating business graphics such as charts and graphs, diagrams, organizational charts, multimedia presentations, and visual demonstrations.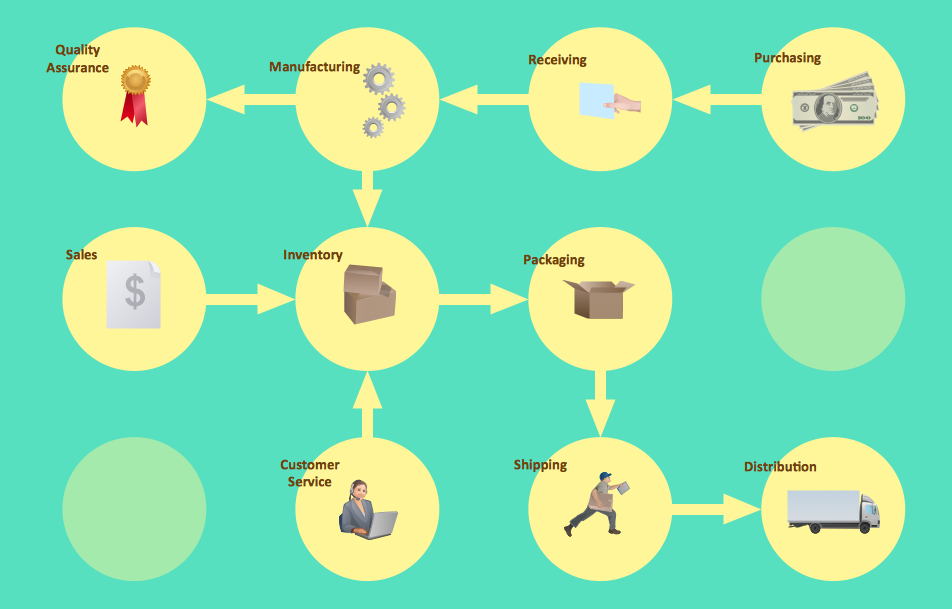
Picture: Business Graphics and Diagramming Package
If neither of 45 vector shapes of the Cross-Functional Flowcharts solution don't fit your needs, you will want to learn How to create a unique Cross-Functional flowchart.
ConceptDraw Arrows10 Technology - This is more than enough versatility to draw any type of diagram with any degree of complexity.
Drawing software lets you to make horizontal and vertical, audit, opportunity and many more flowcharts.
Picture: How to Create a Cross Functional Flow Chart
A flowchart is a powerful tool for examining processes. It helps improving processes a lot, as it becomes much easier to communicate between involved people, to identify potential problems and to optimize workflow. There are flowcharts of different shapes, sizes and types of flowchart vary from quite basic process flowcharts to complex program flowcharts. Nevertheless, all these diagrams use the same set of special symbols like arrows to connect blocks, parallelogram to show data receiving or rectangles for showing process steps.
Basic flowcharts are used to represent a simple process algorithm. A basic flowchart notation consists of rectangles (business processes), arrows (the flow of information, documents, etc.). The same notation is used in items such as the "decision", which allow you to do the branching. To indicate the start of the entire business process and its termination can be used the "Terminator" element. The advantages of Basic Flowchart are simplicity and clarity. With it you can quickly describe the business process steps. Creating of Basic Flowchart does not require any special knowledge, as easily understand by employees with different levels of education and IQ.
Picture: Types of Flowchart: Comprehensive Overview
Related Solution:
This sample was created in ConceptDraw DIAGRAM diagramming and vector drawing software using the UML Class Diagram library of the Rapid UML Solution from the Software Development area of ConceptDraw Solution Park.
This sample shows the transport protocol mappings for SNMP (Simple Network Management Protocol), the classes of the transport system and relationships between them and is used in IP network.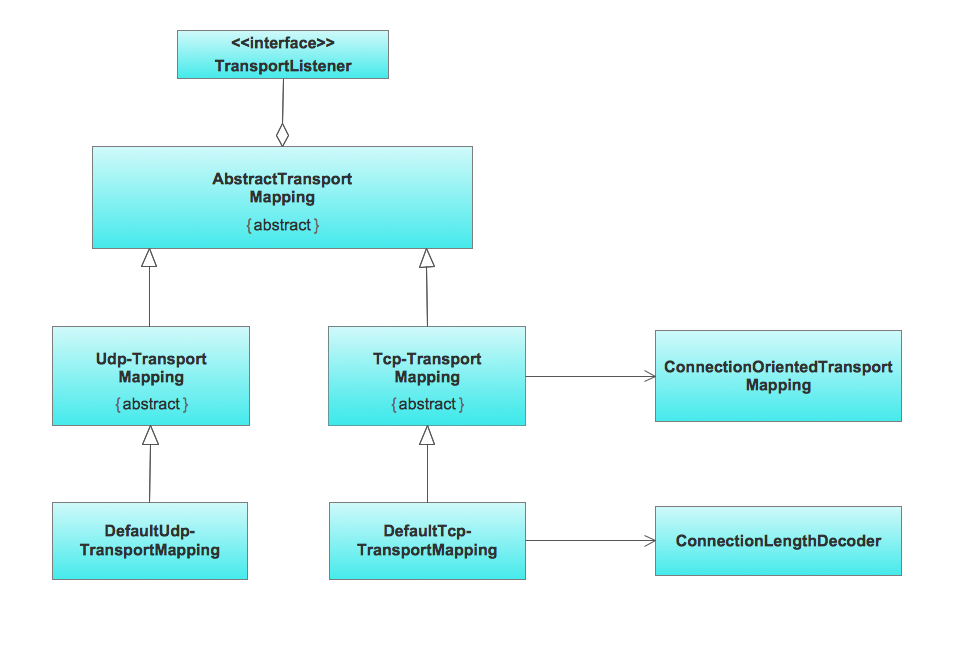
Picture: UML Class Diagram Example for Transport System
Related Solution:
Use the libraries from the Block Diagrams solution to draw block diagrams for your business documents, presentations and websites in a few minutes.
Picture: Block Diagram
Related Solution:
Drawing workflow diagrams combines both creative and analytic practice. To be the most effective in this process you should find a software that suites this kind of practice. Using ConceptDraw DIAGRAM software for drawing workflow diagrams you get support of features, libraries, templates and samples boosts you creativity and keep you focus on analytic practice, not drawing specifics.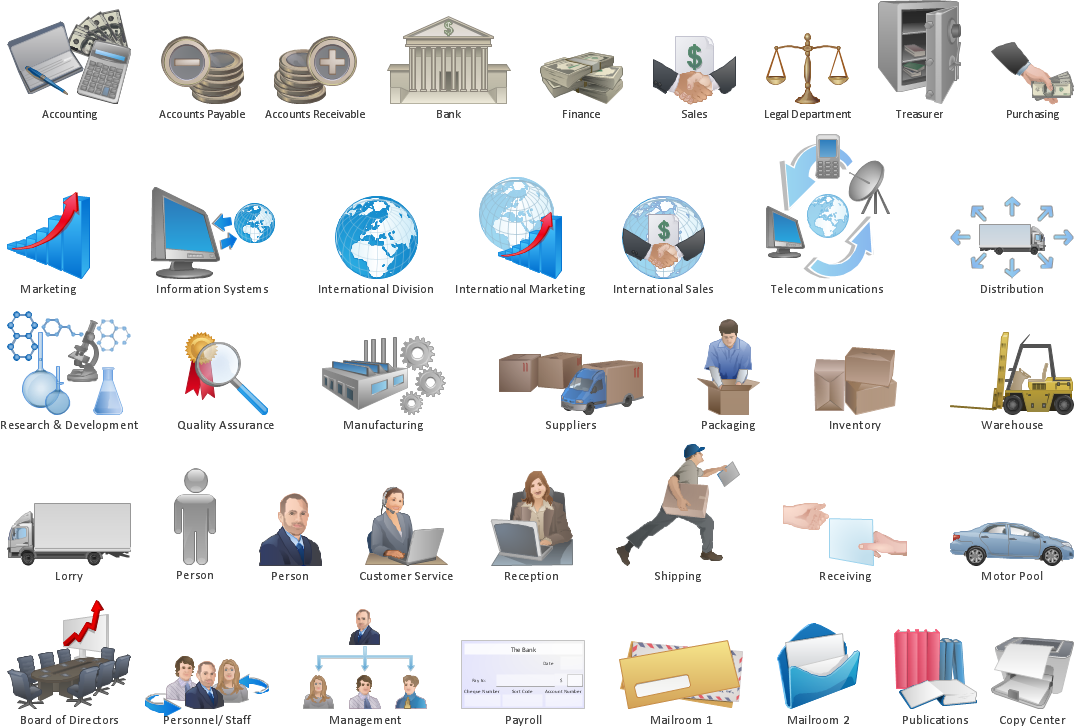
Picture: Drawing Workflow Diagrams
Related Solution:
There are several basic topologies including bus, star, point-to-point, ring and a hybrid. Two computers can form a fully connected network topology, and as the number of network nodes increases, the network diagram gets more complicated. This type of topology is also called a full mesh.
This is a visual example of a computer network built using a mesh topology. This diagram presents the schematic structure of the full mesh network topology. A common mesh network topology means that each network device is connected with several points in the network, so if the one node of the network goes down, it does not cause an issue with an operability of the entire computer network. In a full mesh network topology, every computer or device in the network is interconnected with each of the other devices in the network.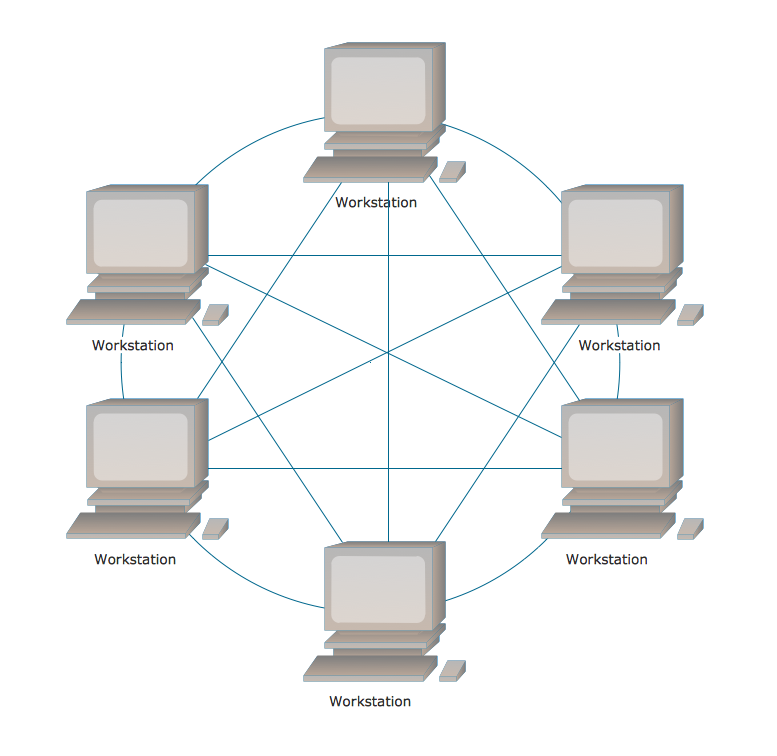
Picture: Fully Connected Network Topology Diagram
Related Solution:
ConceptDraw DIAGRAM is a flowchart design software. There are large collections of professional flowchart symbols for process flow diagrams, standard flowchart symbols and colored basic flowchart symbols. Built-in examples and video lessons allow users to get started immediately and do drawing of virtually any type of flowchart or process flow diagrams
Picture: Flow Chart Creator
Related Solution:
This sample was created in ConceptDraw DIAGRAM diagramming and vector drawing software using the Organizational Charts Solution from the Software Development area of ConceptDraw Solution Park.
This sample shows the organizational chart in the field of Architect Engineering. Create your own orgchart professional drawings using ConceptDraw.
Picture: Business Board Org Chart
Related Solution: