How to Create a Social Media DFD Flowchart
Using the ConceptDraw Social Media Response solution improves quality of content in social media and helps build an active customer community. It allows companies to be more effective in timely messaging thanks to the ability for rapid response to a customer′s post in social media. This saves budget for companies who use social media for promoting and as a lead generation tool.
The Social Media Response solution creates interactive social media flow charts and action mind maps. The solution includes a video tutorial and a number of samples helping social media teams refine and organize their response process. There are materials to help trainers and consultants develop a social media strategy and provide training for social media groups on how to effectively accomplish their daily work.
Steps for creating a Social Media Response flowchart in ConceptDraw Pro.
Video. How to Create a Social Media DFD Flowchart (2 min 10 sec)
You can use a flowchart to detail all variants of response. This chart looks at what to do in case of positive or negative feedback.

Sample 1. Online Store Social Media Response Flowchart
See also Samples:
- Mind Maps
- Flowchart
- Idea Communication
-
Marketing — Social Media
TEN RELATED HOW TO's:When thinking about the process of decision making, it's easy to imagine it as a pyramid. We will look at a three level pyramid model as an example. Operational decisions are first that come to mind, and it's the first level. Tactical and strategic decisions are the second and the third levels. Pyramid (triangle) diagrams are used to show some hierarchical data. Because to the pyramid form of diagram, each diagram slice has a different width. The width of each segment depends on its hierarchical level. The current image illustrates the model of information system types. Most graphically the model can be represented as a three level pyramid. The first level shows a system of transaction processing It is concentrated on operational tasks. The second level is devoted to tactical solutions of the information system management. And at least, the third level addresses strategy and represents the executive information system. This three level pyramid sample is supplied with the ConceptDraw Pyramid Diagrams solution from Marketing area of ConceptDraw Solution Park. Picture: Pyramid DiagramRelated Solutions:Create a Line Chart with ConceptDraw using our tips. Here you can find an explanation of how to create a line chart quickly.
 Picture: How to Create a Line ChartRelated Solution:The Organizational Chart is a diagram that shows the structure of the organization and the relationships of its parts. There are many ways to present the Organizational Chart. One of them is the Horizontal Organizational Chart: the parts of the diagram are arranged from left to right, or from right to left. This sample was created in ConceptDraw DIAGRAM diagramming and vector drawing software using the Organizational Charts Solution from the Management area of ConceptDraw Solution Park.
 Picture: Horizontal OrgchartRelated Solution:A workflow diagram is less general notation than a process flow diagram. Workflow as a term can apply to organizational process which involves people, resources, documents, sort of data, for instance; whereas a process is general collection of steps occuring in any sort of activity. That is why process flow diagram can be used as workflow diagram to describe business process, data flow or department interactions. The fastest way to create a workflow diagram is using pre-designed workflow template. ConceptDraw DIAGRAM with the Workflow Diagrams solution delivers rich set of workflow diagram templates you may start from.
 Picture: How To Create a Workflow DiagramRelated Solution:Job duties in small companies are usually spread randomly among workers, causing lots of problems and misunderstanding. One of the ways to restore order in business processing is to create a cross-functional flowchart with swim lanes that would represent every step in production system. Another advantage of using swim lanes flowchart is that it represents not only processes, but people responsible for them. Swim lane diagram is a kind of a process flow diagram. Its special feature is that it joins the features of process flow diagrams with organizational charts. Thus, a swim lane diagram display a participant of the business process in a conjunction with general flow of the business system. A swim lane diagram is looks similar to a swimming pool's lanes. Lanes can be horizontal and vertical. The lanes are pointed out relatively to resource name, which is assigned on implementation of the given part of the business process. ConceptDraw Business Process Mapping solution delivers the ability to design develop swim lanes flowcharts using the vector graphic objects of Swim Lanes library.
 Picture: Swim Lane DiagramsRelated Solution:A model of a system is defined as a set of hierarchical diagrams representing the asynchronous process of data transformation from the moment it is input to the system to the moment it is output to the user. To demonstrate how a process transforms the initial data, you should design a data flow diagram using a DFD Library included in ConceptDraw DIAGRAM Solution Park. Start your diagramming experience now! You can use this library of symbols related to data flow diagrams (DFD) to design data-oriented or process-oriented models along with data process diagrams. This vector objects library It is a part of ConceptDraw solution designed for data flow diagramming, along with corresponding samples and templates. A data flow diagram is a 2D flowchart that depicts the sequence of particular activities and operations operations and activities which is accompanied by the dynamic flow of some data.
 Picture: Design Data Flow. DFD LibraryRelated Solution:Data Flow Diagram is used to depict the flow of data through the system, where it enters and exits the system, as well as where it is stored. To simplify the process of drawing a data flow diagram (DFD), ConceptDraw DIAGRAM provides a DFD Library - design elements that will help you make your diagram as informative, streamlined and understandable as possible. Data flow diagrams are useful to create a general overview of the system or to document major data flows. Here are the library of symbols used in data flow diagrams (DFD). Data Flow diagrams are graphic means of business process visualization. Any business process may involve the data transfer. It can be easily shown using data flow diagrams. DFDs are used to represent the processing and transformation of data within a business process. One can find out the Vector library of DFD symbols, that is a component of ConceptDraw solution for Data Flow Diagramming and is welcome to use in as addition to the common Conceptdraw DIAGRAM diagramming facilities.
 Picture: DFD Library — Design elementsRelated Solution:The ability to develop UML diagrams as quickly as the ideas come. The solution uses ConceptDraw RapidDraw techniques. The result is a vector graphic document.
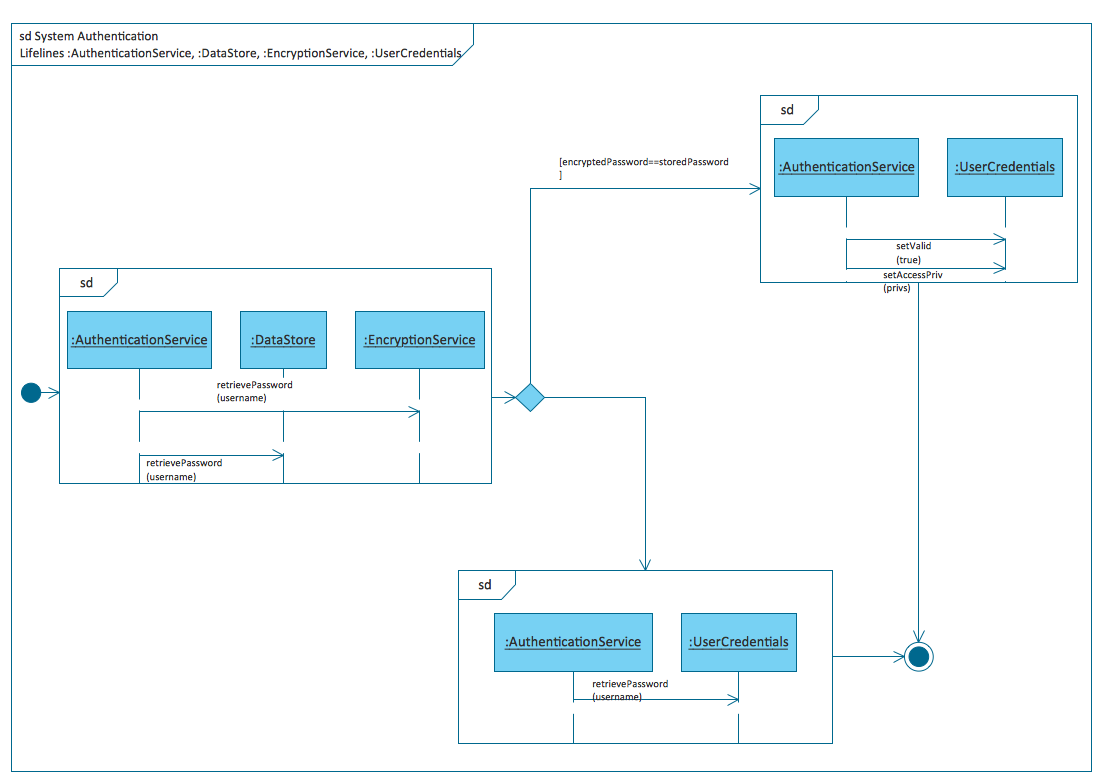 Picture: Introductory Guide to Rapid UML SolutionRelated Solution:Cisco Network Diagrams solution from the Computer and Networks area of ConceptDraw Solution Park provides 14 libraries with 450 ready-to-use predesigned vector objects that can be used for quickly and easily drawing the professional Cisco Network Diagrams.
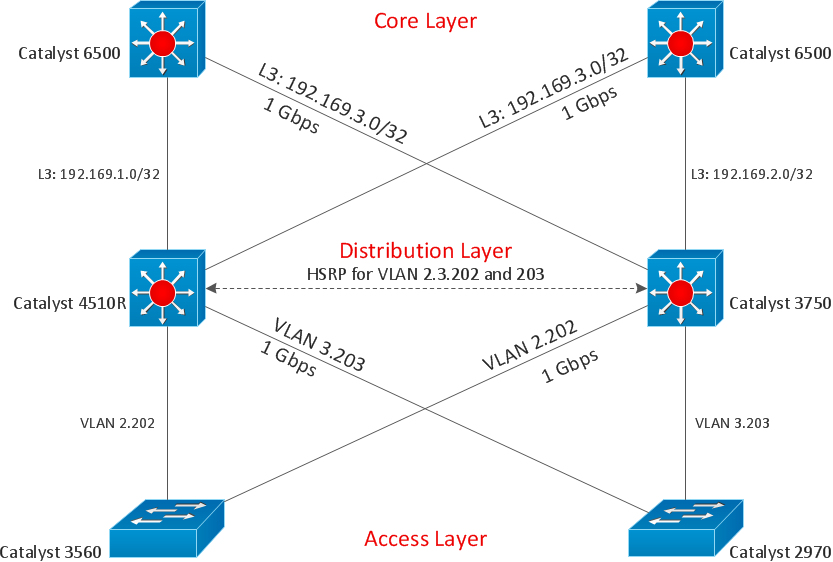 Picture: Cisco DesignRelated Solution:It can be tough to get straight into business papers and processes.Otherwise, you can learn how to create flowcharts for an accounting information system and visualize these documents. Accounting diagrams are clear and easy to understand for all the participants of the process. There are symbols used for creating accounting flowcharts using ConceptDraw DIAGRAM and its Accounting Flowcharts solution. Accounting flow charts are a special kind of flow charts. Actually a variety of flowcharts are often used to facilitate many aspects of a workflow of accounting department. Accounting flowcharts are utilized to support creating accounting documentation, to depict positions responsible for fulfillment of each phase of accounting workflow.
 Picture:How to Create Flowcharts for anAccounting Information SystemRelated Solution:ConceptDrawDIAGRAM 18