Process Flowchart: A Step-by-Step Comprehensive Guide
Process Flowchart (Process Flow Mapping)
Process flowchart or Process flow diagram (PFD) is also known as the System flow diagram or SFD. The main reason for using Process flowchart is to show the relation between major parts of the system. Process Flowchart or PFD does not include minor parts or components of the system like piping ratings or piping systems. In many organizations, users term Process flow diagrams as Flow sheet.
Process flow diagram is a flow model that illustrates and analyzes the overall flow of activities in producing a product or service. Sometimes it is also called: Process diagram, Process flowchart, Process flow map or Process map, Process flow document or Process flow documentation, Process flow model or Process design model, Process flow analysis chart or Process flow analysis map model, Process document or Process documentation.
Primarily, Process flowcharts were used in process engineering and chemical industry where there is a requirement to depict the relationship between major components only. These industries are least concerned about the minor components involved in the system. PFDs for single units or multiple units differ in their structure and implementation. Process flow diagrams for multiple units do not include detailed information and are known as Schematic flow diagrams or Block flow diagrams.
A variety of drawing tools, smart connectors, professional flowchart symbols, and shape libraries is used to create flowcharts of complex processes, procedures, and information exchange. ConceptDraw DIAGRAM software includes all these tools and is a perfect business flowchart tool. It helps you to create professional Process flowcharts, Process flow models, Data flow diagrams, basic Flowcharts, IDEF0 flowcharts, and SDL diagrams.

What's Process Flowchart
Process flow diagram should include information regarding the connection between various systems. It also consists of the process piping and major parts details. Process flow diagrams are usually drawn on a large sheet of paper. Nowadays with the advent of computers and new technology, we tend to use computerized Process flow diagrams. In the old computer era, we used to draw Process flow diagrams with the help of supporting software manually but now we have many process simulators that create Process flow diagrams automatically. We can also use the Computer-Aided Design (CAD) technology or flow chart software to enhance our process flow drawing skills.
Flowcharts are maps or graphical representations of a process. Steps in a flow chart process are shown with symbolic shapes or standard flowchart symbols, and the flow of the process is indicated with arrows connecting the symbols. Computer programmers popularized Flowcharts in the 1960s, using them to map the logic of programs. In quality improvement work, Flowcharts are particularly useful for displaying how a process currently functions or could ideally function. They can help to see whether the steps of a process are logical, uncover problems or miscommunications, define the boundaries of a process, and develop a common base of knowledge about a process. Flowcharting a process often brings to light redundancies, delays, dead ends, and indirect paths that would otherwise remain unnoticed or ignored. But Flowcharts don't work if they aren't accurate, if team members are afraid to describe what actually happens, or if the team is too far removed from the actual workings of the process.
The Services Process Flowchart displays the activities you may need to execute to achieve successful implementation and in-service management of your services program. These activities are intended as guides for consideration as you plan your services program. They are structured for a services program in which the prime services contractor will provide all human resources, ancillary equipment, and all space and facility modifications. Services programs intended to establish new or replace capabilities now provided by FAA-owned and operated equipment with some form of leased services/equipment capability should use the Systems Process Flowchart to the extent applicable to ensure adequate planning for such program elements as logistics support and configuration management. This ensures leased capabilities are supported adequately and can achieve specified availability requirements.
 Basic Flowchart
  Business Process Modeling Notation
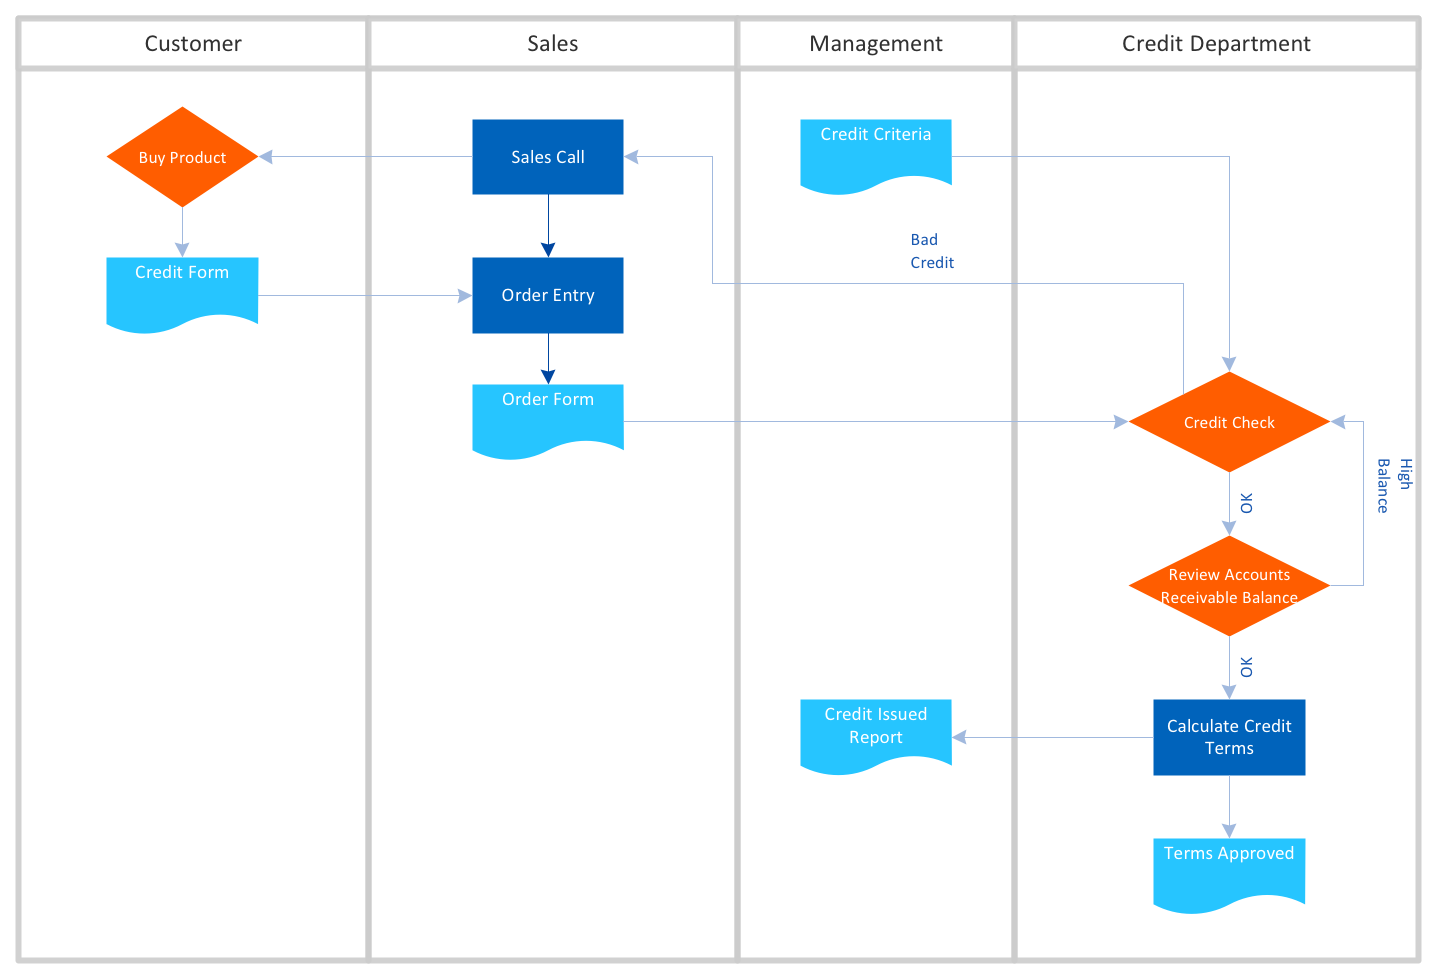
 Cross Functional Horizontal
 Cross Functional Vertical
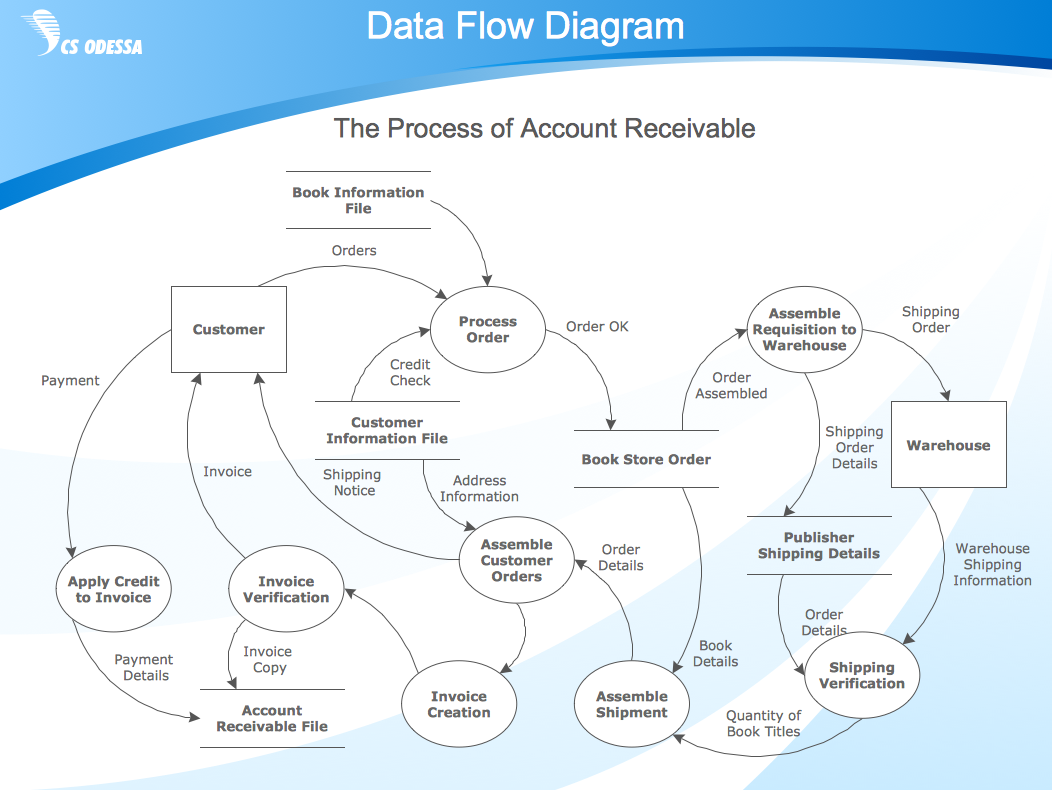 Data Flow Diagram, Process Flow Diagram
 IDEF Diagram
 Hidhlight Flowchart
 List and process, Workflow Diagram
 Work Flow Diagram
The Benefits for Process Flowchart
Process flow charts also referred to as Process mapping or Flow diagrams provide a visual representation of the steps in a process. ConceptDraw DIAGRAM is a perfect process flowchart software with rich flow chart templates and flow chart symbols, which you can use to create professional Flow charts quickly and easily. Constructing a Flow chart is often one of the first activities of a process improvement effort, because of the following benefits:
- Gives everyone a clear understanding of the process
- Helps to identify non-value-added operations
- Facilitates teamwork and communication
- Keeps everyone on the same page
Standard Flowchart Symbols for Drawing Process Flowchart
Flowcharts use special shapes to represent different types of actions or steps in a process. Lines and arrows show the sequence of the steps and the relationships among them. There are many symbols used to construct a Flow chart; the more common symbols are shown below:
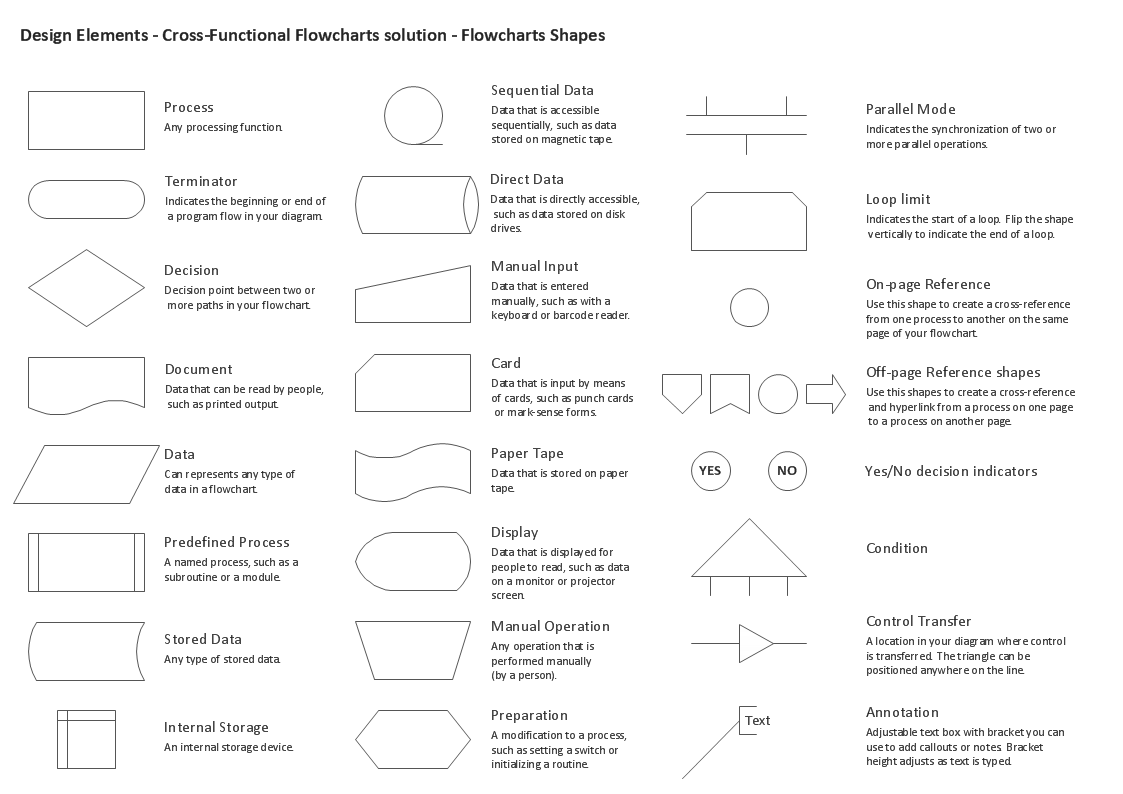
Example 1. Standard Symbols for Process Flow Mapping
Process Flowchart Software
ConceptDraw DIAGRAM is a business process mapping software, which allows you to easier the process of Flowchart creation by providing the following possibilities:
- a variety of drawing tools, smart connectors, and drag-and-drop shape libraries to create Flow charts of complex processes, procedures, and information exchange;
- libraries and templates for Audit flowcharts, Data flow diagrams, Cause & effect diagrams, IDEF0 Flowcharts, SDL Diagrams, Cross-functional flowcharts, and more.

Example 2. Process Flow Graphic Software
Process Flowchart Drawing Guide-lines
There is no one right way to develop a Flowchart, but the following guide-lines provide a general structure to follow, whether it's of the overall course navigational process, or at the hand-off phase to the various team members to develop more detailed treatment.
- Start with a simple one-line description or title of the process being flow charted, e.g., "How to..."
- Using a top-down hierarchy, start with a terminal symbol, naming this trigger event, e.g., "User accesses course database..."
- Connect each successive action step in the logical sequence of events.
- Reference detailed information through annotations or connectors.
- Follow the process through to completion, denoted by a labeled end terminal flowchart symbol, e.g., "exit course."

Example 3. Creating Process Flow Diagram Using Process Flowchart Symbols
How To Create a Process Flow Chart
The ability to create Business process flowcharts is provided by the Business Process Diagrams solution. Open the ConceptDraw STORE, select the Business Process Diagrams solution, and click “Install”.
Business Process Diagrams solution extends ConceptDraw DIAGRAM with 8 libraries that contain 132 symbols from the
- Open a new ConceptDraw DIAGRAM document and select the appropriate BPMN library.
- Add BPMN elements to the diagram by dragging them from the library to the document page.
- Add the next object by clicking on its icon from the RapidDraw arrows that pop up when you bring the mouse cursor over the object.
- Modify objects using their Action button menu. To open the menu select an object and click the action button in the upper right corner of the object.
- RapidDraw technology and the Action button allow you to create Business Process Diagrams quickly.

Example 4. Process Flowchart
Conclusion
A well-developed Functional flowchart created in the design phase can save hours of wasted manpower time by ensuring the structure, sequencing and branching decision points in a computer-based instructional program, support the course goals and objectives before development. Use the professional business process mapping software ConceptDraw DIAGRAM with the Business Process Diagram solution to save your time and effort.
Whether you are the sole creator wearing many hats, or one of many on the development team, sharing a common visual language will guide the project through its many iterations and development phases throughout the instructional design process.
Define and document basic work and data flows, financial, production, and quality management processes in ConceptDraw DIAGRAM to increase the efficiency of your business. Design and make your Flowcharts or a Process flowchart in ConceptDraw DIAGRAM quick and easy.
Other Business Process Flowcharts