Flow Chart Design — How to Design a Good Flowchart
Flowcharting software
ConceptDraw DIAGRAM is a professional flowchart software. Numerous vector stencils, samples and templates created by designers included in the basic bundle allows you to draw any type of flowchart and use flowchart symbols. Vector stencils from object libraries allow you to use RapidDraw technology. By clicking on direction arrows you can add a new flowchart symbol to the flowchart or process flow diagram. This technology gives users the ability to visualize structured data.
Sample 1. Flowchart sample: Selection sorting method
This example of computer algorithm flow chart visualizes the steps and logic of selection sorting method. This is typical process flow diagram of computing an algorithm.
Used flowchart symbols: condition symbols, decision symbols and operator symbols.

Sample 2. Flow Chart Design
Use ConceptDraw DIAGRAM diagramming and business graphics software to design your own flowcharts of computer algorithms.
TEN RELATED HOW TO's:
The Accounting flowchart shows how information flows from source documents through the accounting records. The are based on the accounting procedures or processes.
Flowcharts are used to represent accounting information in a system. There are special symbols which are used to create accounting flowcharts. Try conceptdraw flowcharting set of symbols to draw a professional charts.
Picture: Why Flowchart Important to Accounting Information System?
Related Solution:
ConceptDraw DIAGRAM extended with Organizational Charts Solution from the Management Area is a powerful but easy-to-use Organizational Structure Diagram Software.
Organizational Charts Solution provides a wide variety of templates and samples and large quantity of predesigned vector objects to help you design your Organizational Structure Diagrams and other business diagrams.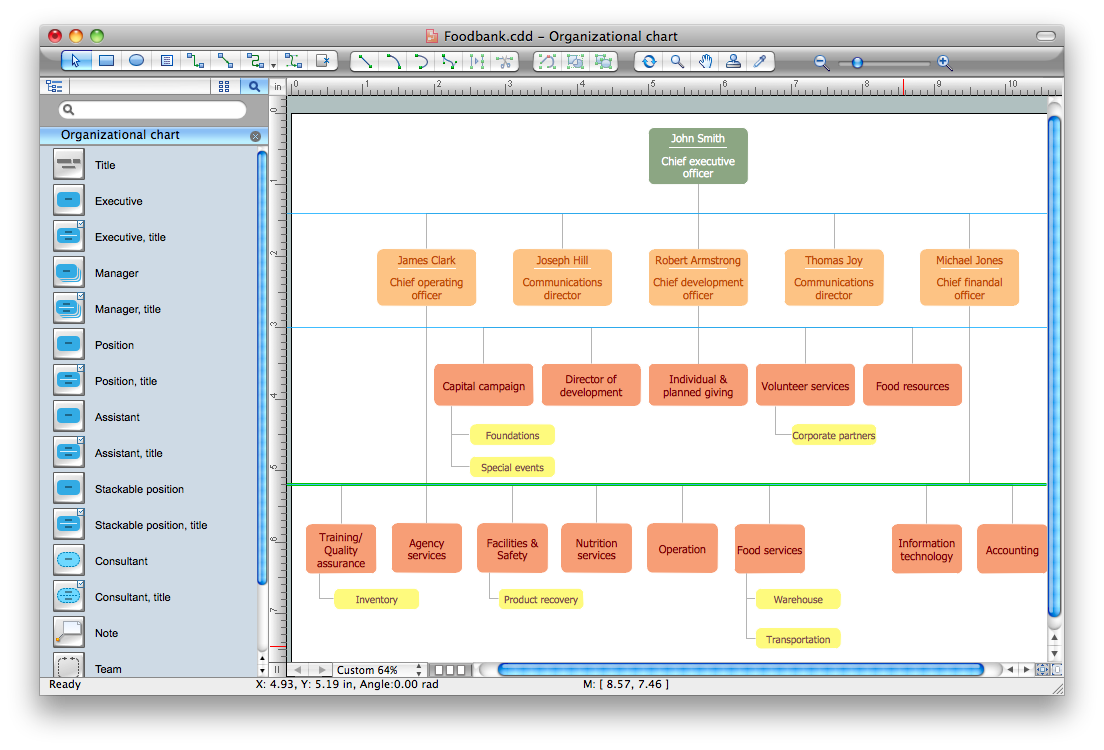
Picture: Organizational Structure Diagram Software
Related Solution:
Is it possible to draw a diagram as quickly as the ideas come to you? The innovative ConceptDraw Arrows10 Technology included in ConceptDraw DIAGRAM is a simple and powerful tool to create any type of diagram.
You mau choose to start from one of plenty diagram templates or to use your own idea.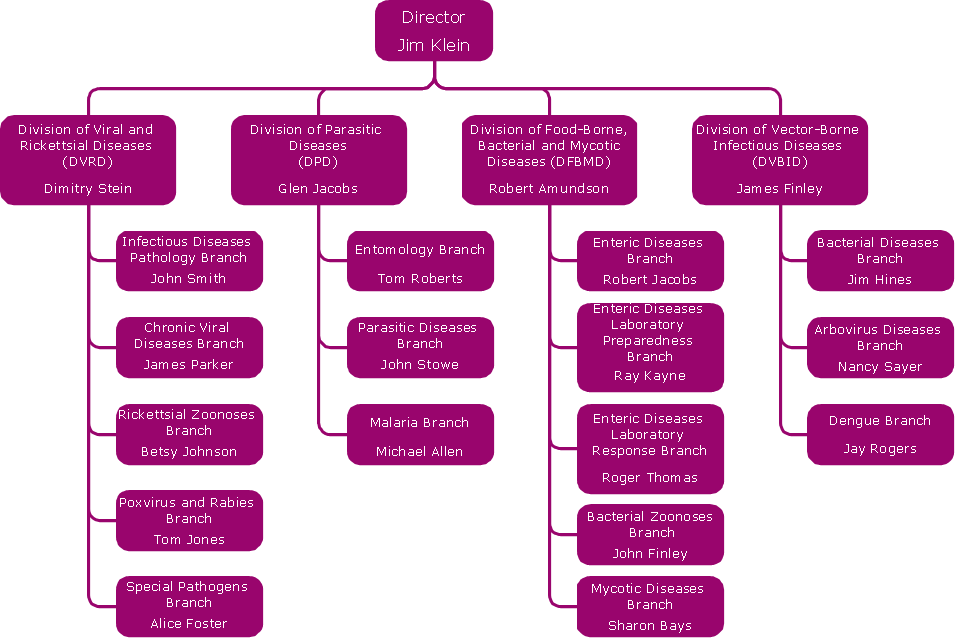
Picture: How To Draw a Diagram
Use the set of special professionally developed swim lane flowchart symbols - single, multiple, vertical and horizontal lanes from the Swimlanes and Swimlanes BPMN 1.2 libraries from the Business Process Diagram solution, the Swim Lanes library from the Business Process Mapping solution as the perfect basis for your Swim Lane Flowcharts of processes, algorithms and procedures.
Picture: Swim Lane Flowchart Symbols
Related Solution:
The Flowcharts are widely used in engineering, architecture, science, analytics, government, politics, business, marketing, manufacturing, administration, etc.
Picture:
Flowchart of Products
Flowchart Examples
Related Solution:
ConceptDraw DIAGRAM diagramming and vector drawing software extended with tools of Flowcharts Solution from the Diagrams Area of ConceptDraw Solution Park ideally suits for fast and easy Online Flow Chart designing. We propose to verify this right now.
Picture: Online Flow Chart
Related Solution:
Acquaintance with flowcharting starts from getting into basic terms. First of all, flowchart definition is quite clear – a flowchart is a graphical representation of a process or an algorithm made of special symbols. Secondly, flowcharting is an irreplaceable tool for IT specialists, project managers, and anyone who wants a clear understanding of any imaginable process.
Picture: Flowchart Definition: A Complete Guide
Related Solution:
Steps in the Accounting Process - The Accounting Process is a sequence of organization activities that is used for gaining quantitative information about the finances. This complex process consists of a set of sequential steps.
9 steps in the accounting process: Analysis of Business Transactions, Make Journal Entries, Post to Ledger Accounts, Prepare Trial Balance, Make Adjusting Entries, Adjusted Trial Balance, Prepare Financial Statements, Close Accounts, Post-Closing Trial Balance.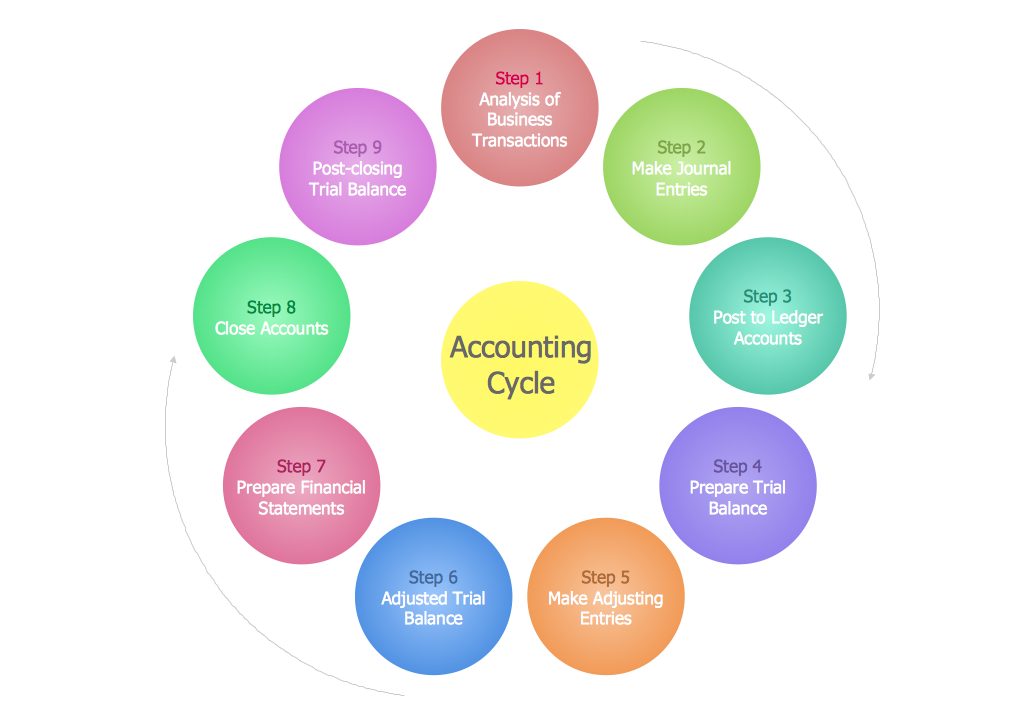
Picture: Steps in the Accounting Process
Related Solution:
Organizing and Selecting Social Media Response Messages.
Interactive Flowcharts can change the way one creates and organizes their social media response process.
Picture: What is Interactive Flowcharts
Related Solution:
Nowadays, any architect or landscape designer can't do without a pack of digital tools for designing and projecting. Thus, there will be no problem to develop any landscape architecture plan with ConceptDraw DIAGRAM , especially since there are so many ready-to use templates and examples included. It's just as easy as drawing sketches on paper.
If you using ConceptDarw DIAGRAM there is no needs to have a professional skills on landscape and garden design. As well as you don't need to be an expert in architectural charts and plans drawing. The all you need is the Landscape and Garden solution. This solution contains a unique collection of the professional designed vector objects depicting flower and grass, bushes and trees, garden furniture, pools and accessories. In one word - the full set of graphical elements enabling to focus on the creativeness while creating your landscape and garden plan.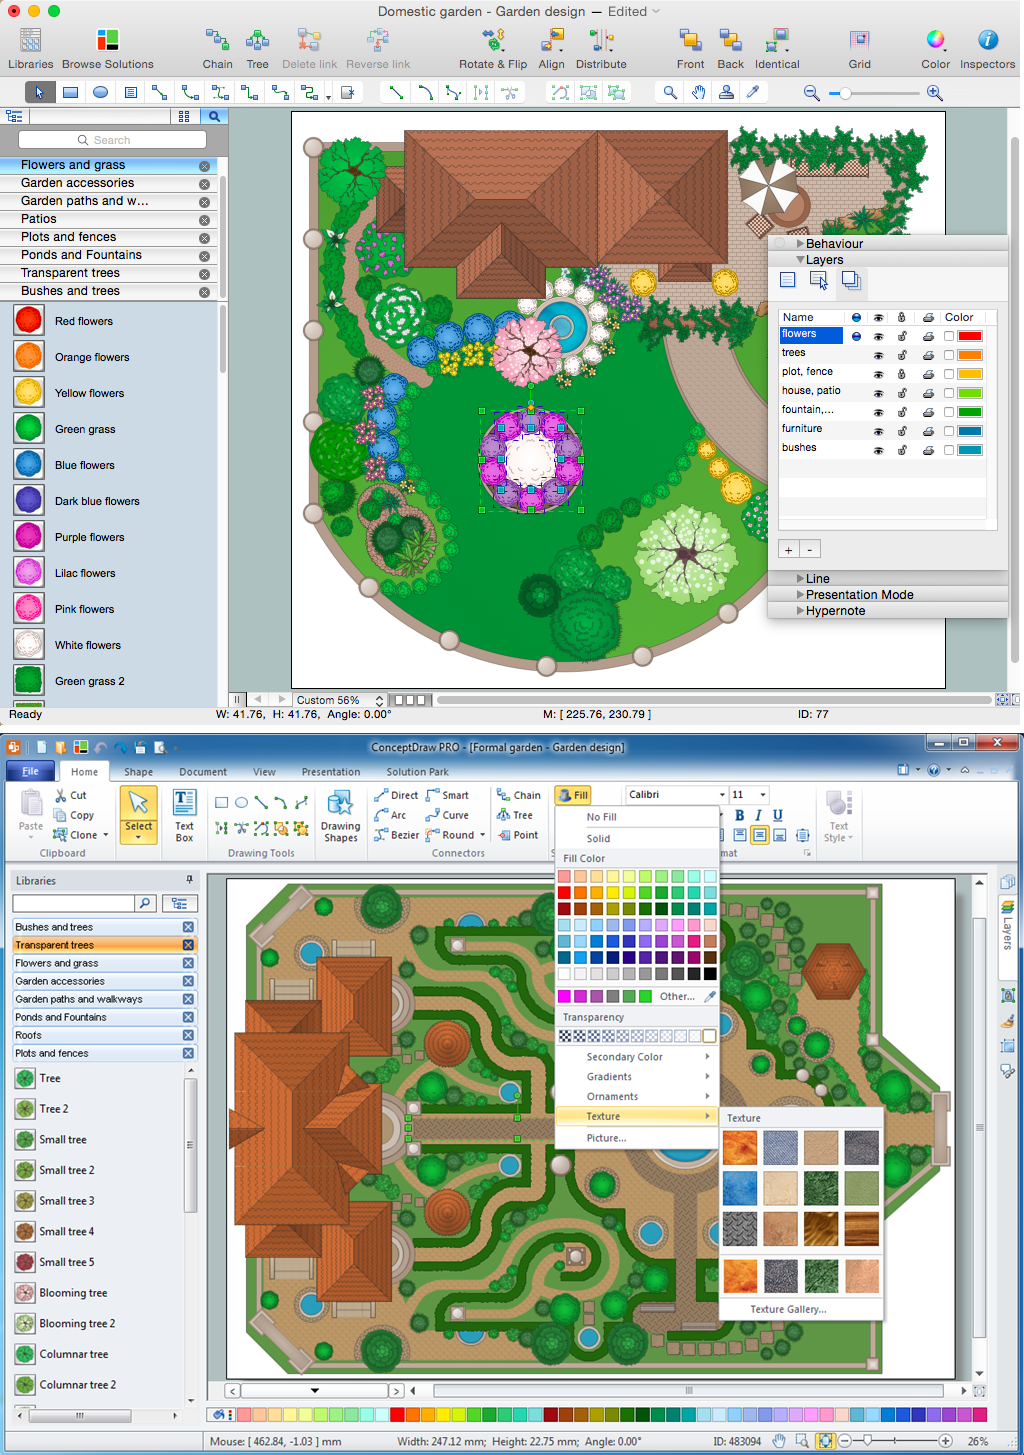
Picture: Landscape Architecture with ConceptDraw DIAGRAM
Related Solution:
