Diagram of a Basic Computer Network. Computer Network Diagram Example
What is a computer network? This is a set of devices and systems that are connected to each other (logically or physically) and communicate with each other. This could include servers, computers, phones, routers, and so on. The size of this network can reach the size of the Internet, and can consist of only two devices connected by a cable.
What do we use computer network for?
1) Applications: using applications, we send different data between devices, open access to shared resources. It can be both console applications and applications with a graphical interface.
2) Network resources: These are network printers, network cameras.
3) Storage: Using a server or a workstation connected to the network, a storage is created that is accessible to others. Many people upload their files, videos, pictures there and share them with other users.
4) Backup: Often, in large companies, they use a central server, where all computers copy important files for backup. This is necessary for subsequent data recovery if the original is deleted or damaged.
5) VoIP: IP telephony, working on IP protocol.
This sample Diagram of a Basic Computer Network was created in ConceptDraw DIAGRAM diagramming and vector drawing software using the Computer and Networks solution from Computer and Networks area of ConceptDraw Solution Park.
Computer and Networks solution provides examples, templates and vector stencils library with symbols of local area network (LAN) and wireless LAN (WLAN) equipment.
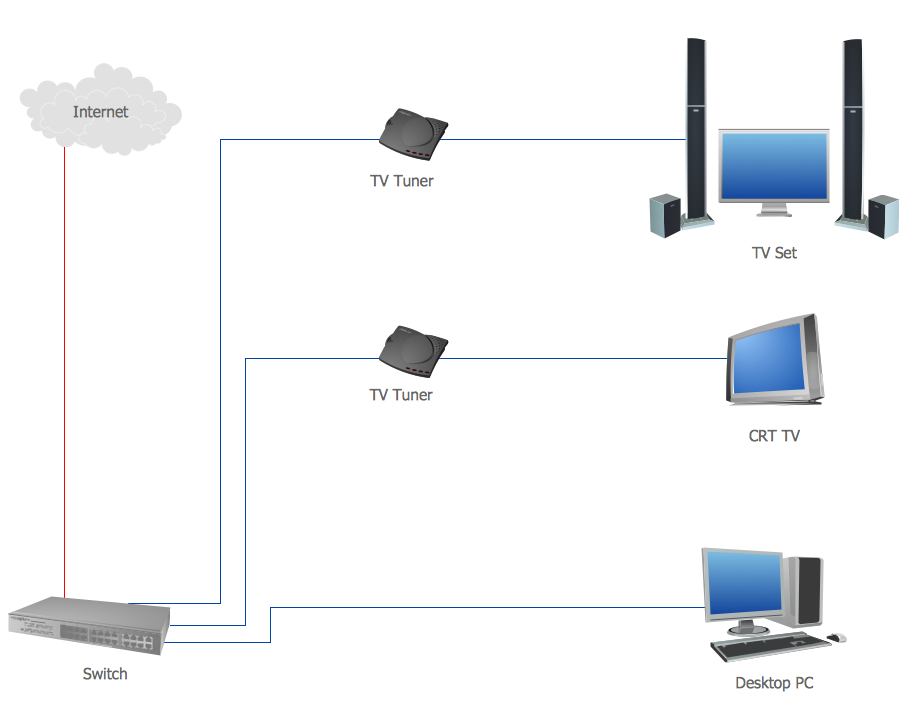
Sample 1. Diagram of a Basic Computer Network
This sample shows the connection scheme of the home WLAN equipment to the Internet.
Using the Computer and Networks Solution for ConceptDraw DIAGRAM you can create your own professional Computer Network Diagrams quick and easy.

Sample 2. Computer Network Diagram Examples
The Computer Network Diagrams produced with ConceptDraw DIAGRAM are vector graphic documents and are available for reviewing, modifying, and converting to a variety of formats (image, HTML, PDF file, MS PowerPoint Presentation, Adobe Flash or MS Visio).
See also Samples:
TEN RELATED HOW TO's:
ConceptDraw DIAGRAM diagramming and vector drawing software extended with Computer Network Diagrams Solution from the Computer and Networks Area offers a set of useful tools, collection of templates, samples, and libraries of various computer symbols, computer devices icons, computer network icon for fast and easy drawing network computer diagrams and illustrations.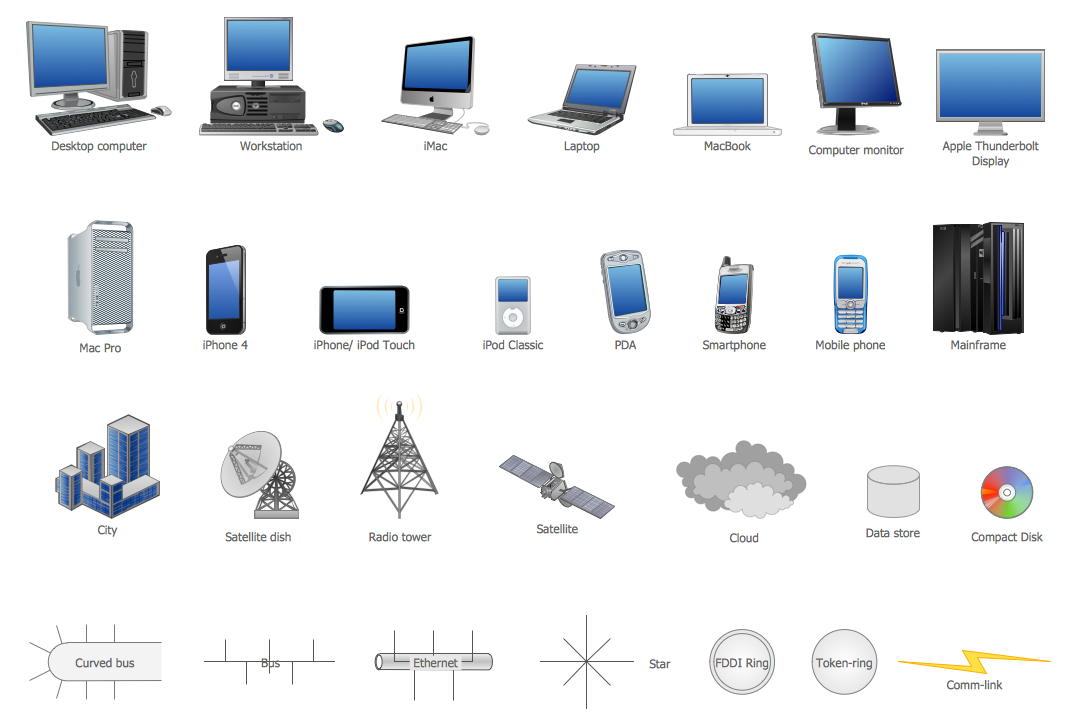
Picture: Network Icon
Related Solution:
If neither of 45 vector shapes of the Cross-Functional Flowcharts solution don't fit your needs, you will want to learn How to create a unique Cross-Functional flowchart.
ConceptDraw Arrows10 Technology - This is more than enough versatility to draw any type of diagram with any degree of complexity.
Drawing software lets you to make horizontal and vertical, audit, opportunity and many more flowcharts.
Picture: How to Create a Cross Functional Flow Chart
Use the ConceptDraw DIAGRAM software that has vector clipart of numerous cable connectors, examples, and templates for drawing different types of audio and video connection diagrams. Paste icon of the receiver or another device to page and layout sockets and plugs. Further connect plugs with each other, and now you have well-designed connection diagram.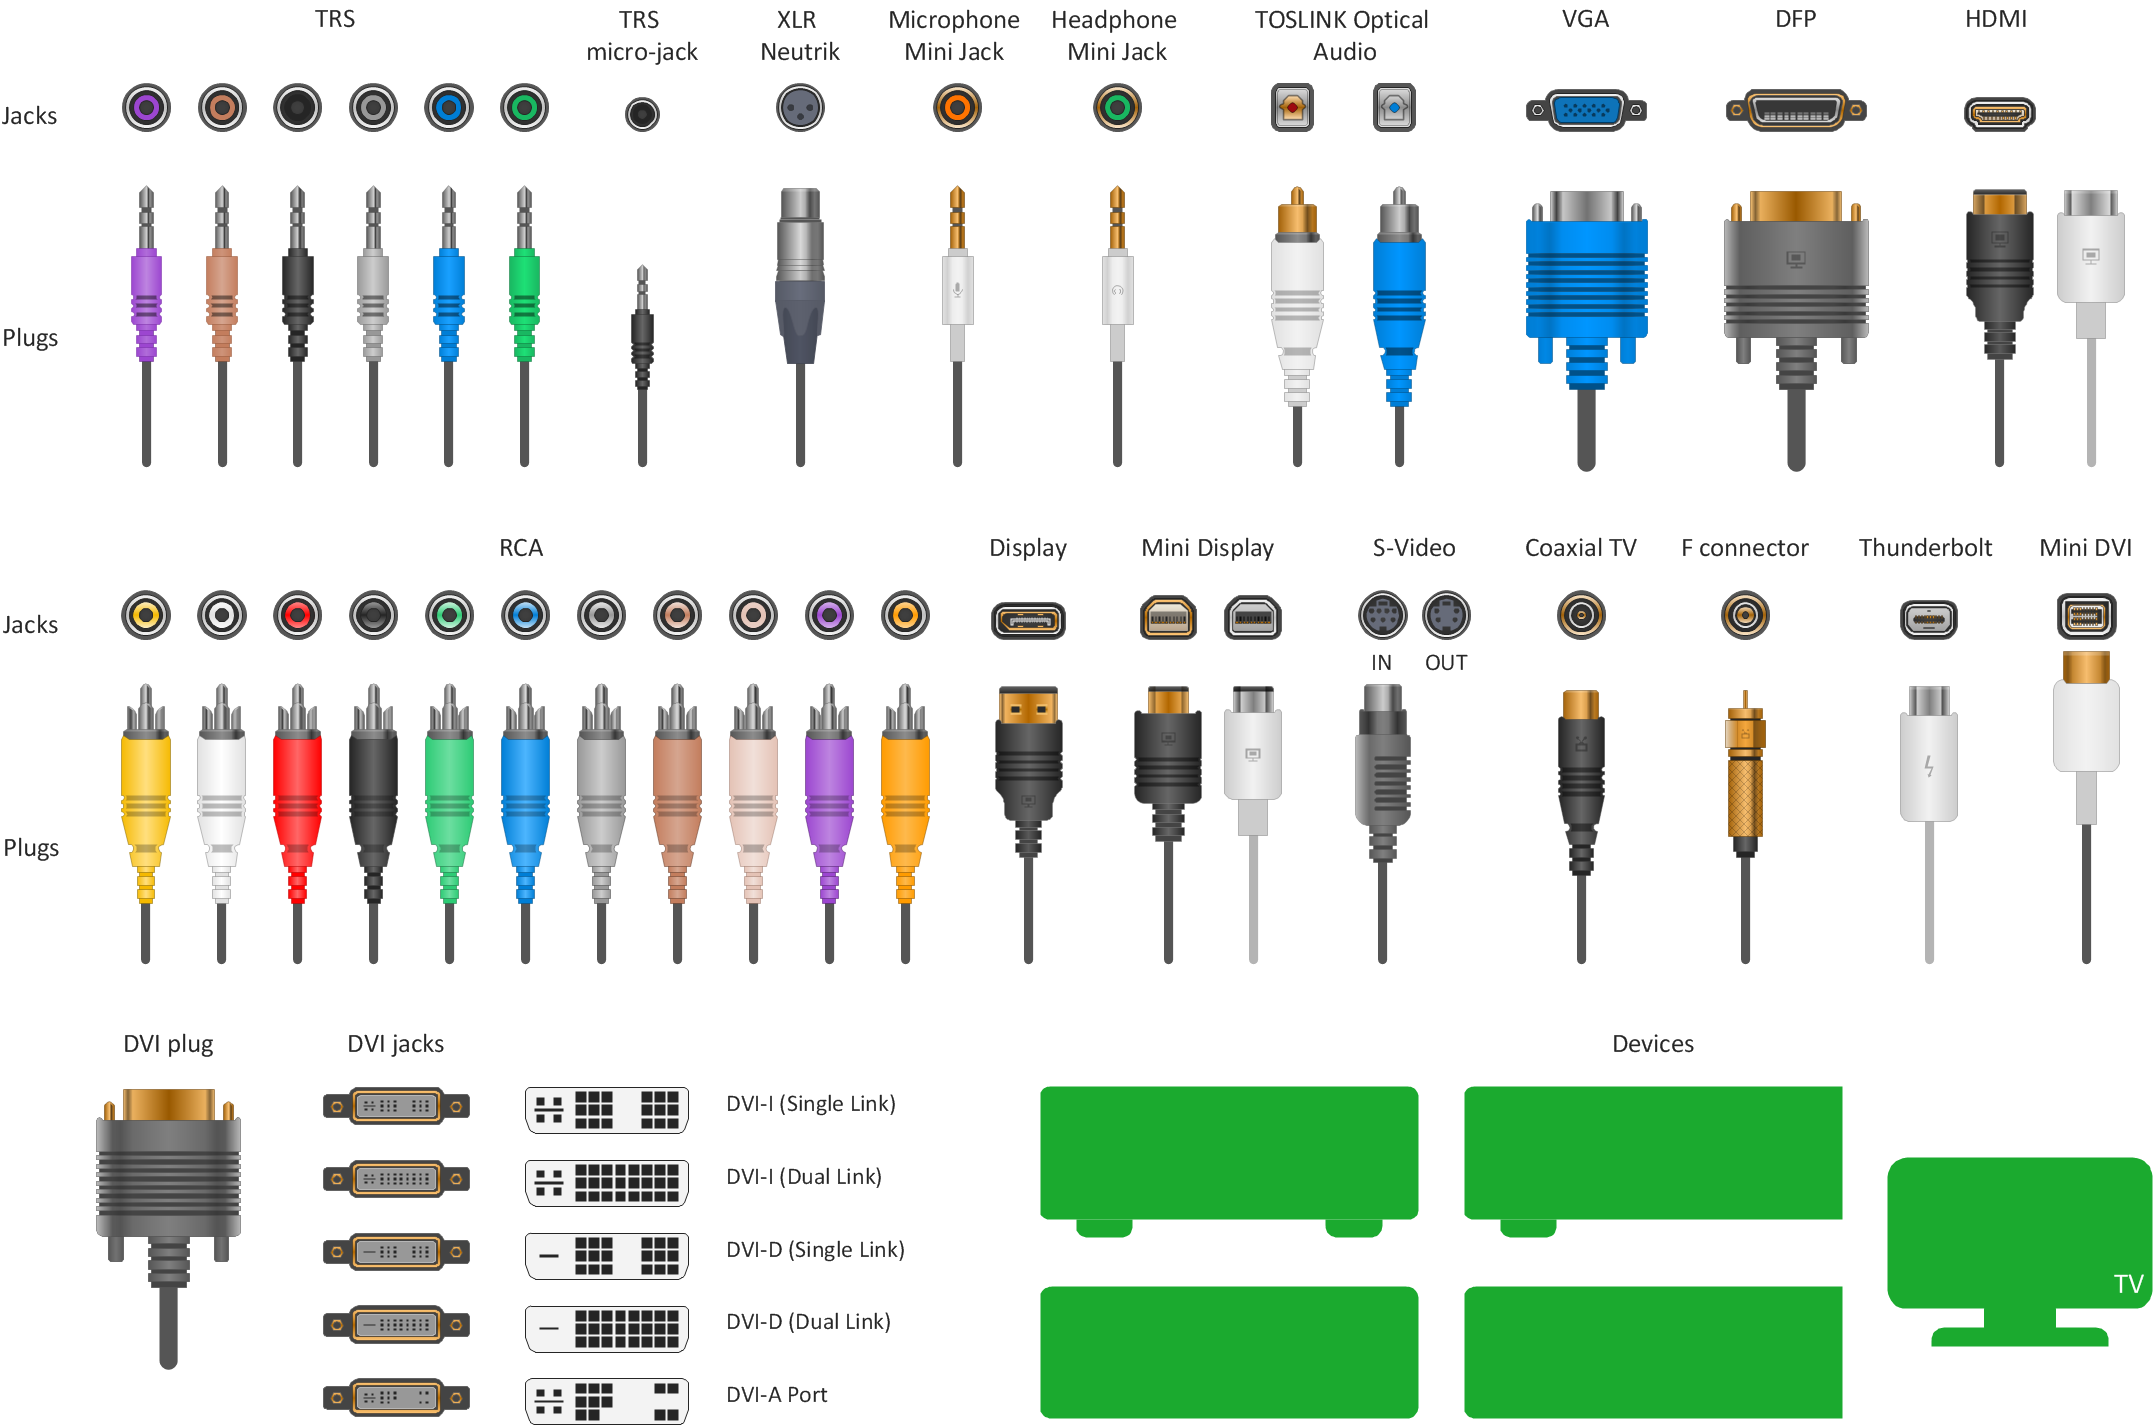
Picture: How to Make Audio and Video Connections
Related Solution:
Use ConceptDraw MINDMAP for creative thinking, planning, organization, problem solving, presentations, decision making, note taking, team brainstorming and other tasks.
Picture: Applications
Definition, examples, layout options, best practices, and common mistakes for cross functional flowcharts (swimlane diagrams).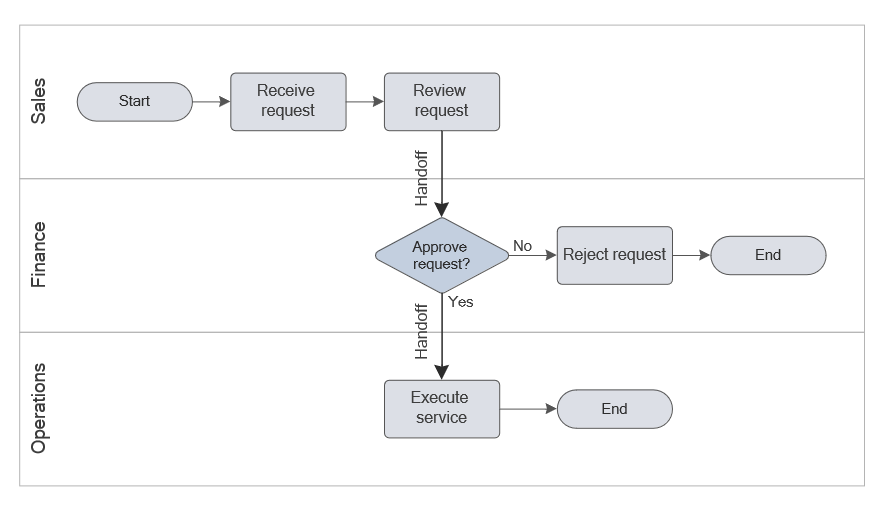
Picture: Cross Functional Flowchart (Swimlane Diagram): Definition, Structure, Examples, and How to Create
Related Solution:
Use ConceptDraw DIAGRAM software for wireless network design to ✔️ develop Wireless network schematics, ✔️ design Wireless network diagrams, ✔️ illustrate wireless networks of various complexity, purposes, and types, ✔️ display the interactions between network devices, ✔️ indicate network technical capabilities, ✔️ detect and eliminate vulnerabilities, ✔️ introduce protective measures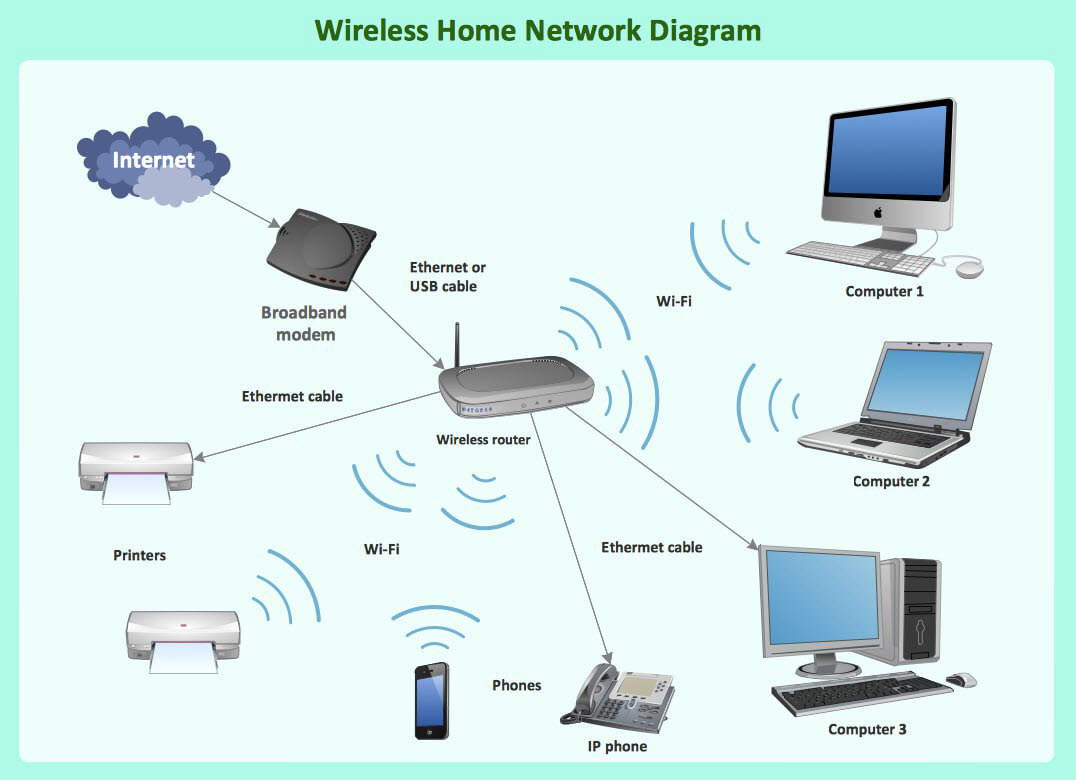
Picture: What Is a Wireless Network? Professional Network Drawing
Related Solution:
Computer and Networks solution provides examples, templates and vector stencils library with symbols of local area network (LAN) and wireless LAN (WLAN) equipment.
This example of computer network topology diagram shows home WLAN equipment and their connection to the Internet.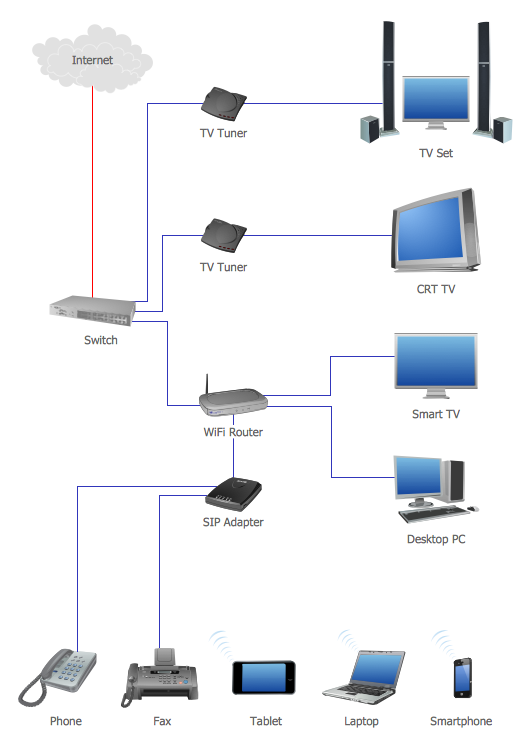
Picture: Network Topology Graphical Examples
Related Solution:
Stakeholder analysis in conflict resolution, project management, and business administration, is the process of identifying the individuals or groups that are likely to affect or be affected by a proposed action, and sorting them according to their impact on the action and the impact the action will have on them.
Use the ConceptDraw DIAGRAM diagramming and vector drawing software enhanced with powerful tools of Stakeholder Onion Diagrams Solution from the Management Area of ConceptDraw Solution Park to easy and effectively visualize stakeholder analysis.
Picture: Visualize Stakeholder Analysis with Onion Diagram
Related Solution:
ConceptDraw DIAGRAM is perfect for software designers and software developers who need to draw Computer&Network Diagrams.
ConceptDraw has 1004 vector stencils in the 40 libraries that helps you to start using software for designing own Network Diagrams. You can use the appropriate stencils from Computer and Network Diagrams library with 56 objects..png)
Picture: Design Element: Computer and Networkfor Network Diagrams
Related Solution:
Data base diagrams describes inter-related data and tables. It describes roles and relationships, internal and external dependencies, data exchange conventions and structures of knowledge domain.
ConceptDraw Software provides number of data-base chart libraries including major 49 vector symbols. Use these DFD flowchart symbol libraries to design data-base structure and models, use it to design data base process-oriented models, or simple data-oriented models. The are special drawing tools for making data flowcharts, data process diagrams, structured analysis diagrams, and information flow diagrams.
Picture: Database Flowchart Symbols
Related Solution: