Wireless Network LAN
Wireless computer network diagrams help system administrators and network engineers to find out amount and type of equipment needed for each office LAN. TheConceptDraw DIAGRAM software helps users to quickly transit from an idea to the implementation of a wireless computer network.
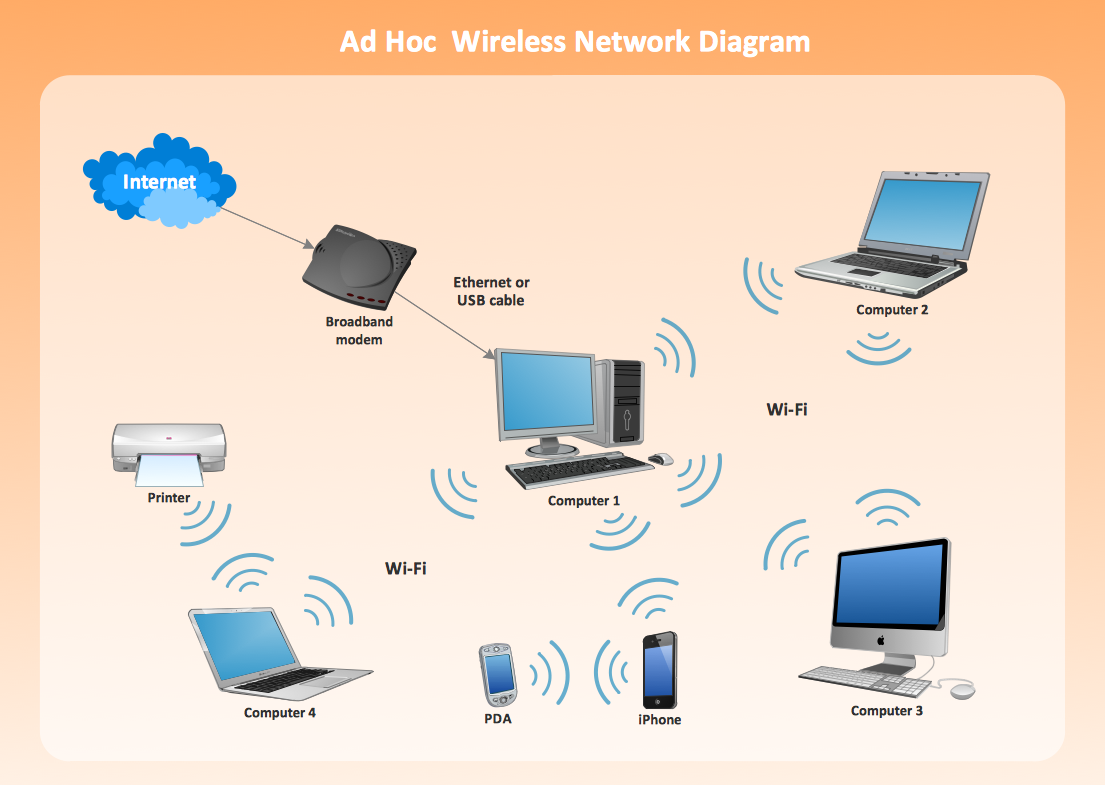
Sample 1. Ad Hoc Wireless Network Diagram.
This example illustrate the topology of wireless local area network (WLAN).
See also Video:
How to Draw a Computer NetworkTEN RELATED HOW TO's:
Even if you design a network for yourself, you still might need a network diagram software to do it in a convenient way. Your laptop, or PC, a smartphone and a router form a home area network, which might be very small, but has to fulfill all your requirements. A schematic diagram will help you to arrange all the cables and network devices in a proper way.
This wireless network diagram is made to describe the home-area network system. This diagram shows the typical wireless network organization in a private house or condominium. It consists from computers and gadgets that use wireless connections. The diagram is created using the ConceptDraw Computer Networks Diagrams solution. It is a rather common diagram that features icons depicting Wi-Fi point, router, media gadgets and periphery with connections and routes that show the flow of data.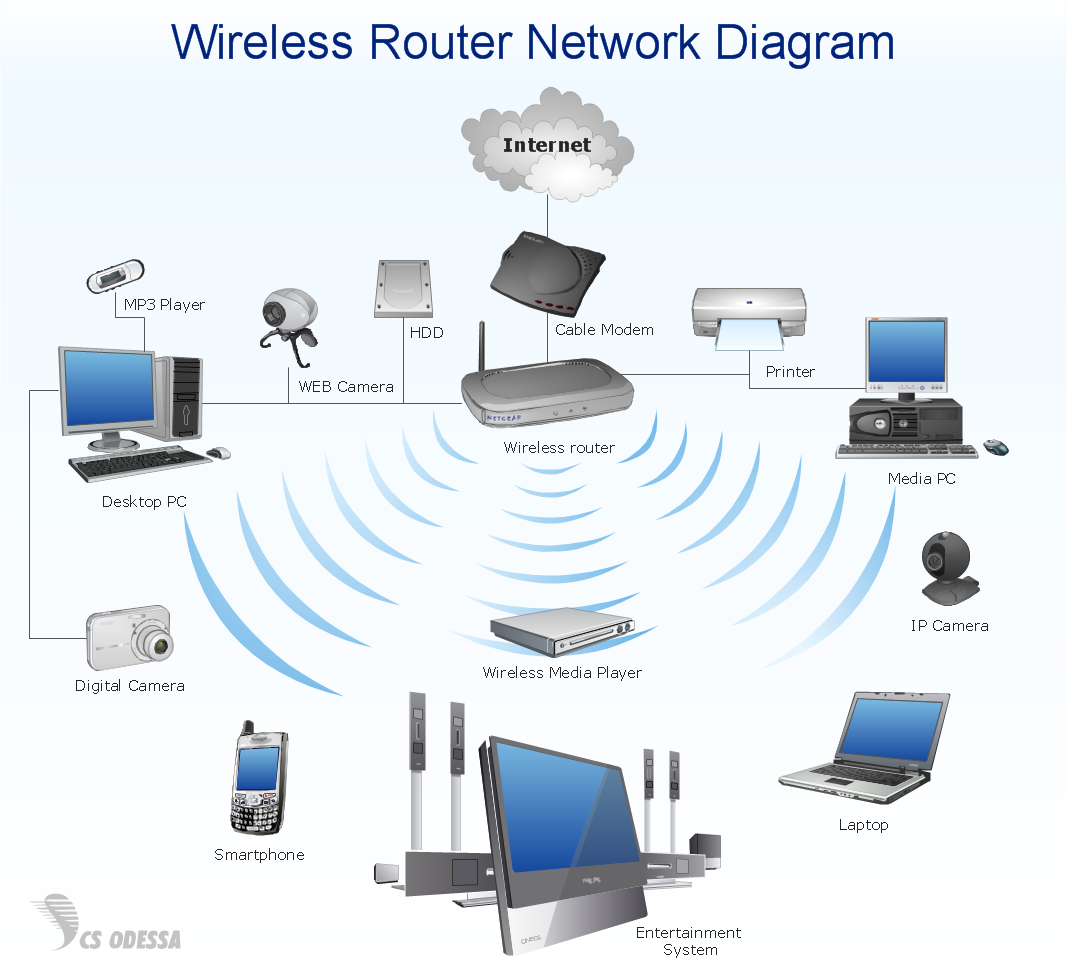
Picture: Network Diagram Software Home Area Network
Related Solution:
Cisco icons are globally recognized and generally accepted as standard for network icon topologies. The ConceptDraw vector stencils library Cisco buildings contains 21 symbols for drawing the computer network diagrams using the ConceptDraw DIAGRAM diagramming and vector drawing software.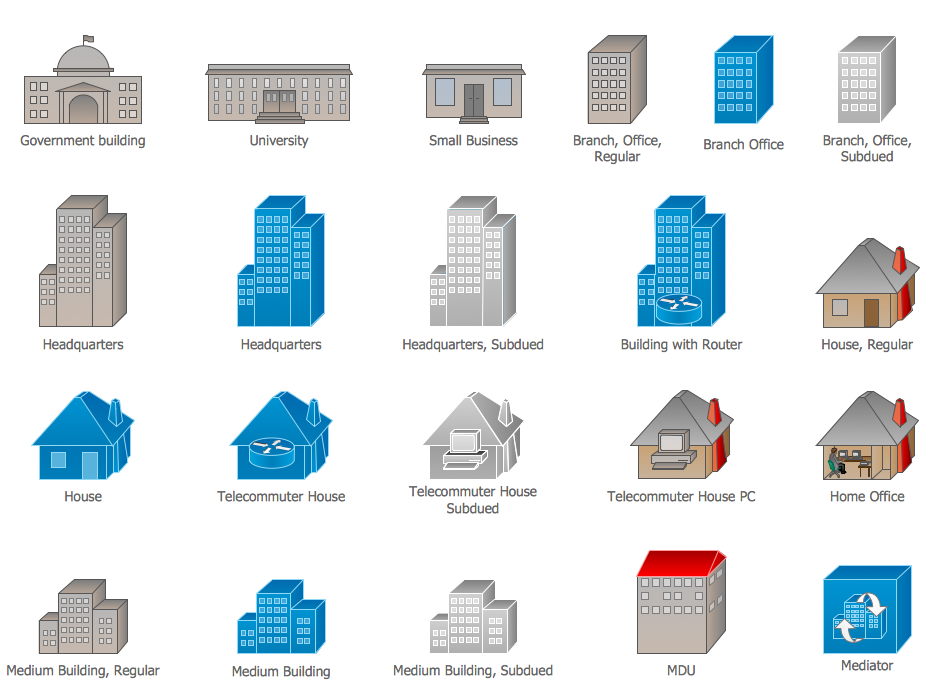
Picture: Cisco Buildings. Cisco icons, shapes, stencils and symbols
Related Solution:
ConceptDraw - Perfect Network Diagramming Software with abundant examples and templates. ConceptDraw Network Diagram is ideal for network engineers and network designers who need to draw Enterprise Private Network diagrams.
Picture: Network Diagram SoftwareEnterprise Private Network
Related Solution:
Asynchronous Transfer Mode (ATM) is a high-speed networking standard intended for supporting the voice and data communications.
ConceptDraw DIAGRAM is a powerful network diagramming and vector drawing software that provides the Computer and Networks solution with wide set of ready-to-use predesigned vector stencils and examples to help you design the ATM Networks quick and easy.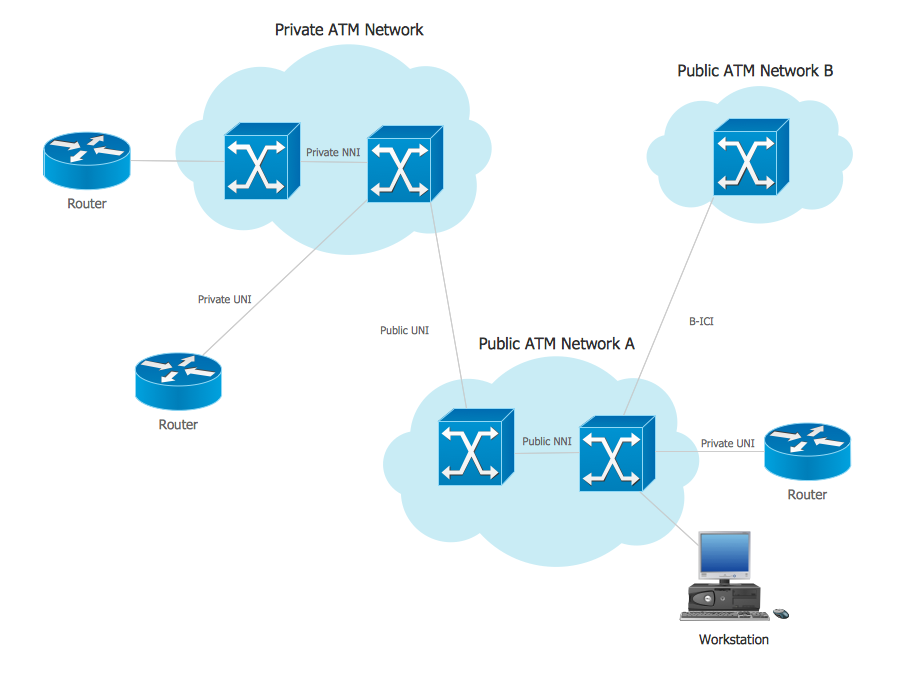
Picture: ATM Network. Computer and Network Examples
Related Solution:
This sample was created in ConceptDraw DIAGRAM diagramming and vector drawing software using the Computer and Networks solution from Computer and Networks area of ConceptDraw Solution Park.
This sample shows the Hypercube network topology.
Network topology is the topological structure of the computer network.
Hypercube is a type of the toroidal network. The Torus is a topology with n-dimensional grid network with circularly connection of the nodes. If the number of nodes along each dimension of the toroidal network is 2, it is a Hypercube network topology.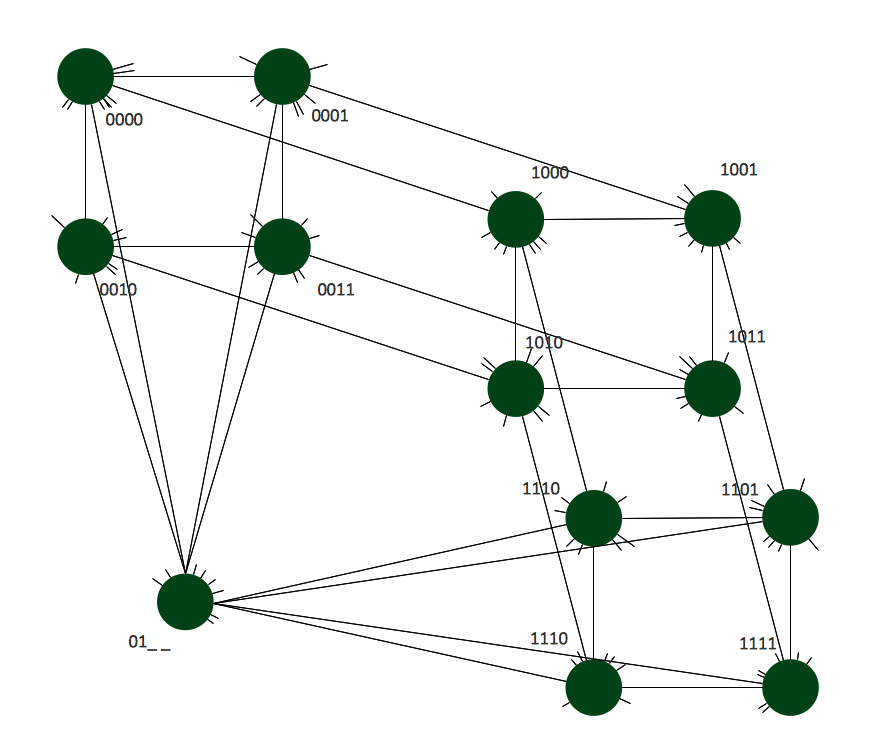
Picture: Hypercube Network Topology
Related Solution:
There are numerous articles about the advantages of flowcharting, creating business graphics and developing different charts. Nevertheless, these articles are almost useless without the main component - the examples of flowcharts, org charts and without a fine example, it is difficult to get all the conveniences of creating diagrams. You can find tons of templates and vivid examples on Solution Park.
This illustration shows a variety of business diagrams that can be created using ConceptDraw DIAGRAM. It comprises a different fields of business activities: management, marketing, networking, software and database development along with design of infographics and business illustrations. ConceptDraw DIAGRAM provides a huge set of sample drawings including business process modeling diagrams,, network diagrams, UML diagrams, orgcharts, DFD, flowcharts, ERD, geographical maps and more.
Picture: Examples of Flowcharts, Org Charts and More
Related Solution:
ConceptDraw Wireless Network solution includes several wireless network diagram examples that users can modify and make your own diagram.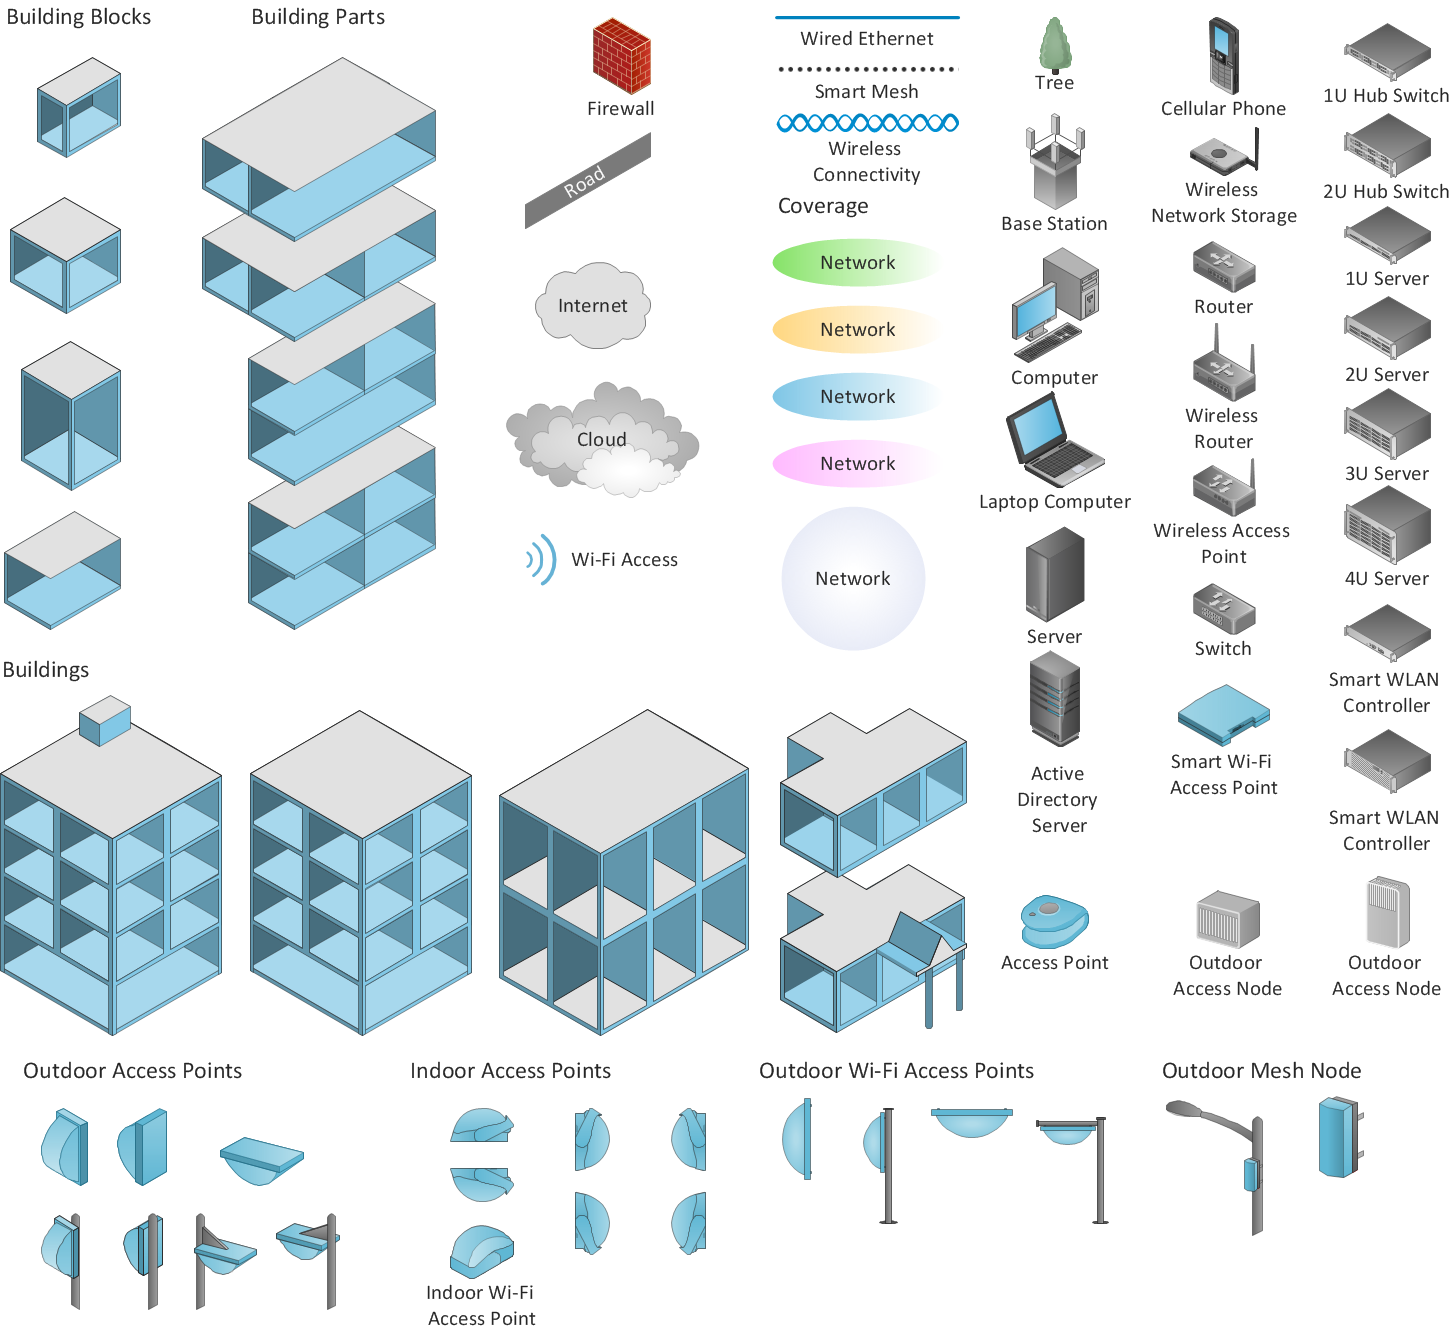
Picture: Wireless Network Diagram Examples
Related Solution:
Draw Cisco Network Topology and Cisco Computer Network Diagrams, Designs, Schematics, and Network Maps using ConceptDraw in no Time!
Cisco Network Diagrams solution also provides 15 libraries of 508 Cisco symbols for network components and points, LAN and WAN, schematic and wiring drawings.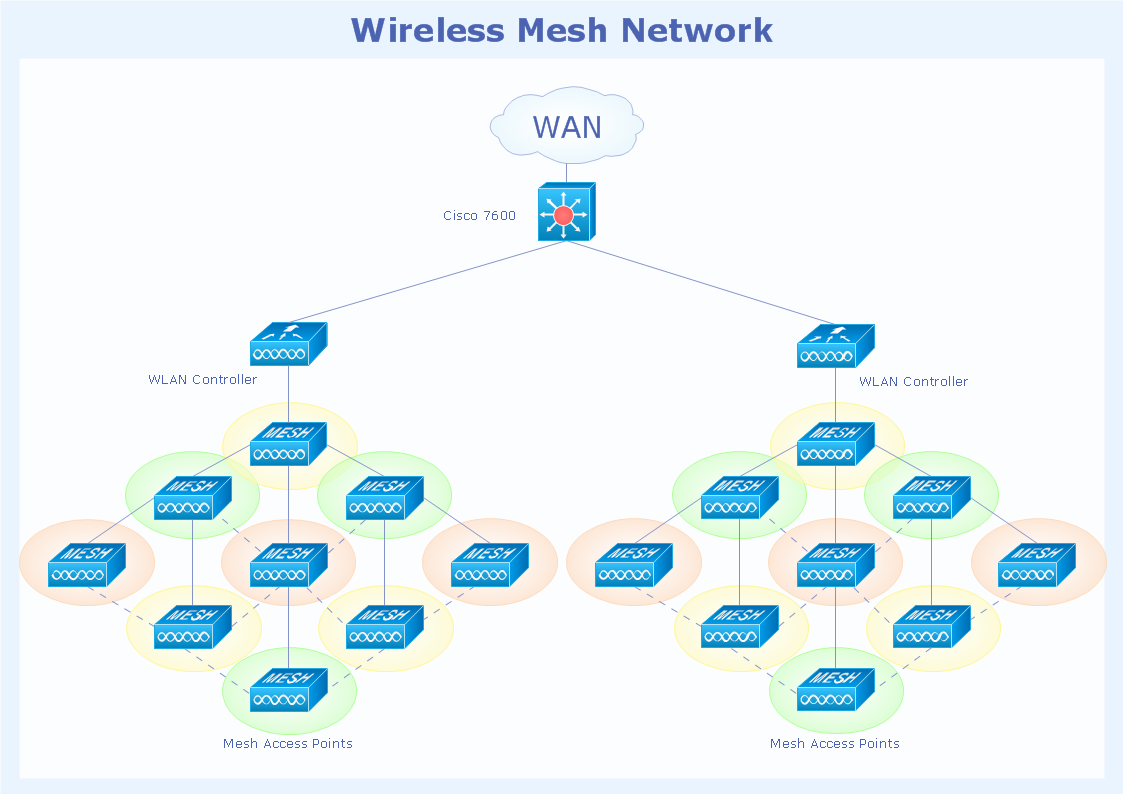
Picture: Cisco Network Topology
Related Solution:
Making the Active Directory Diagrams is always better with the Active Directory Diagrams solution, developed by the specialists of CS Odessa for simplifying all the ConceptDraw DIAGRAM users’ work by making it much simpler to create the needed drawing.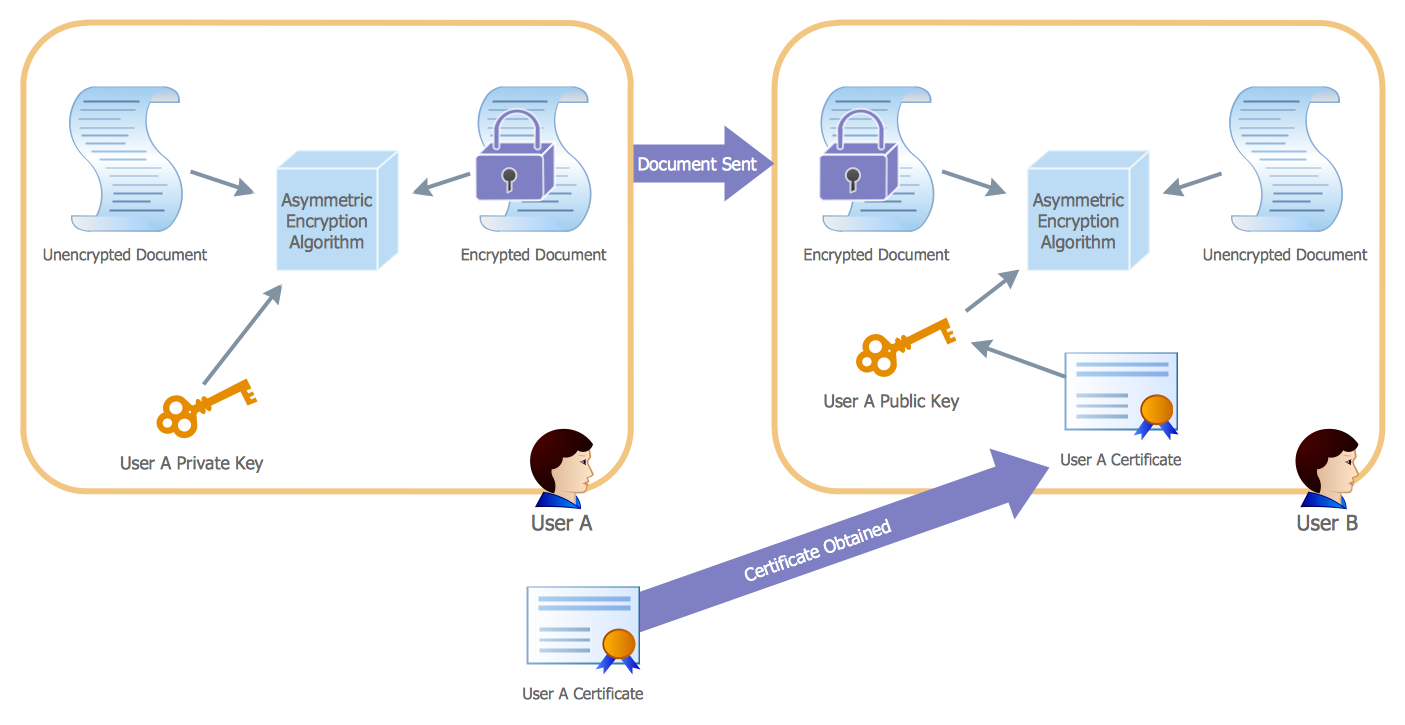
Picture: Active Directory
Related Solution:
Variable delay elements are often used to manipulate the rising or falling edges of the clock or any other signal in integrated circuits. Delay elements are also used in delay locked loops and in defining a time reference for the movement of data within those systems.
26 libraries of the Electrical Engineering Solution of ConceptDraw DIAGRAM make your electrical diagramming simple, efficient, and effective. You can simply and quickly drop the ready-to-use objects from libraries into your document to create the electrical diagram.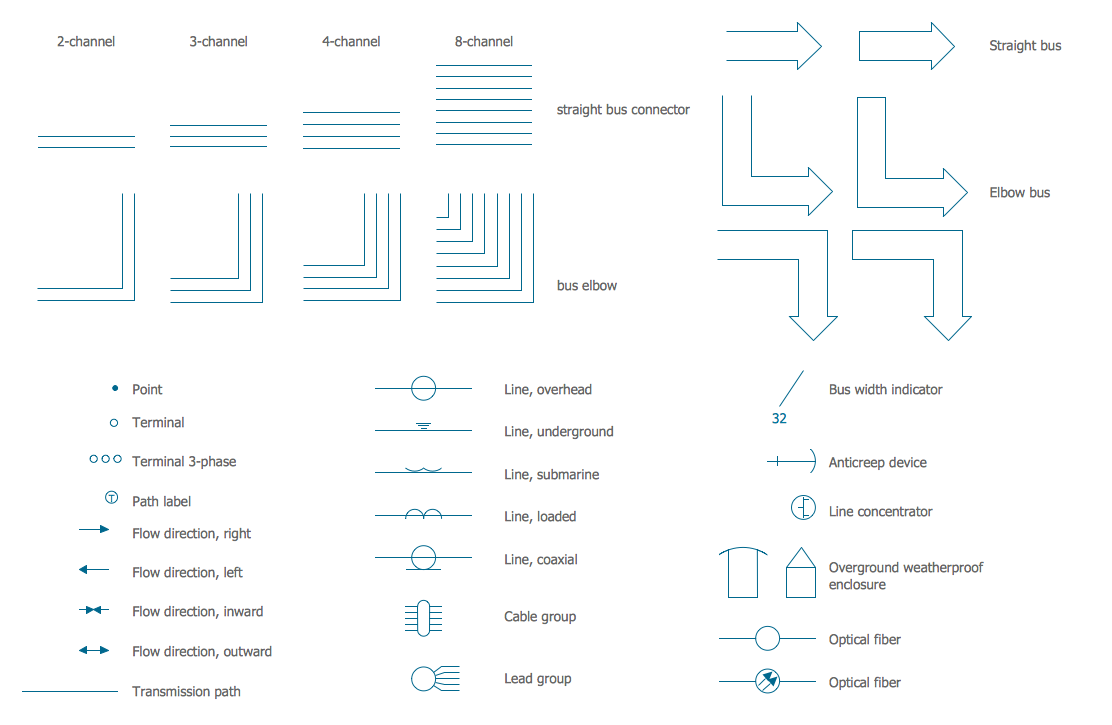
Picture: Electrical Symbols — Transmission Paths
Related Solution:
ConceptDraw
DIAGRAM 18