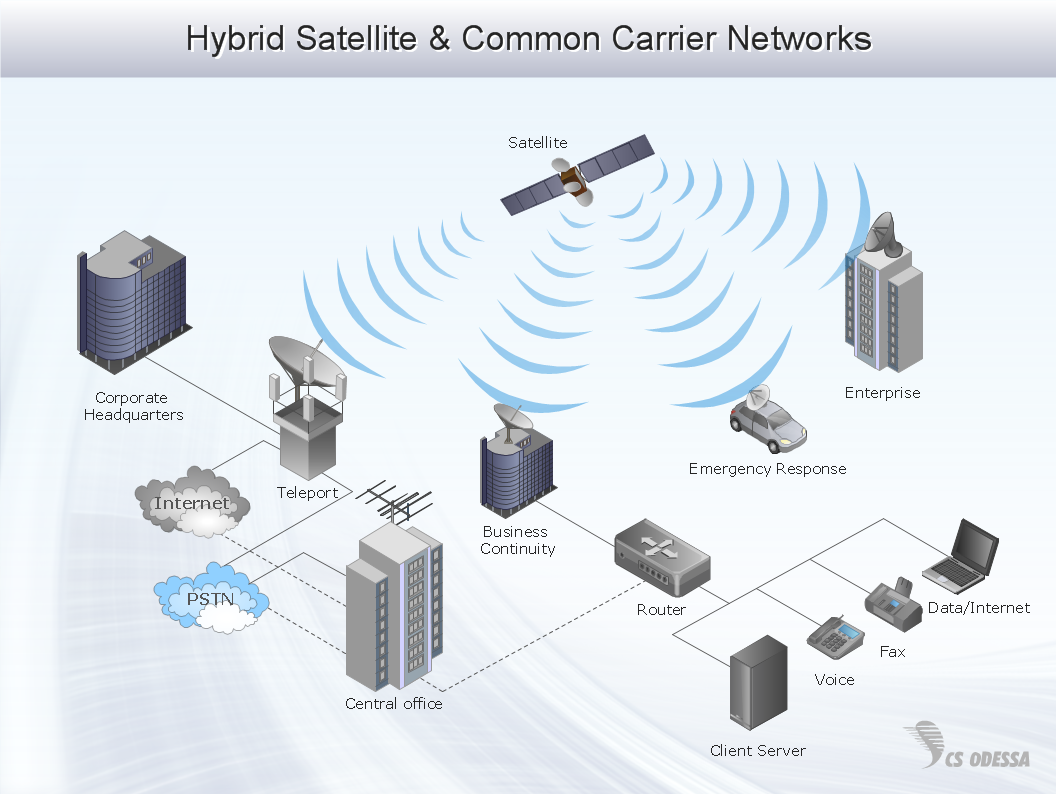
Pic. 1 Hybrid enterprise private network diagram
This enterprise private network diagram sample is created using ConceptDraw DIAGRAM diagramming and vector drawing software enhanced with Computer & Networks solution from ConceptDraw Solution Park.

Pic. 2 Enterprise Private Network solution
Computer & Networks solution providessamples, templates and libraries of symbols for all types of computer network diagrams:
- LAN and WAN floor plan layouts,
- network communication plans,
- Cisco network diagrams,
- Active Directory diagrams,
- logical and physical network diagrams,
- network architecture
- topology diagrams.
NINE RELATED HOW TO's:
Nowadays, more and more attention is paid to the comfort in the workplace, so that employees might be more motivated. Thus, it can be said with full confidence that office layout plays an important role for employees and influences company reputation. Many worldwide known companies have headquarter offices resembling more of a campus than of an office building.
Every organization has its own unique office design ideas, needs and requirements. Each of office position requires a certain type of person who has his own requirements, needs and habits. Office layout should be designed to facilitate its business function. The well-organized office space plays an important role in a workflow enhancement and productivity improvement. This office layout diagram demonstrates a typical cubical office layout. This diagram can be use as a template for cubicle office layout organization. This visual example can help shape ideas and design your office layout conception. You can start with adding your requested office furniture objects into your office floor plan. Plants help to create a healthy indoor environment. You can design an office space that totally fits your needs.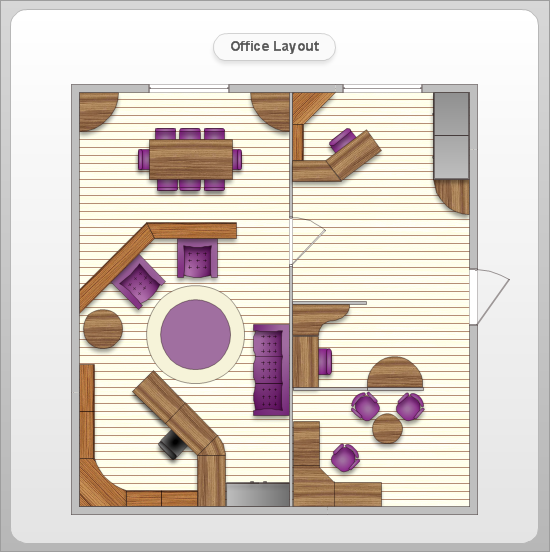
Picture: Office Layout
Related Solution:
Public catering business will always be in demand.To attract a lot of clients, it’s important to have a detailed banquet hall plan, a diverse menu and reasonable prices. If you want to create a good plan, you can use drawing software.
When planning and considering the layout of a banquet hall, one must take into consideration, that it is very significant to make it stylish with correctly selected appointment and celebratory belongings. Tables and seating must be handily arranged. The furniture arrangement can changes depending on client requirements, kind of banquet and amount of guests. ConceptDraw Cafe and Restaurant Plans solution supplies a dozens of predesigned vector graphic objects of banquet furniture and accessories. Thus you can design the Banquet Hall layout for the celebrations in any style and any number of guests.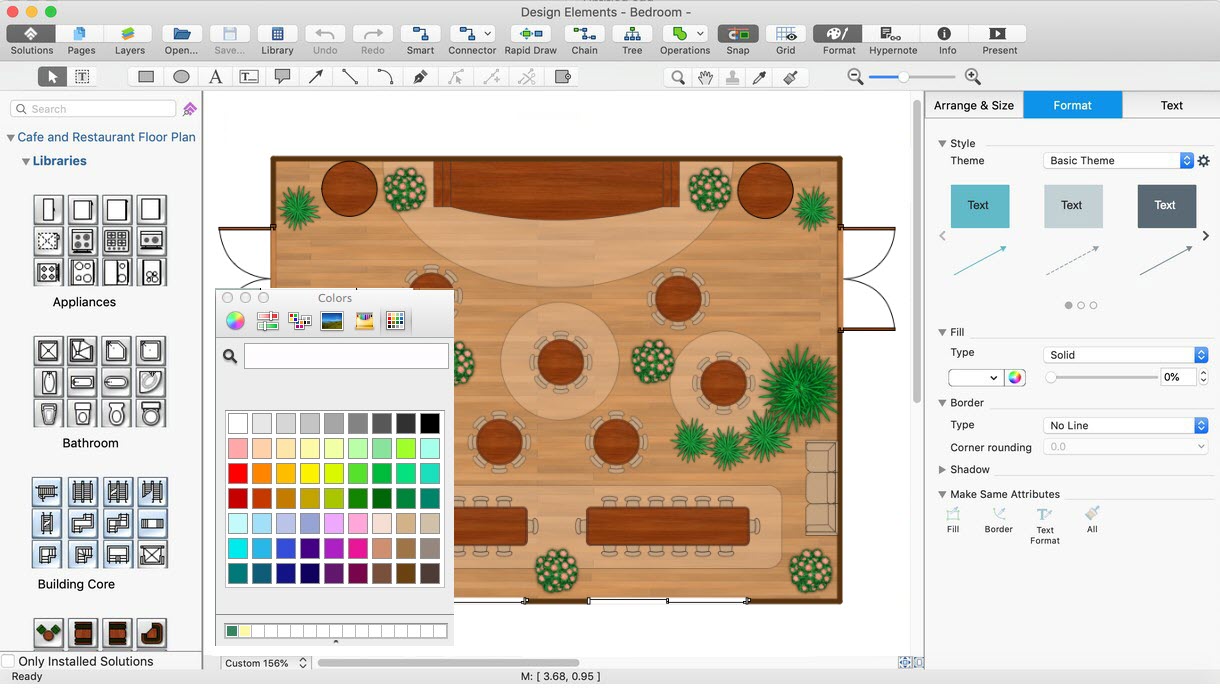
Picture: Banquet Hall Plan Software
Related Solution:
ConceptDraw DIAGRAM is a powerful intelligent vector graphics tool for drawing flowcharts.
Picture: Basic Diagramming Flowchart Software
Related Solution:
A Wireless network is a type of the computer network that uses the wireless connections for connecting network nodes for data transfer. The wireless networks are very useful, inexpensive, popular and widely used. They are easy setup and do not require the cables installation.
Using the solutions of the Computer and Networks Area for ConceptDraw DIAGRAM you can design the wireless network diagrams of any complexity quick and easy.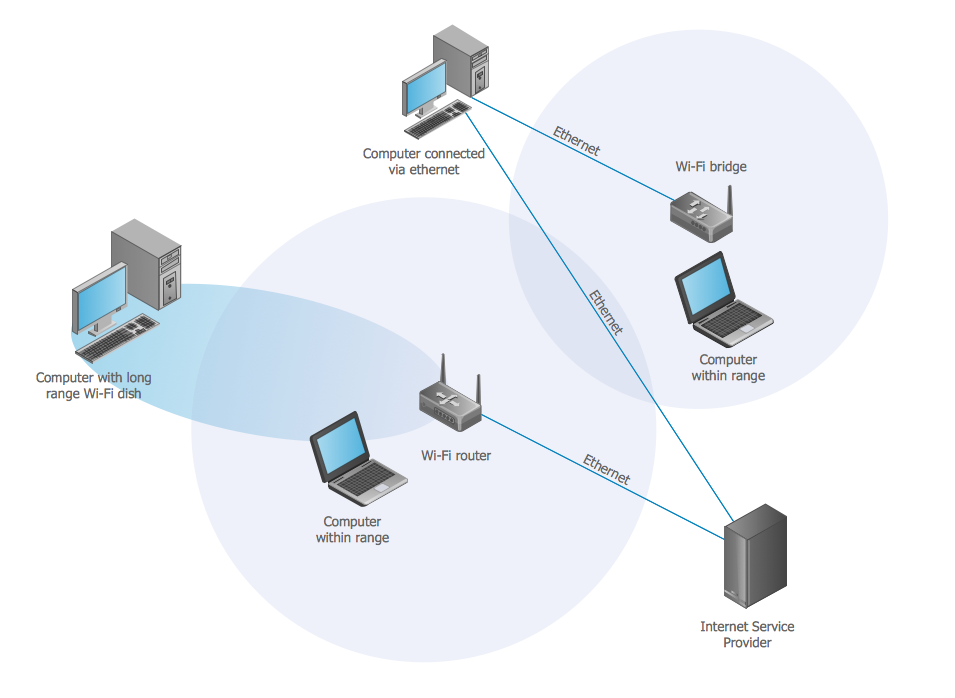
Picture: Wireless network. Computer and Network Examples
Related Solution:
Network community structure is a network which nodes can be easily grouped into the sets of nodes with dense internally connections.
This example shows a network that displays the community structure with three groups of nodes with dense internal connections and sparser connections between the groups.
Picture: Network Community Structure. Computer and Network Examples
Related Solution:
Office design must to be well thought-out. It is especially important for the small offices, where each detail is in sight. ConceptDraw DIAGRAM software offers you the Office Layout Plans Solution from the Building Plans Area for quick and easy creating detailed Small Office Design plans.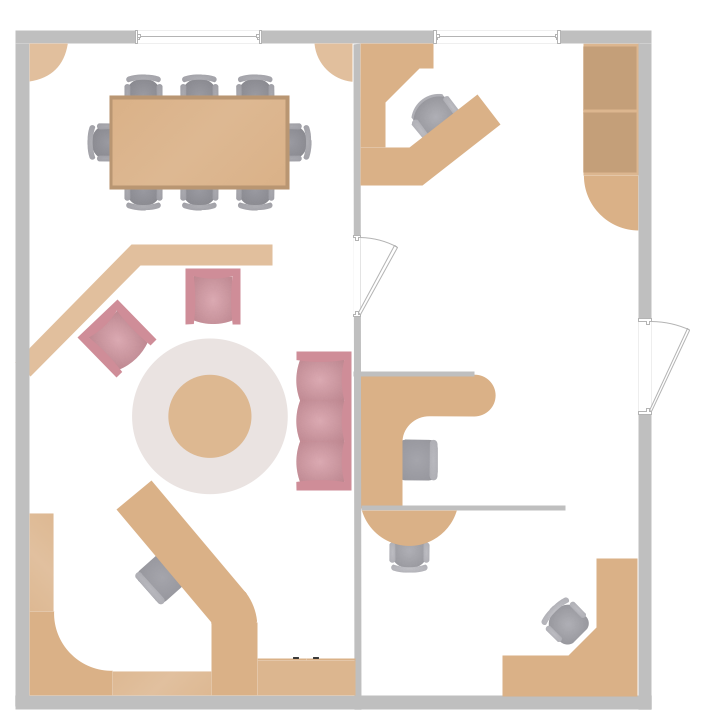
Picture: Small Office Design
Related Solution:
There are a lot of tutorials that get you familiar with emergency situations. If you want to know how to create emergency plans and fire evacuation schemes then you must be concerned about safety. There is a list of rules that you should follow to set the fire safety equipment properly.
Discover this precise and accurate fire emergency evacuation plan. This sample drawing demonstrate facilities of ConceptDraw DIAGRAM together with its Fire and Emergency Plans solution. The evacuation plan is designed to provide employees and visitors with a map depicting the ways they may use to escape the building in emergency situations. The telephone sets, first aid boxes and extinguisher are also marked on this plan. The evacuation plan should contain a legend for readers. The similar plans are commonly hang on the wall on the building's floors.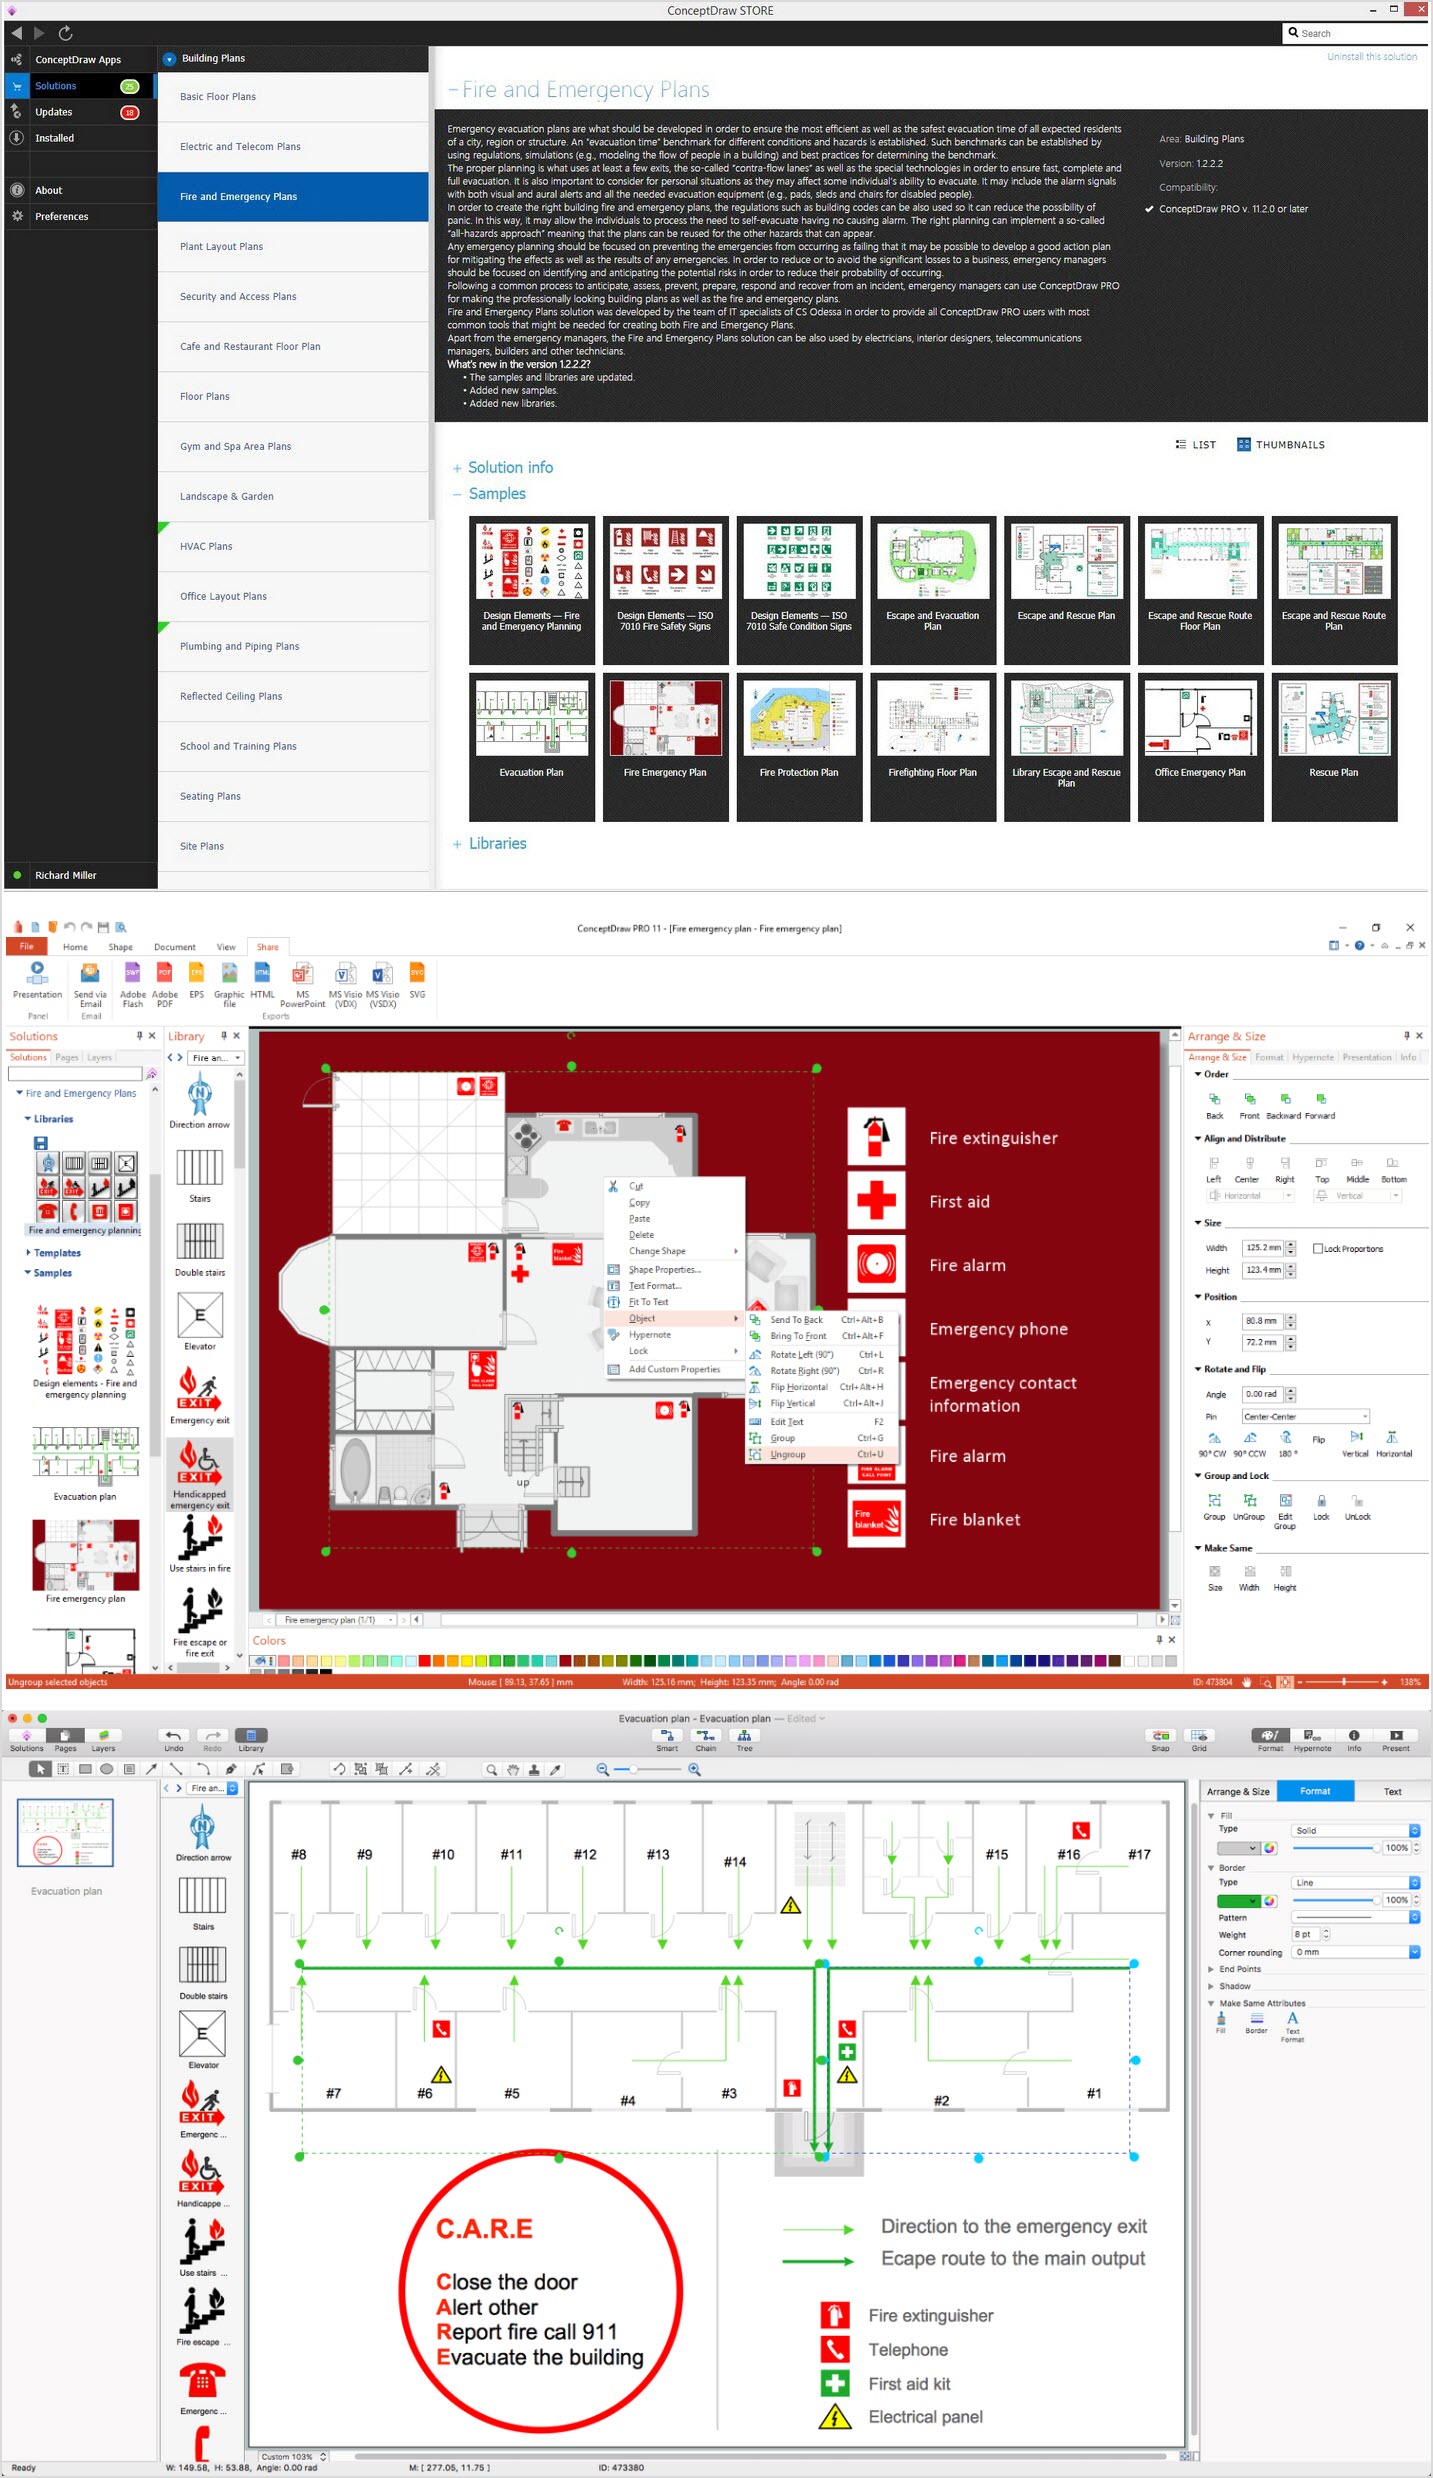
Picture: How To Create Emergency Plans and Fire Evacuation
Related Solution:
What is a computer network? This is a set of devices and systems that are connected to each other (logically or physically) and communicate with each other. This could include servers, computers, phones, routers, and so on. The size of this network can reach the size of the Internet, and can consist of only two devices connected by a cable.
This sample shows the connection scheme of the home WLAN equipment to the Internet.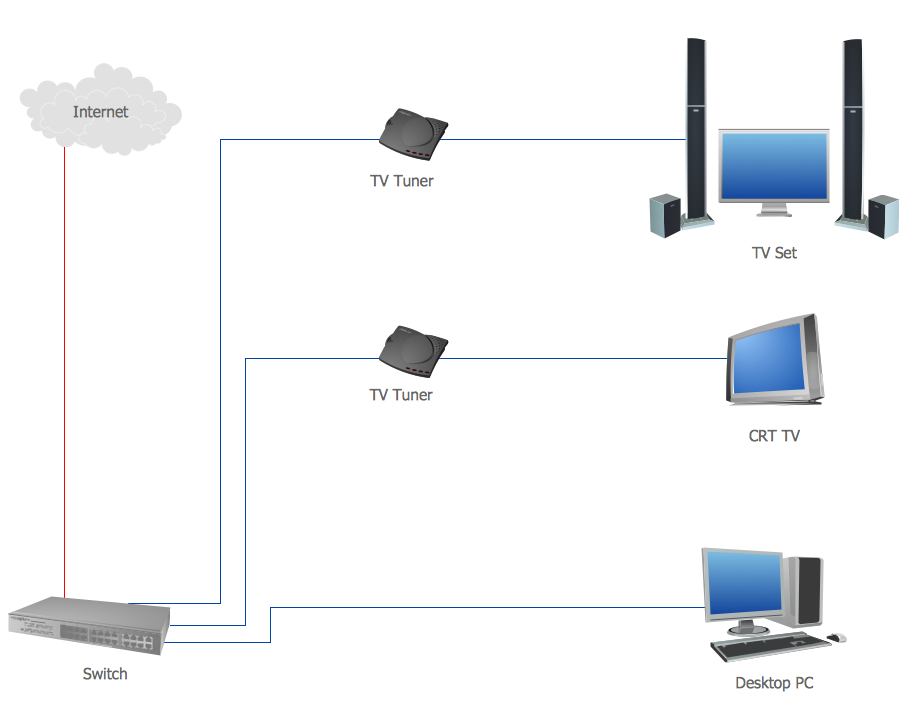
Picture: Diagram of a Basic Computer Network. Computer Network Diagram Example
Related Solution:
Using diagrams is the easiest way to explain the soccer formations. The Soccer solution from the Sport area of ConceptDraw Solution Park is designed as a tool that helps you produce the soccer diagrams in a few minutes. The predesigned samples of the Soccer solution for ConceptDraw DIAGRAM depict the most popular formation diagrams.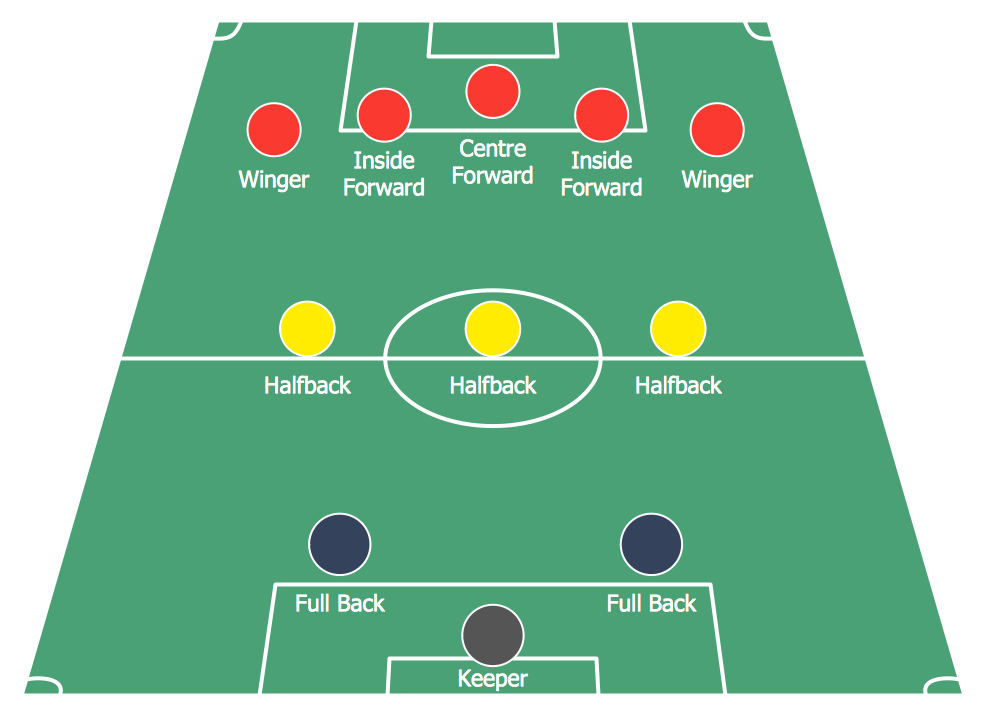
Picture: Soccer (Football) Formation
Related Solution:
