Network Diagram Software
Logical Network Diagram
How to draw Logical Network Diagram
Logical Network Diagrams visualize the computer and telecommunication networks logical structure. They are used by IT professionals and corporate IT departments, network and system administrators to visually document the topology of computer and telecommunication networks. ConceptDraw has 1004 vector stencils in the 40 libraries that helps you to start using software for designing your own Logical Network Diagrams.
You can use the appropriate stencils from Computer and Network Diagrams object libraries.

TEN RELATED HOW TO's:
UML Composite Structure Diagram shows the internal structure of a class and the possible interactions at this structure.
ConceptDraw has 393 vector stencils in the 13 libraries that helps you to start using software for designing your own UML Diagrams. You can use the appropriate stencils of UML notation from UML Composite Structure library.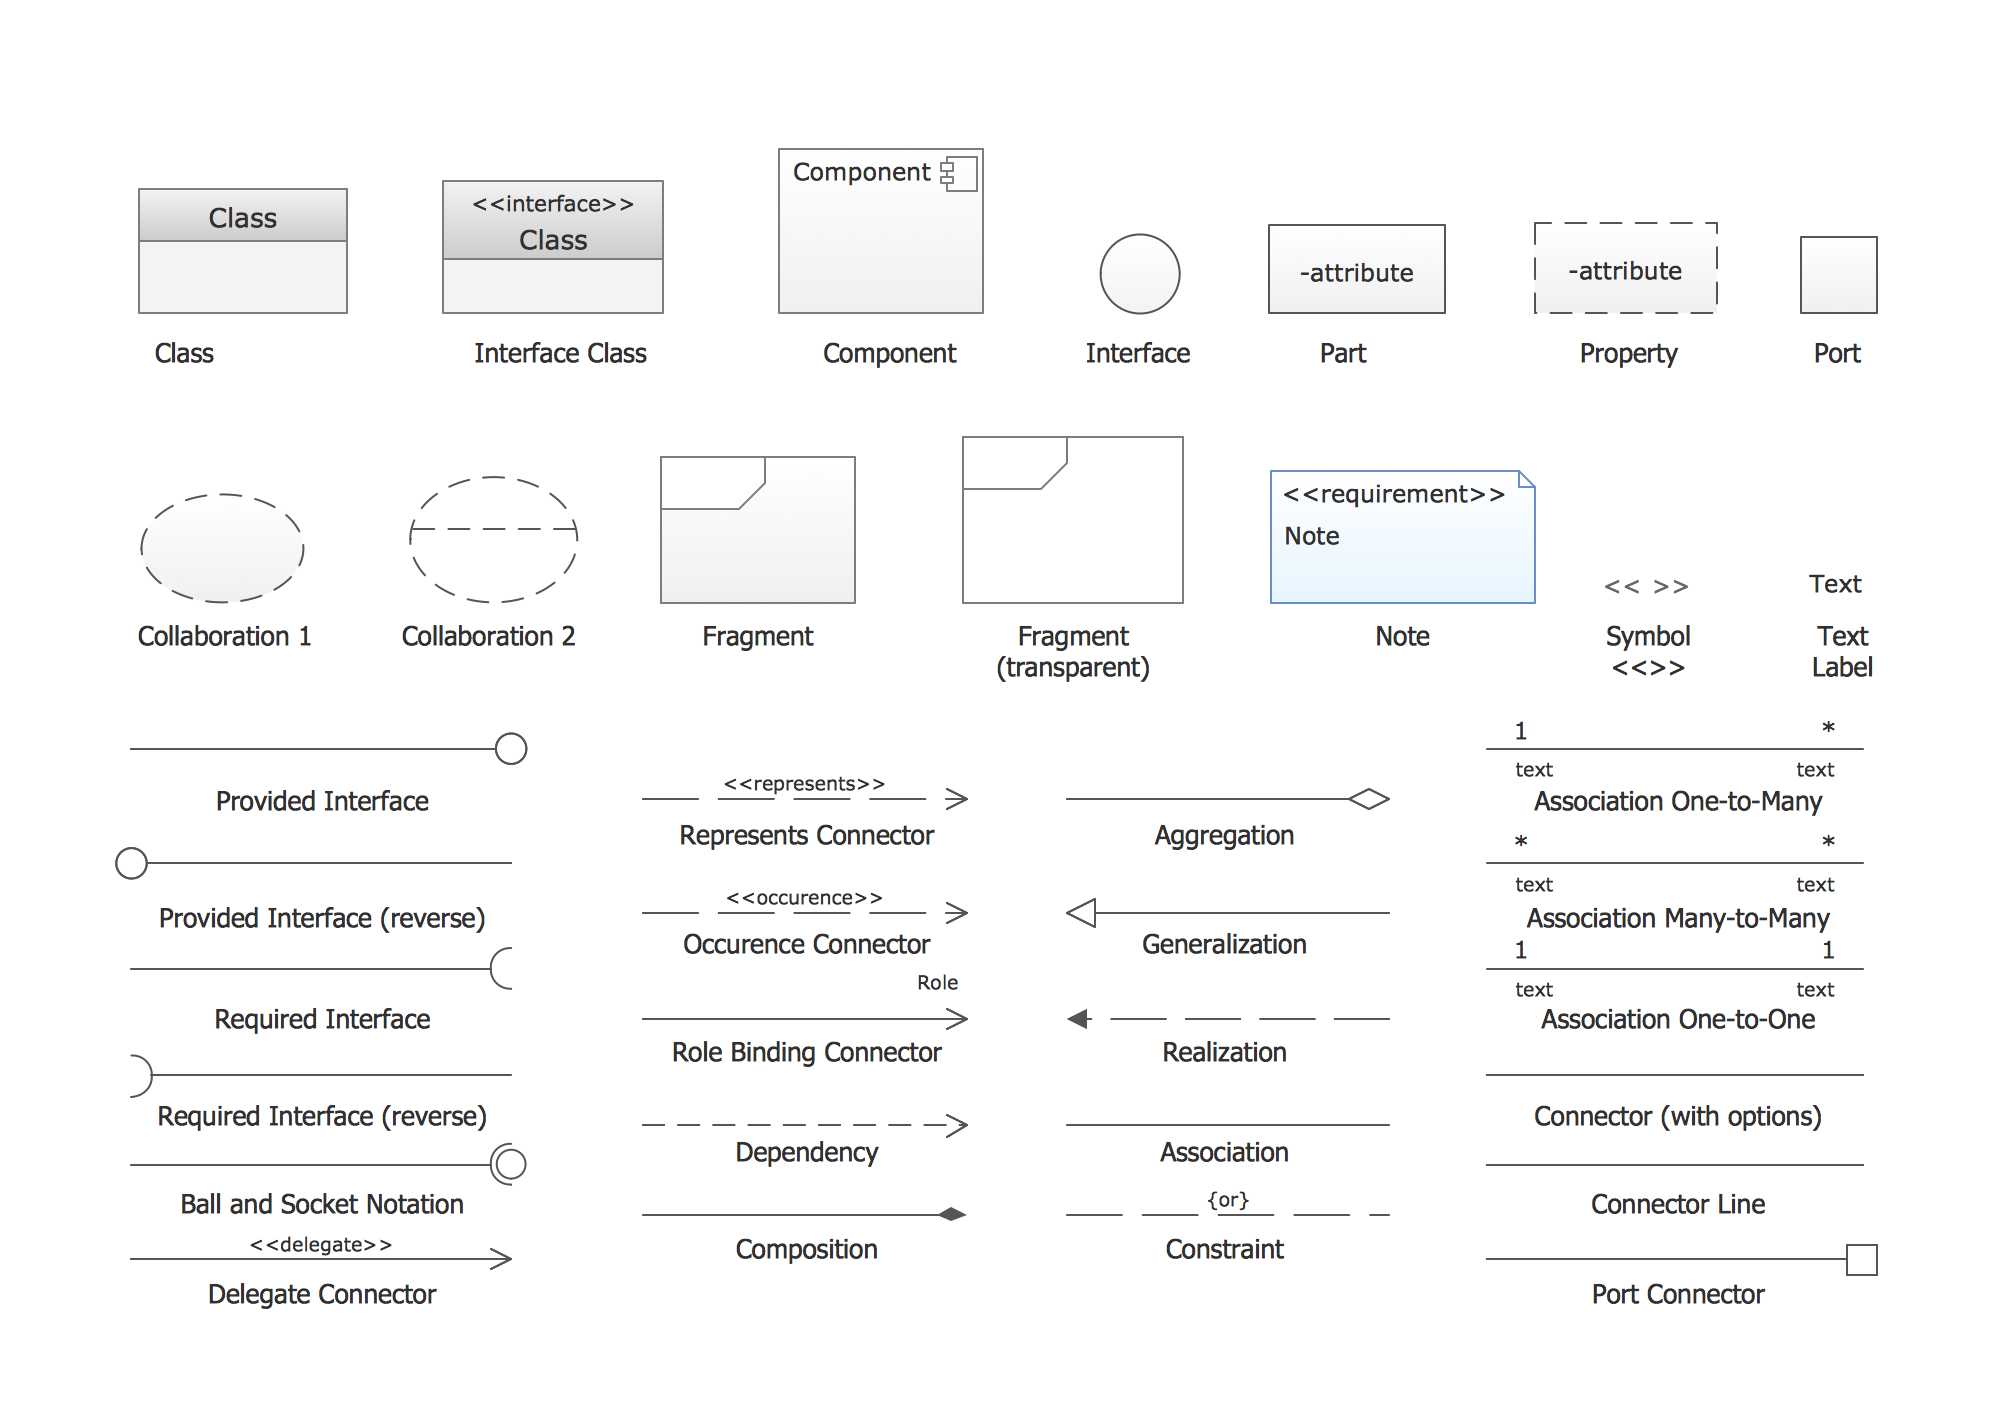
Picture: UML Composite Structure Diagram. Design Elements
Related Solution:
Cisco icons are globally recognized and generally accepted as standard for network icon topologies. The ConceptDraw vector stencils library Cisco buildings contains 21 symbols for drawing the computer network diagrams using the ConceptDraw DIAGRAM diagramming and vector drawing software.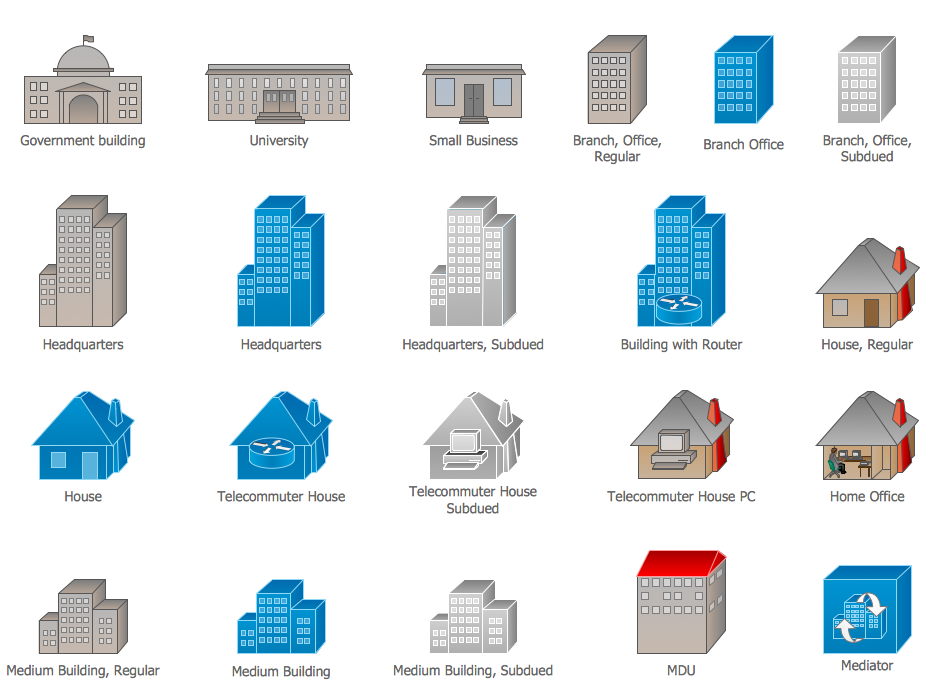
Picture: Cisco Buildings. Cisco icons, shapes, stencils and symbols
Related Solution:
Cisco Network Diagrams solution from the Computer and Networks area of ConceptDraw Solution Park provides 14 libraries with 450 ready-to-use predesigned vector objects that can be used for quickly and easily drawing the professional Cisco Network Diagrams.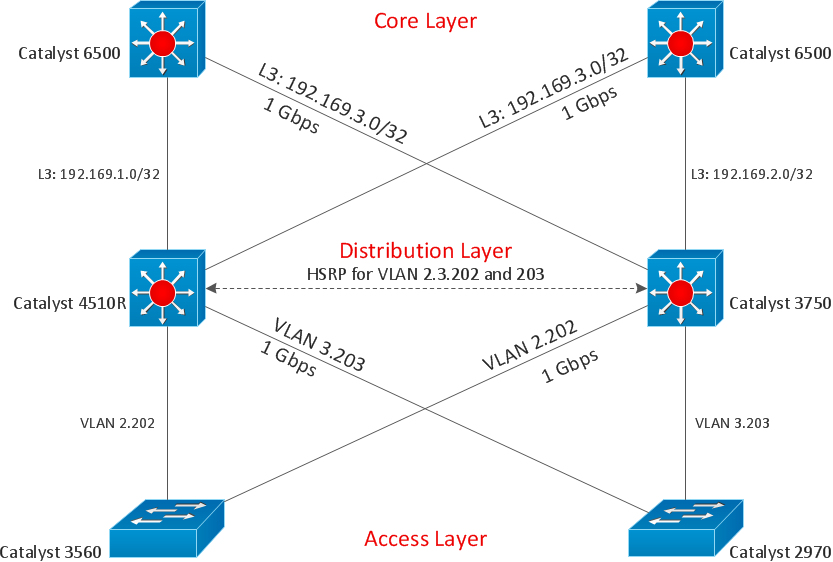
Picture: Cisco Design
Related Solution:
In Cross-Functional Flowchart first step is to determine how many lanes you want to represent and what the lane titles will be. The choice of vertical or horizontal swim lanes landscape comes down to personal choice or just plain “what fits best”.
With ConceptDraw, we make that simple by including different swim lanes templates.
Professional looking examples and templates of Swimlane Flowchart which help you create Cross Functional Flowcharts rapidly.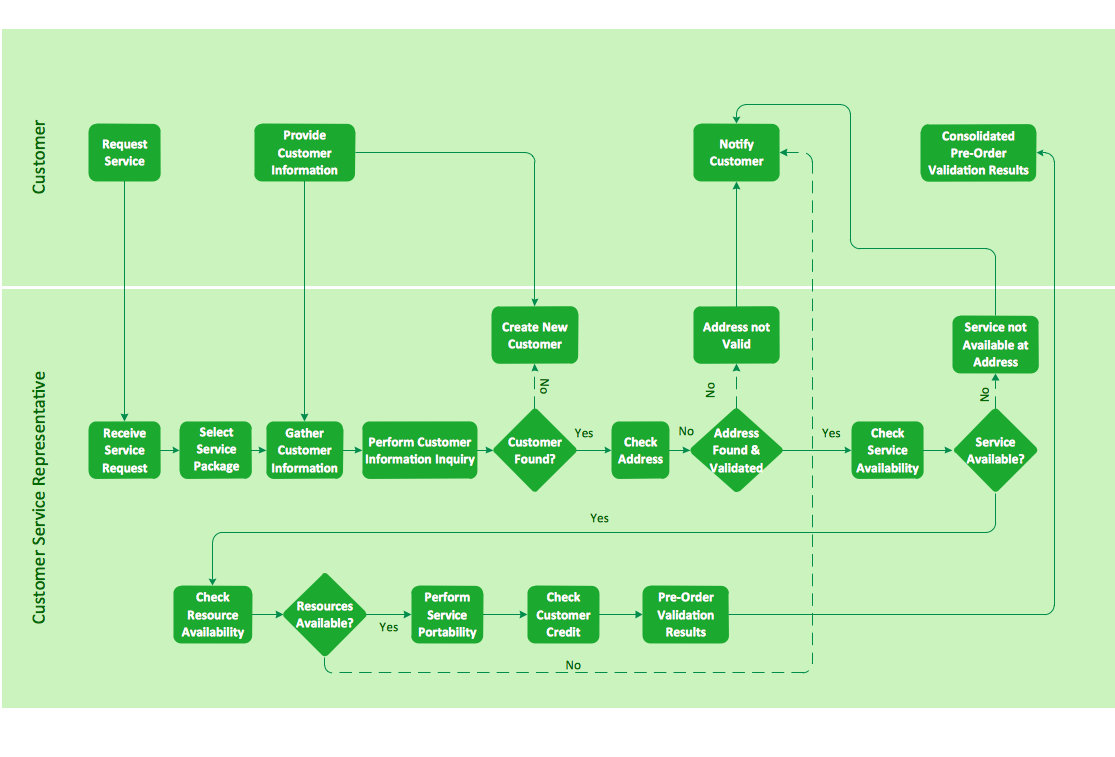
Picture: Cross-functional flowchart landscape, U.S. units
Activity diagram describes the business and operational step-by-step workflows of components in a system. An activity diagram shows the overall flow of control.
Picture: Diagramming Software for Design UML Activity Diagrams
There are many tools to manage a process or to illustrate an algorithm or a workflow. Flowcharting is one of those tools. However, it may be difficult to show complex processes that require multiple attributes or several people in a simple flowchart, so a cross-functional flowchart would be a solution for that situation. To create such flowchart, group processes and steps to labeled rows or columns, and divide those groups with horizontal or vertical parallel lines. It is worth mentioning that there are different types of cross-functional flowcharts, like opportunity or deployment flowchart.
This diagram shows a cross-functional flowchart that was made for a trading process. It contains 14 processes, distributed through 5 lines depicting the participants who interact with the process. Also there are connectors that show the data flow of information between processes. The cross-functional flowchart displays a detailed model of the trading process, as well as all participants in the process and how they interact with each other. The lines in the flowchart indicates the position, department and role of the trading process participants.
Picture: Cross-Functional Flowchart
Related Solution:
ConceptDraw DIAGRAM is a powerful diagramming and vector drawing software. Extended with Office Layout Plans Solution from the Building Plans Area, ConceptDraw DIAGRAM became the ideal software for making Office Floor Plans.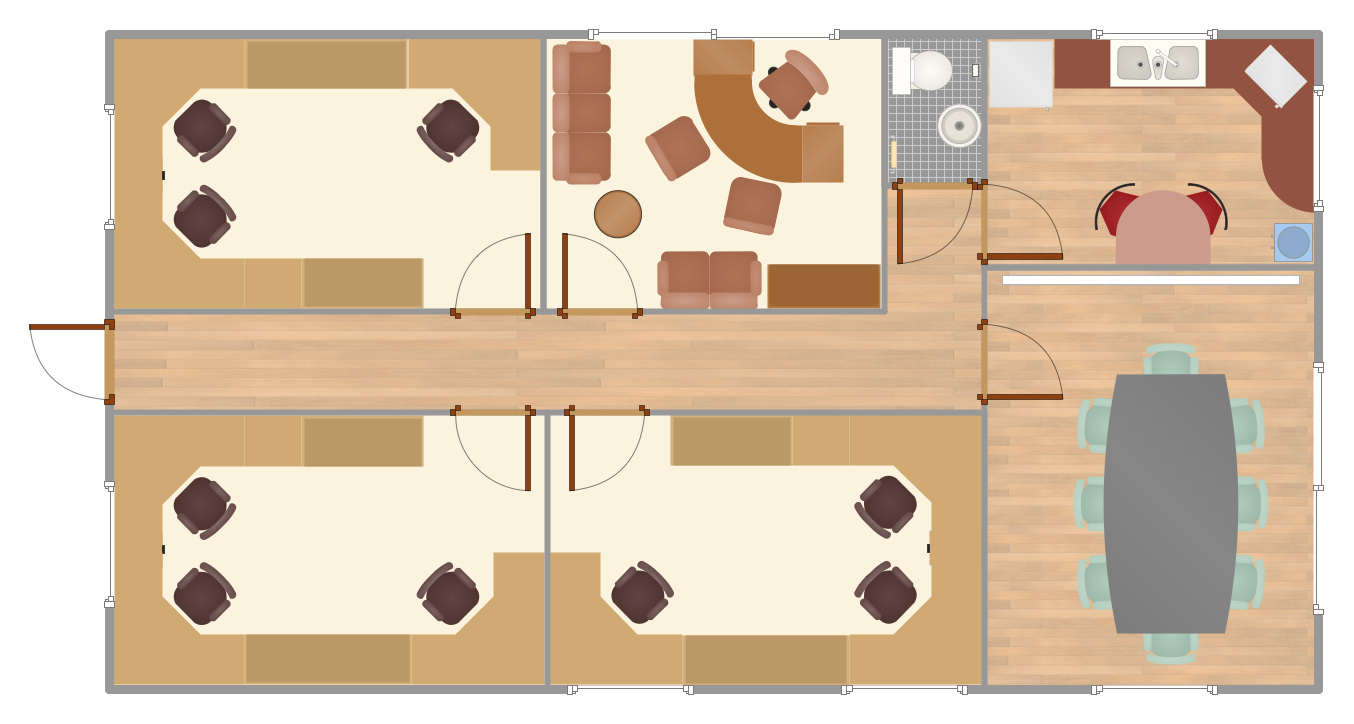
Picture: Office Floor Plans
Related Solution:
Ultra high frequency (UHF) is the ITU designation for radio frequencies in the range between 300 MHz and 3 GHz, also known as the decimetre band as the wavelengths range from one meter to one decimetre. Radio waves with frequencies above the UHF band fall into the SHF (super-high frequency) or microwave frequency range. Lower frequency signals fall into the VHF (very high frequency) or lower bands. UHF radio waves propagate mainly by line of sight; they are blocked by hills and large buildings although the transmission through building walls is strong enough for indoor reception. They are used for television broadcasting, cell phones, satellite communication including GPS, personal radio services including Wi-Fi and Bluetooth, walkie-talkies, cordless phones, and numerous other applications.
26 libraries of the Electrical Engineering Solution of ConceptDraw DIAGRAM make your electrical diagramming simple, efficient, and effective. You can simply and quickly drop the ready-to-use objects from libraries into your document to create the electrical diagram.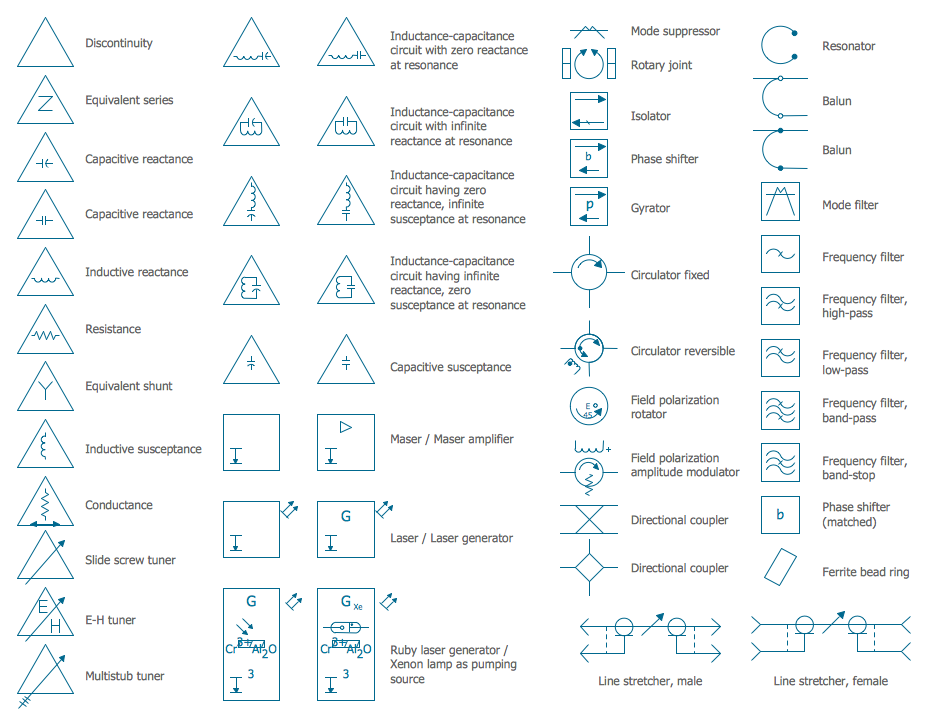
Picture: Electrical Symbols — VHF UHF SHF
Related Solution:
No building project can exist without an electrical circuit map. It’s more convenient to develop electrical drawing with a proper software which would contain vector shapes and electrical symbols. This will help in the future if any problems appear.
This circuit diagram shows the scheme of a location of components and connections of the electrical circuit using a set of standard symbols. It can be use for graphical documentation of an electrical circuit components. There are many of different electric circuit symbols that can be used in a circuit diagram. Knowing how to read circuit diagrams is a useful skill not only for professionals, but for any person who can start creating his own small home electronic projects.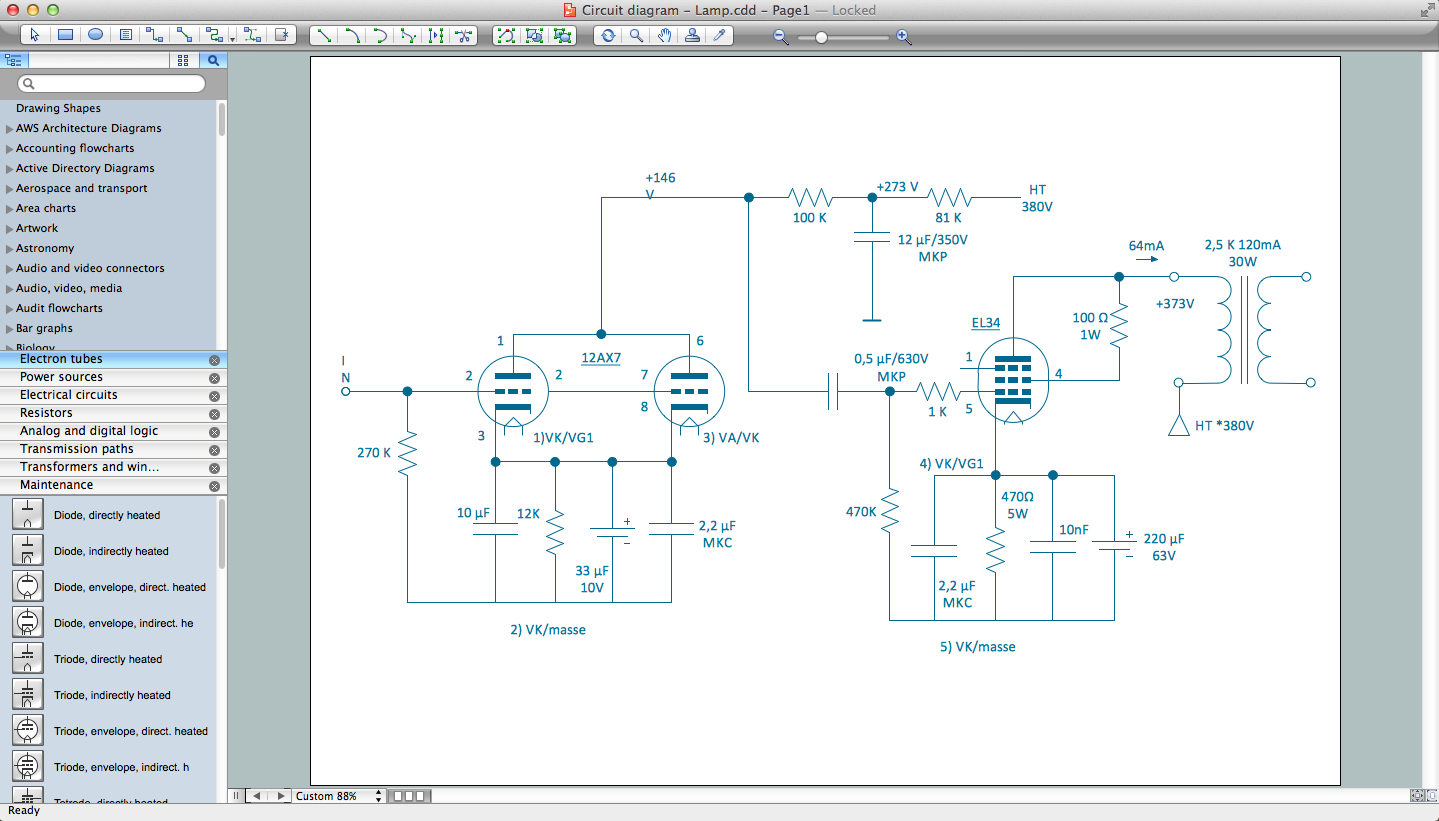
Picture: Electrical Drawing Software and Electrical Symbols
Related Solution:
To connect two or more network devices are used the network cables. There are more different types of the network cables: Coaxial cable, Optical fiber cable, Twisted Pair, Ethernet crossover cable, Power lines and others. They are used depending of the network topology, size, protocol.
This example was created in ConceptDraw DIAGRAM using the Computer and Networks solution from the Computer and Networks area of ConceptDraw Solution Park.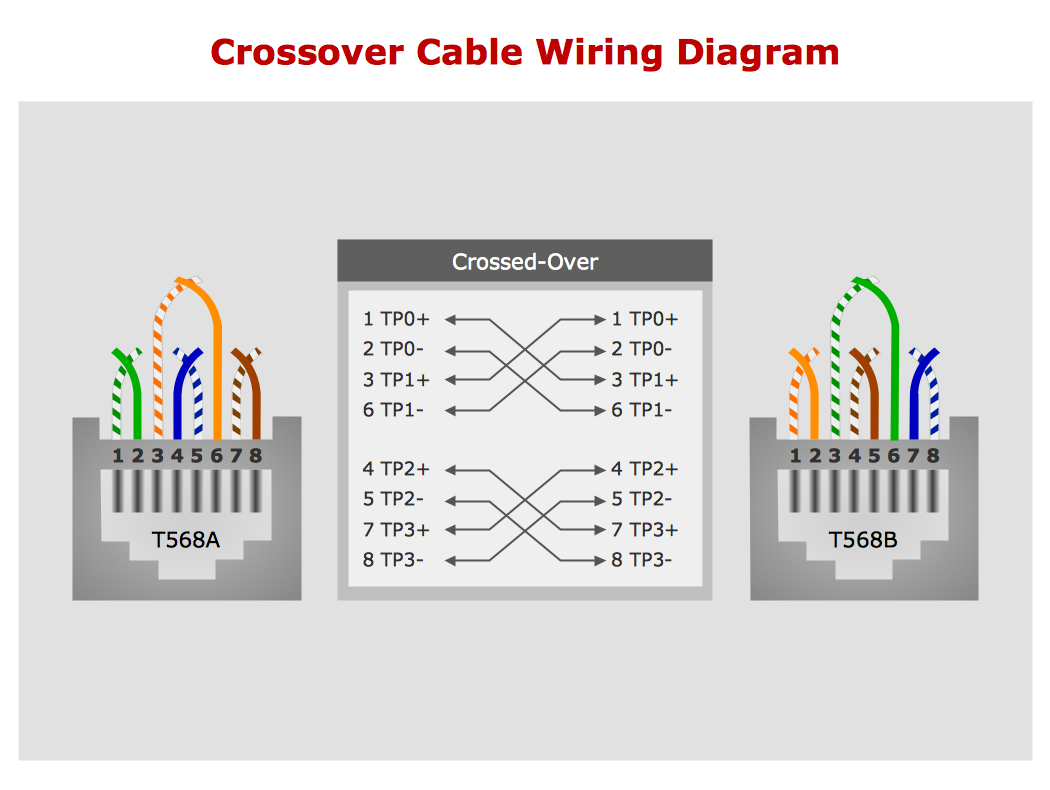
Picture: Network wiring cable. Computer and Network Examples
Related Solution:
ConceptDraw
DIAGRAM 18