Cisco Network Design
How To Design Cisco Computer Network Diagrams
In terms of Cisco Express Forwarding Sample, Cisco ISG Topology Diagram, Roaming Wireless Local Area Network, Network Organization Chart, Wireless Mesh Network and many other Cisco network design diagrams, ConceptDraw DIAGRAM software can be very helpful as once you download it you will get access to so many stencil libraries and pre-made samples and templates to make your own great looking plans, schemes, charts, flowcharts and, of course, many sophisticated diagrams. There are over 13 libraries, such as Cisco Basic one, Cisco IBM, Cisco Buildings, Cisco LAN, Cisco Media, Cisco WAN, Cisco Optical, Cisco People, Cisco Security, Cisco Switches&Hub, Cisco Routers,Cisco Telepresence and others which are available for your use.

Example 1. Cisco Network Design
Useful for IT engineers as well as telecom ones, designers, stakeholders and any other end-users, ConceptDraw DIAGRAM is a unique application which is good enough for making any Cisco network design.

Example 2. Cisco network diagram — Network diagram example
This Cisco network diagram sample is created using ConceptDraw DIAGRAM diagramming and vector drawing software enhanced with Computer & Networks solution from ConceptDraw Solution Park.
Computer & Networks solution also provides libraries of Cisco symbols for network components and points, LAN and WAN, schematic and wiring drawings.
Use ConceptDraw DIAGRAM program with of Computer & Networks solution as tool to draw professional-looking Cisco network architecture, topology, and design diagrams quickly and easily, and to clearly present and communicate it to IT and telecom engineers, designers, stakeholders and end-users.
TEN RELATED HOW TO's:
ConceptDraw Wireless network diagram helps network engineer to design, mount and support WLAN or WWAN.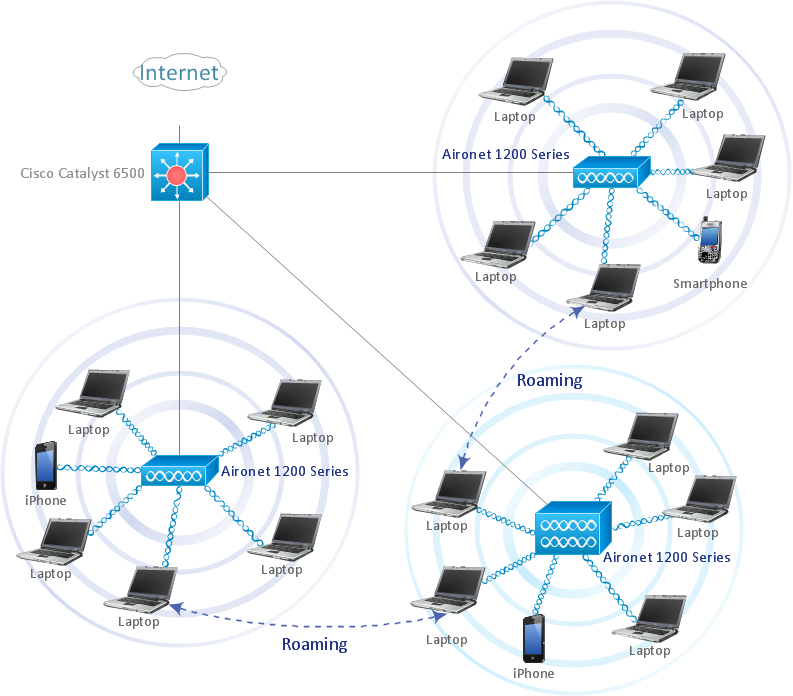
Picture: Wireless Network WLAN
Related Solution:
The AWS Architecture Diagrams solution includes icons, sample and templates for several Amazon Web Services products and resources, to be used when creating architecture diagrams. The icons are designed to be simple so that you can easily incorporate them in your diagrams and put them in your whitepapers, presentations, datasheets, posters or any technical material you like.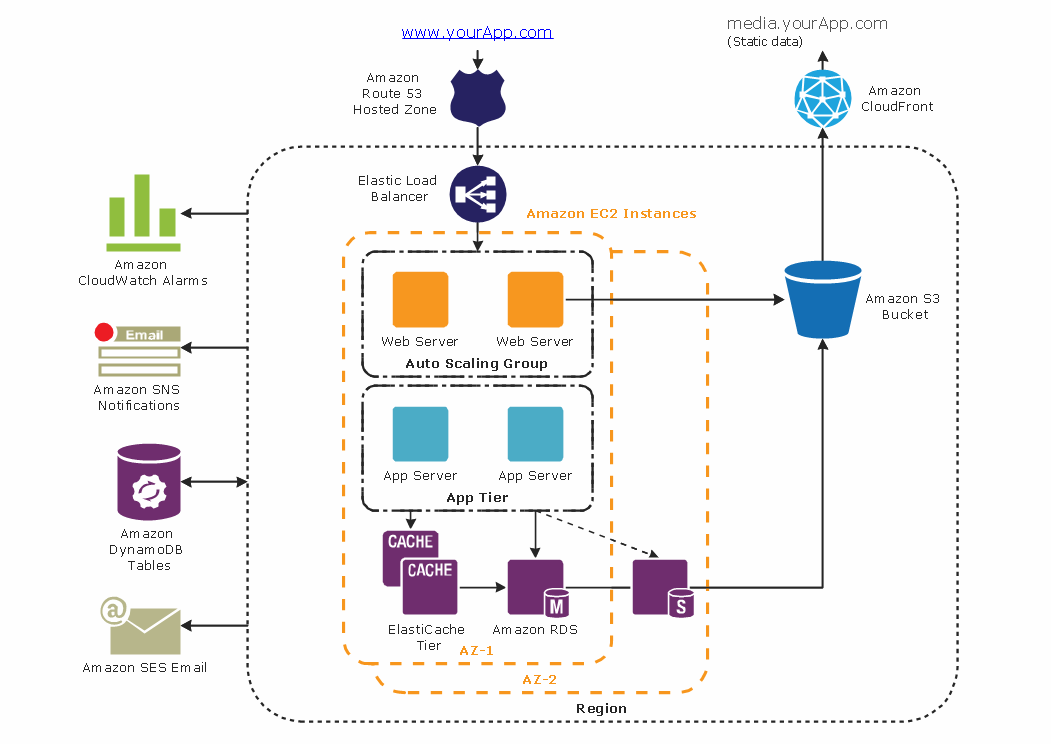
Picture: Diagramming tool - Amazon Web Servicesand Cloud Computing Diagrams
How to draw Telecommunications Network Diagram quick, easy and effective? ConceptDraw DIAGRAM offers the unique Telecommunication Network Diagrams Solution from the Computer and Networks Area which will help you.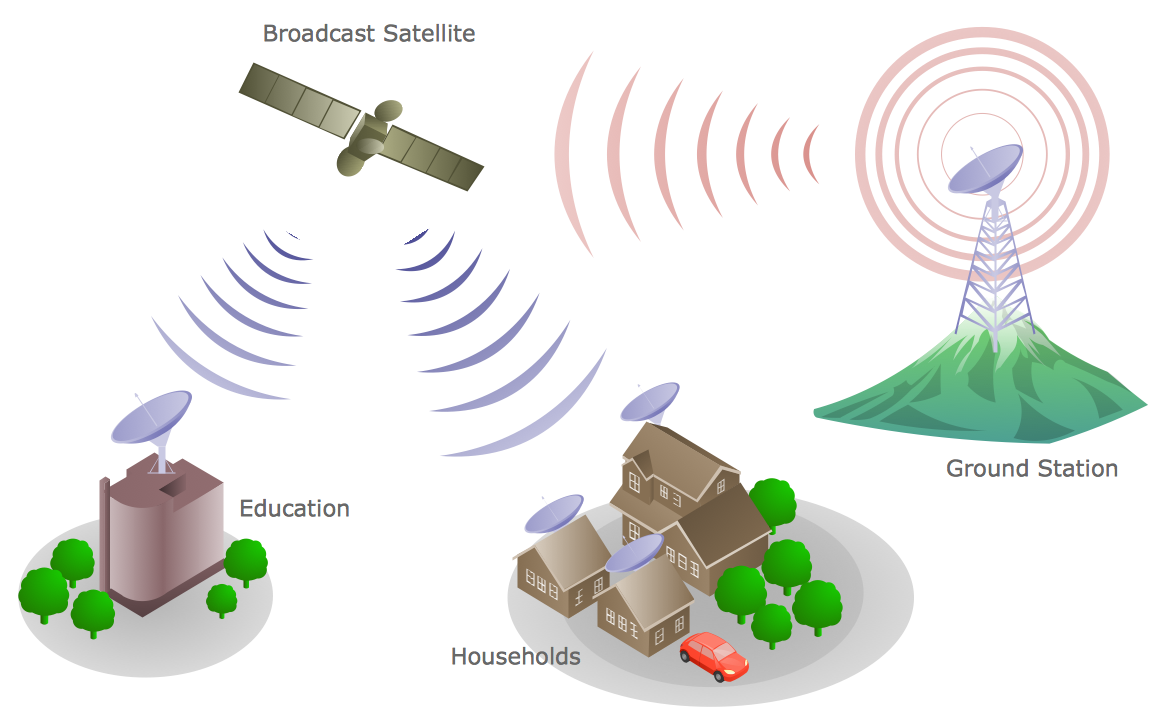
Picture: Telecommunications Network
Related Solution:
Electrical Engineering Solution used together with ConceptDraw DIAGRAM drawing facilities makes short a work of drawing various electrical and electronic circuit schemes. A library of vector objects composed from symbols of Analog and Digital Logic elements of electric circuit includes 40 symbolic images of logic gates, bistable switches of bi-stable electric current, circuit controllers, amplifiers, regulators, generators, etc. All of them can be applied in electronic circuit schemes for showing both analog and digital elements of the circuit.
Electrical Engineering Solution used together with ConceptDraw DIAGRAM drawing facilities makes short a work of drawing various electrical and electronic circuit schemes. A library of vector objects composed from symbols of Analog and Digital Logic elements of electric circuit includes 40 symbolic images of logic gates, bistable switches of bi-stable electric current, circuit controllers, amplifiers, regulators, generators, etc. All of them can be applied in electronic circuit schemes for showing both analog and digital elements of the circuit.
Picture:
Electrical Diagram Symbols F.A.Q.
How to Use Electrical ConceptDraw Diagram Software
Related Solution:
A visual representation of the configuration system, as well as the internal interfaces among such drawing’s CIs, may be always done with the help of the professional tool, such as the ConceptDraw DIAGRAM diagramming software. The structure diagram may be used for identifying the CIs as well as their associated artifacts. Doing it with the aid of ConceptDraw DIAGRAM as well as its extension (the Jackson Structured Programming (JSP) Diagrams solution) may simplify anyone’s work of making such diagrams.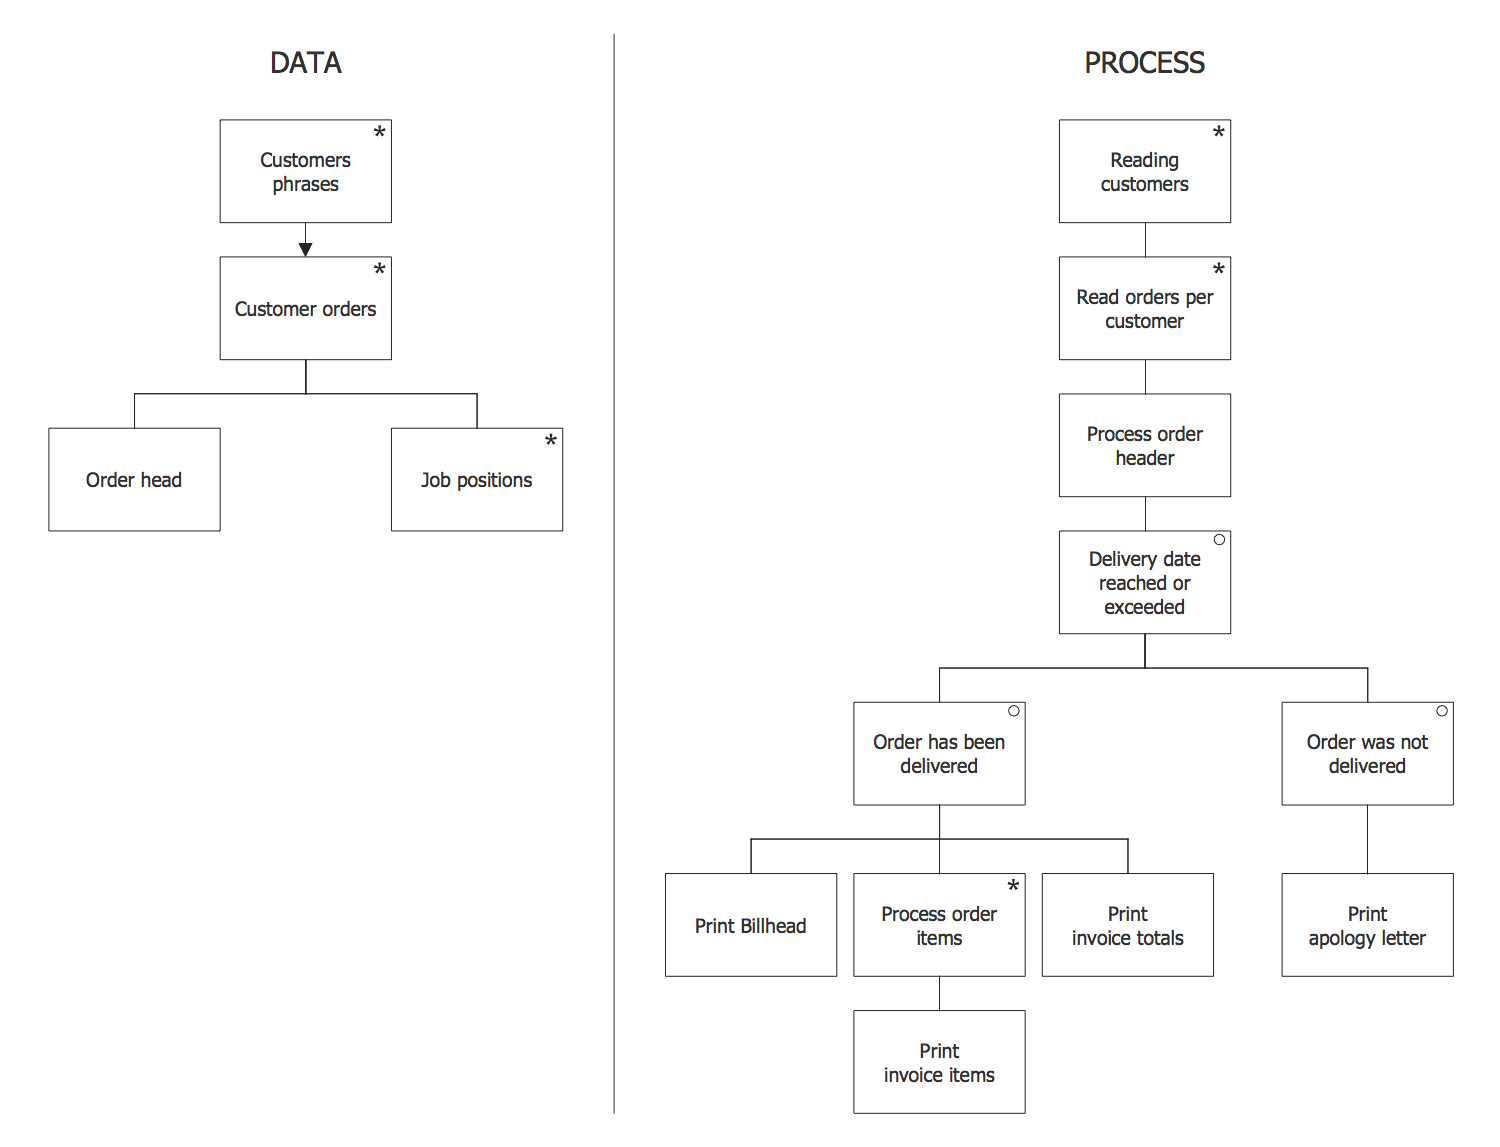
Picture: Program Structure Diagram
Related Solution:
The Audio & Video Connectors solution contains a set of pre-designed objects, libraries, templates, and samples; allowing quick and easy diagramming of various configurations of audio and video devices.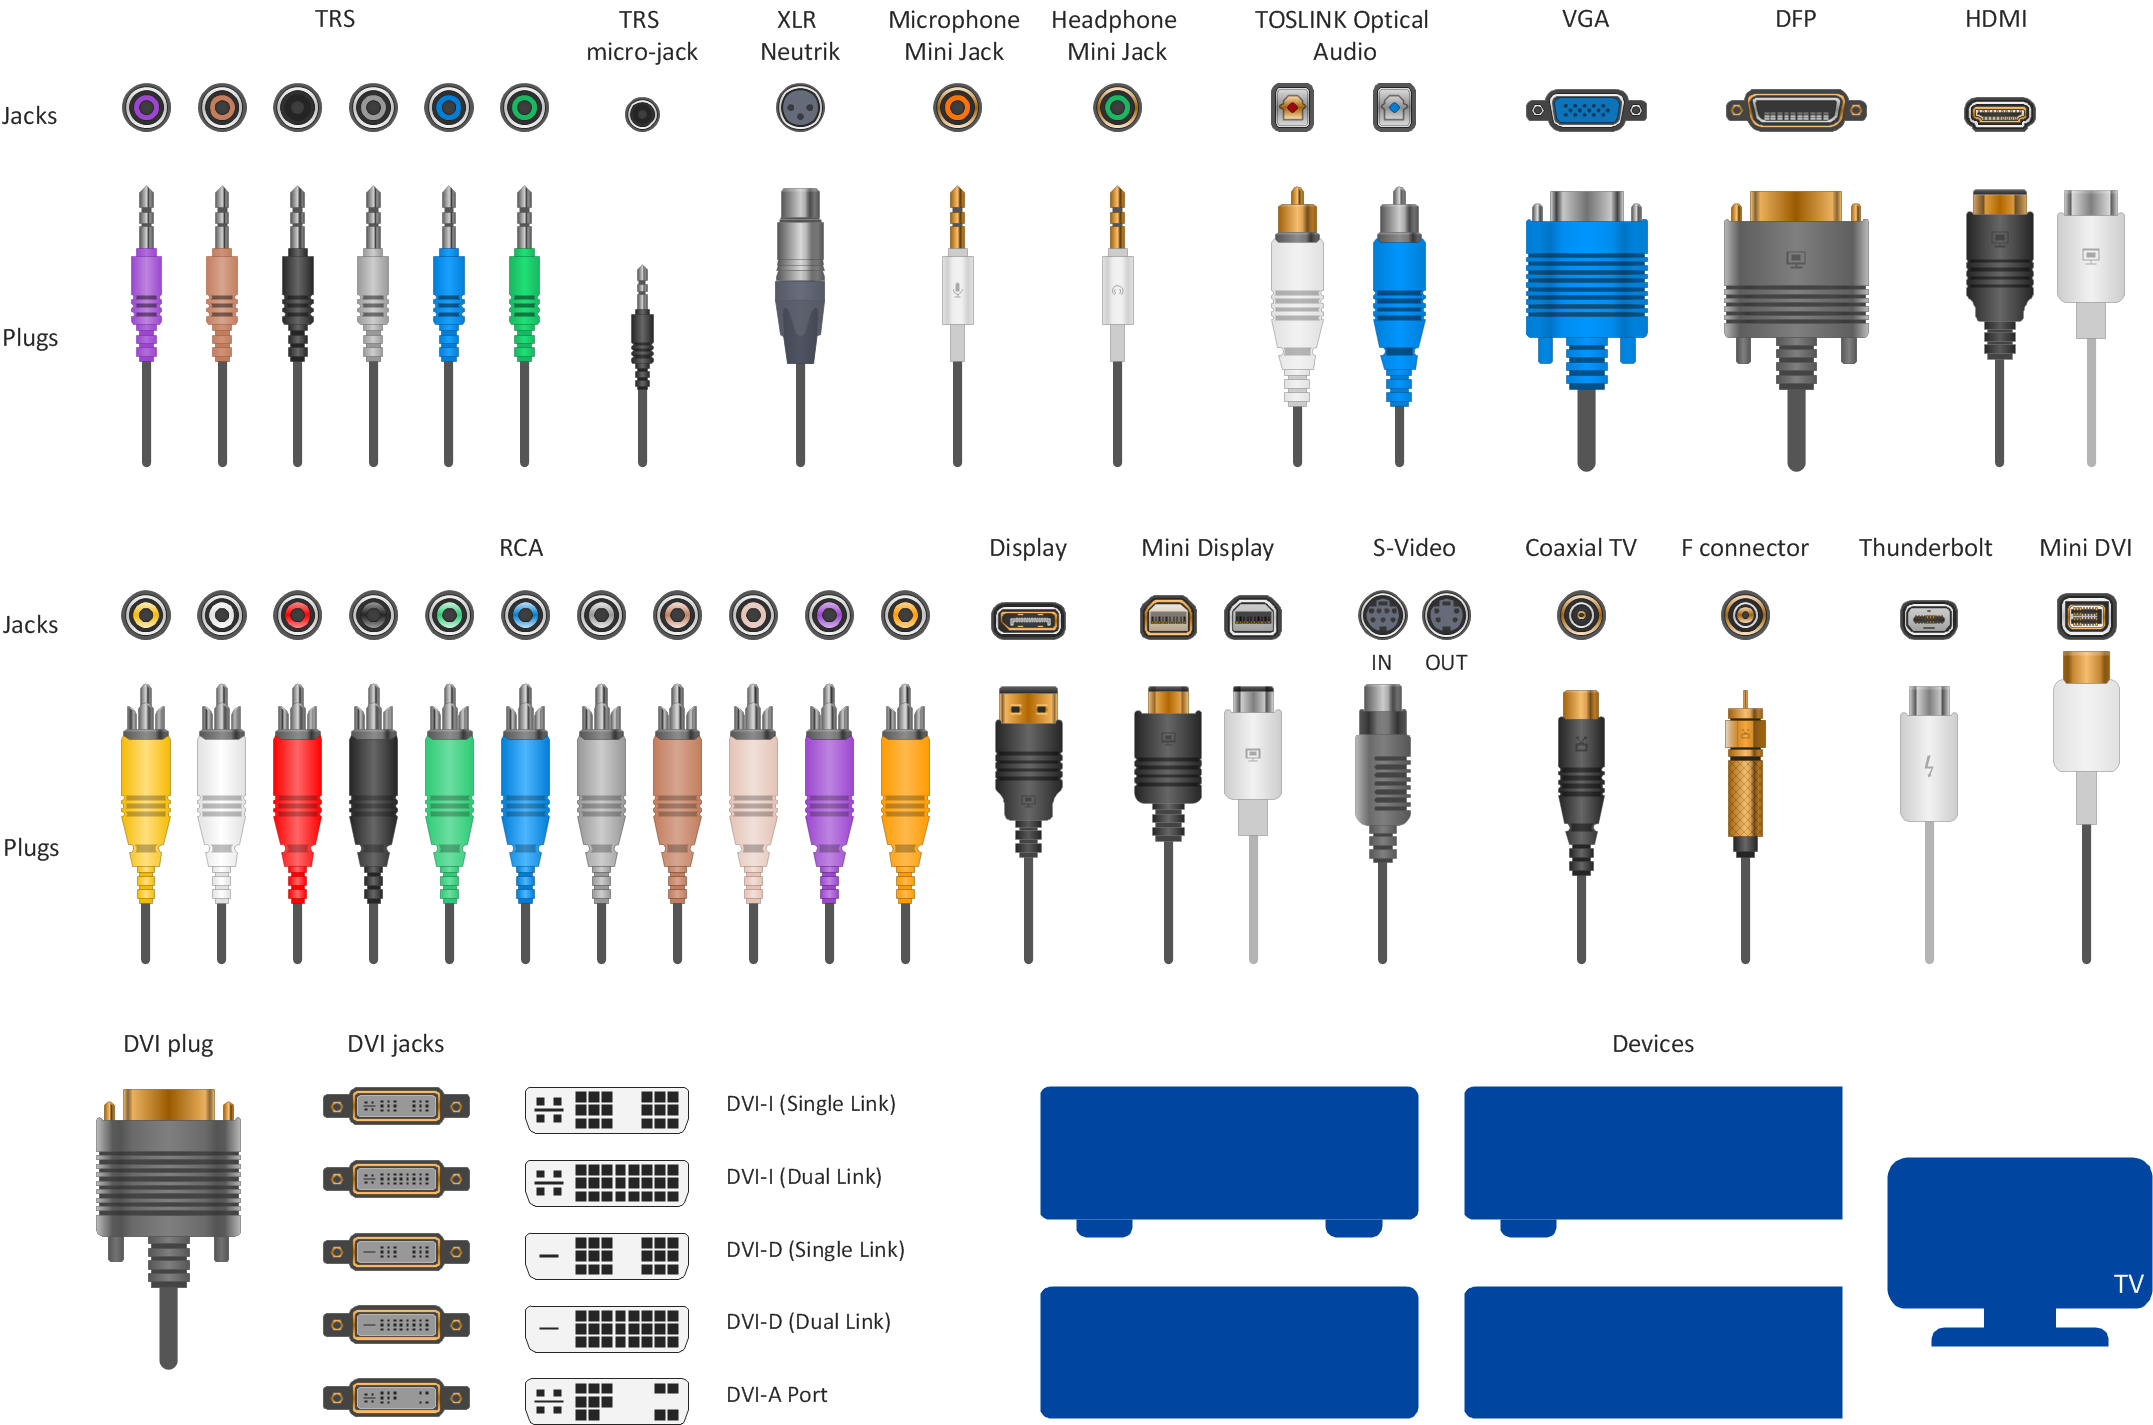
Picture: Audio Visual Connectors Types
Related Solution:
Any business process consists from a number of tasks carrying out the certain business goal. It is useful to diagram business processes to ensure that they are as foolproof, logical and sequential as possible. This business process diagram describes a typical booking process flow by the example of a cab booking process. It can be used as a roadmap for any booking system implementation. Diagramming a business process allows you to look at the entire project and take into account all types of possible scenarios. Business process diagram helps you investigate and clarify the process thoroughly so that you can find out how it can be improved. Business process diagram supports team communications by ensuring that each process element is clear and everyone in the team is on the same page.
Sometimes your company brings you less profit than you expect it to be, and it’s difficult to reveal the causes. Maybe it’s time to learn new technologies, because business diagram are easily developed by means of special software, so you won’t make any extra effort. In return, you will increase your productivity and get more done in a less time.
Picture: Business Diagram Software
Related Solutions:
How to design a Bubble Chart? It’s very easy! All that you need is a powerful software. Never before creation of a Bubble Chart wasn’t so easy as now with tools of Business Diagrams Solution from the Management Area for ConceptDraw Solution Park.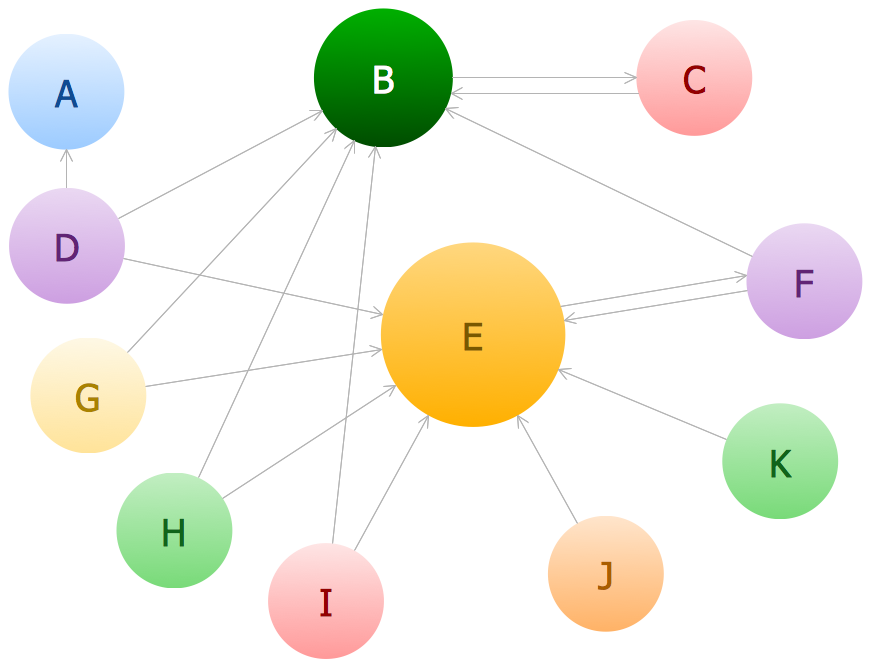
Picture: Bubble Chart
Related Solution:
Wireless network topology — logical topology.
Wireless network topology shows how the computers connect each other when there is no physical connection. The computers communicate each using the wireless devices.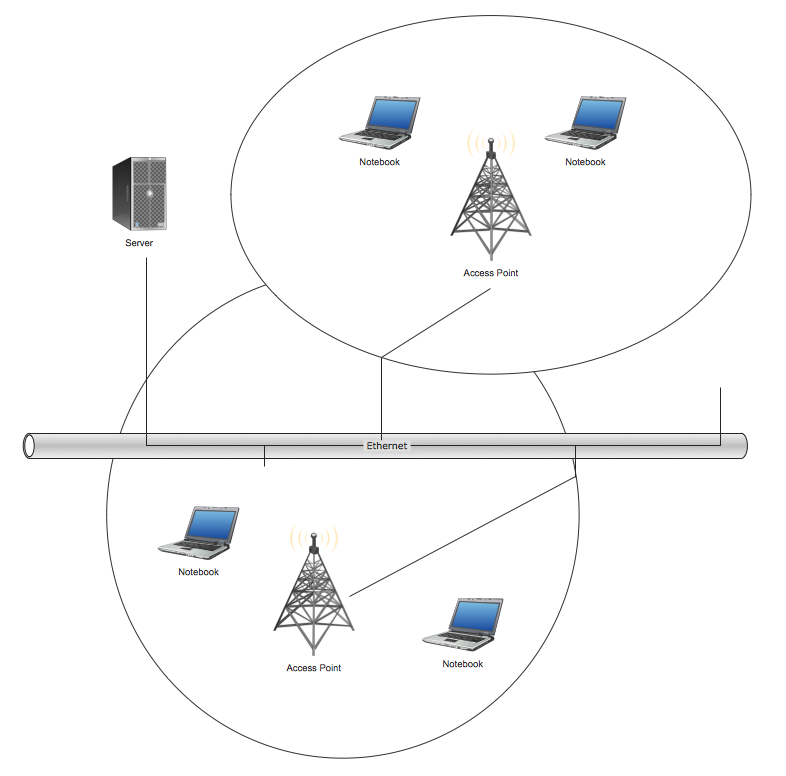
Picture: Wireless Network Topology
Related Solution:
The following examples cctv network were created in ConceptDraw DIAGRAM diagramming and vector drawing software using the Audio, Video, Media Solution. Using this easily customizable cctv network template you can represent any existing cctv network.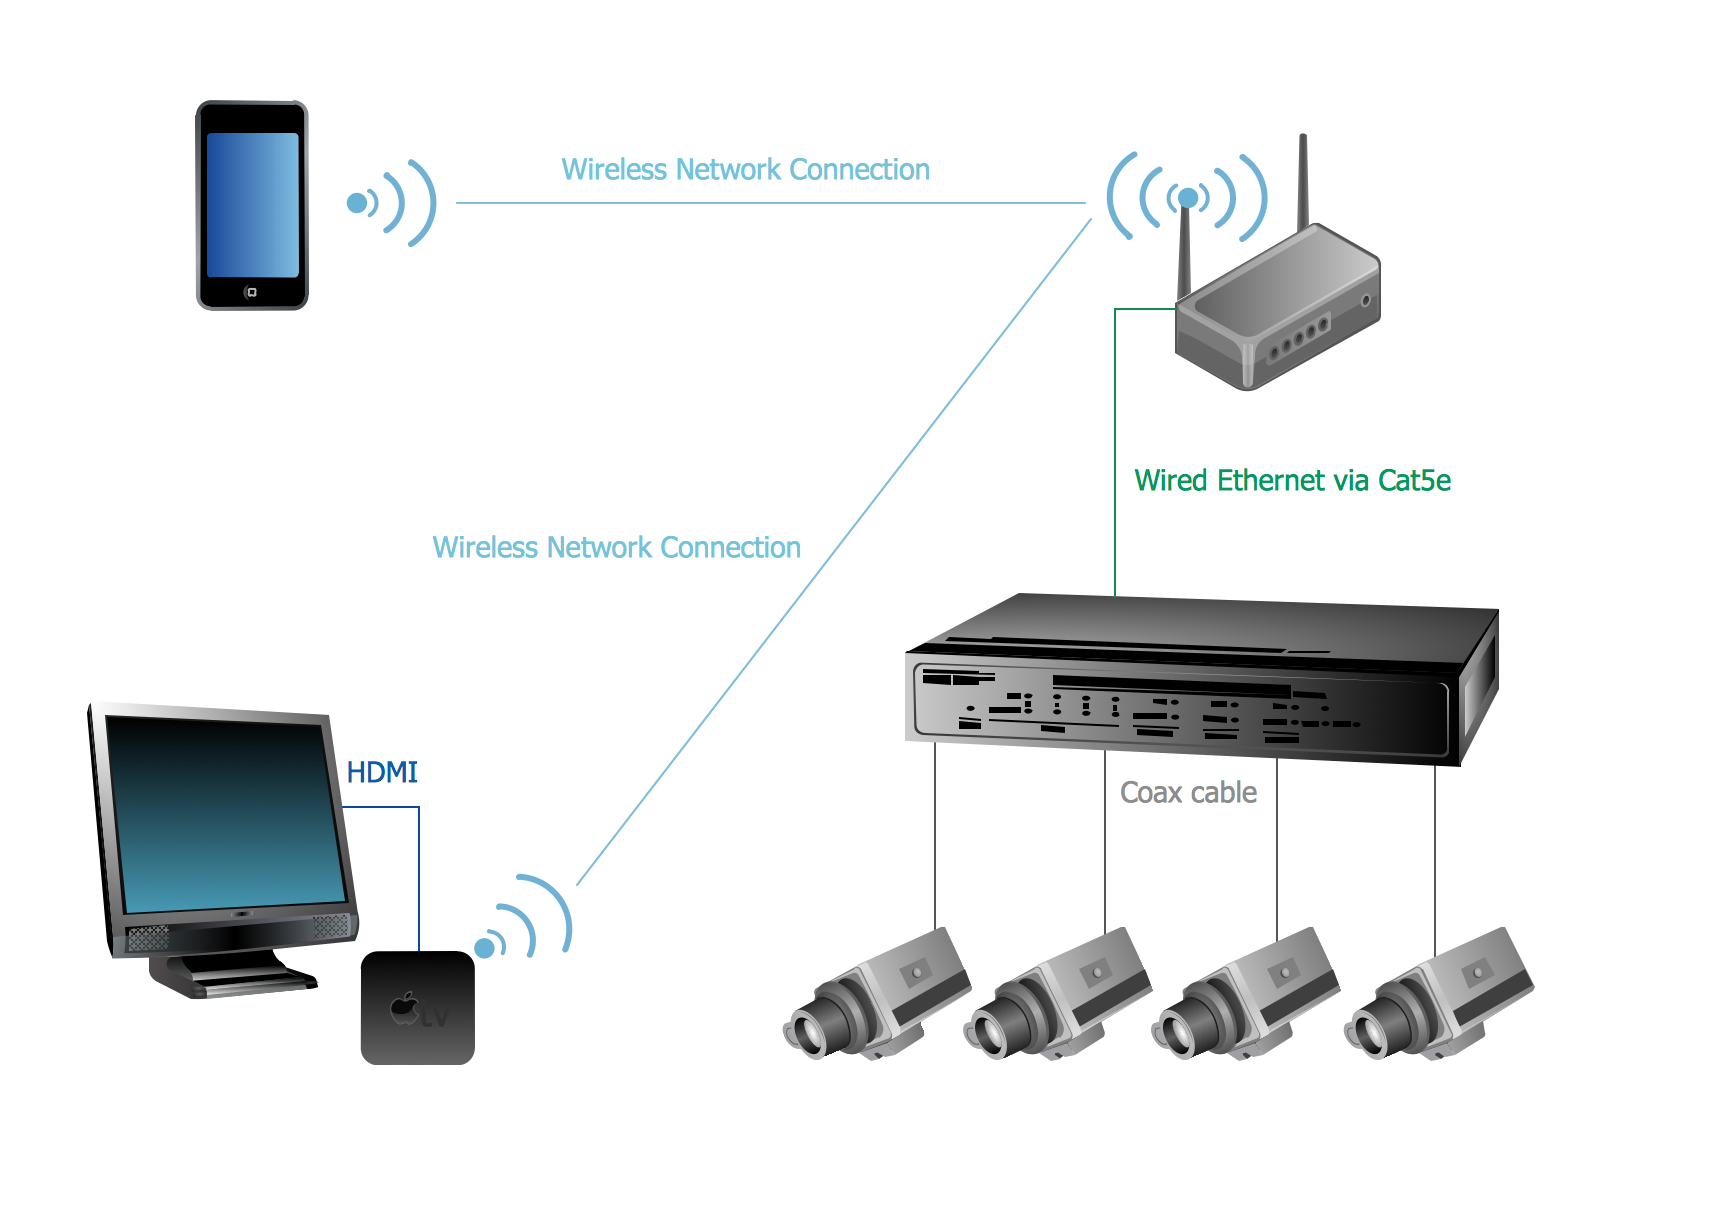
Picture: CCTV Network Example
Related Solutions: