Made with
ConceptDraw
PROJECT 15

Managing the task list


ConceptDraw PROJECT

Professional Dynamic Project Management

To work with Gantt Chart switch to Gantt Chart view first.
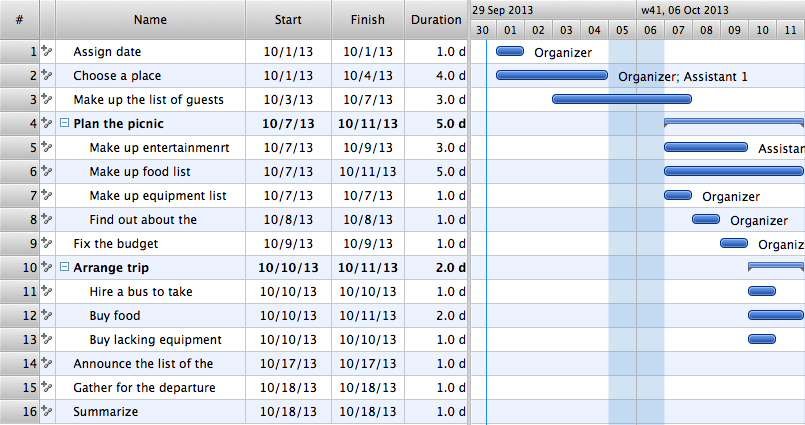
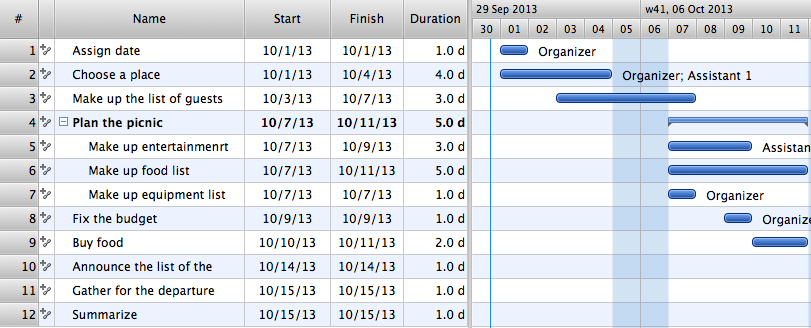
Gantt Chart view

Gantt Chart consists of two parts: the left part is the task list, the right one is their graphic representation. The field headings are in the upper part.

Gantt Chart view

The left part contains the following columns: Task Number, Task Name, Start Date, End Date, Duration, Percent Completed, and Total Cost. The right side displays tasks as graphic timelines. The length of time bars indicates task duration and their location on the calendar during their completion.

The width of columns is adjustable: set the cursor on the right margin of the column you’d like to adjust ( the cursor changes) and drag the column border (in the necessary direction) to where you need.

You can also adjust the width of the left/right side of the diagram.

Adding/deleting task/subtask

In this Lesson we will learn how to edit Gantt Chart. Let’s start task operations. You can operate selected tasks only. The bigger part of commands is available via menu, context menu and toolbar.

In this part we’ll find out how to add/delete tasks and subtasks. We first select a task, and then we make the necessary move by one of the following:

To add task:

  • Use Insert New Task in menu Tasks.
  • Use Insert Task in the context menu.
  • Use Insert Task button New Task on the toolbar Task.

Note: when added the new task will appear before the selected one.

To add task at the end of the task-list:

  • Use Add Task in menu Tasks.
  • Use Add Task in the context menu.

To add subtask:

  • Use Add New Subtask in menu Tasks.
  • Use Add New Subtask in the context menu.
  • Use Add New Subtask button on the toolbar Task.

Note: the repeated tasks can be copied and then pasted to the needed place. For this use Copy / Paste in menu Edit. To copy all the tasks, for their quick selection simultaneously use Select All in menu Edit.

To delete task:

  • Use Delete Task(s) in menu Tasks.
  • Use Delete Task in the context menu.
  • Use Delete Task button on the toolbar Task.

Task: Let’s add task "Arrange the trip" to our example. Select "Buy food" and add a new task. Activate edit mode by double-clicking and enter the name of the new task.

Note: before saving the document it’s necessary to quit the edit mode or the name of the task edited will not be saved.

Then add more subtasks to the given task: "Hire a bus to take people there and back", "Buy food" and "Buy lacking equipment".

We’ll also add subtask "Find out about the equipment on hand and the equipment to buy" to the end of the task "Plan the picnic". For this, select "Plan the picnic" and use Add Subtask.

And finally, delete the unnecessary "Buy Food" task.

Buy Food task

Moving task up/down. Changing task hierarchy

If you are not satisfied with the order tasks are arranged in, it then can be changed.
Select a task and use one of the three following methods:

  • In menu Tasks choose Move Up or Move Down.
  • Call the context menu and use Move Up or Move Down.
  • On the toolbar Task use Task Up and Task Down buttons .
  • Use Cut, and then Paste in menu Edit.

Task: In our example change places for the tasks "Make up the list of participants" and "Choose a place". Select "Make up the list of participants" and move it up or select "Choose a place" and move it down.

Changing task hierarchy can be done by one of the following (select a task first):

To make task a subtask:

  • Use Indent in menu Tasks.
  • Call the context menu and use Indent.
  • Use Indent Task button on the toolbar Task.

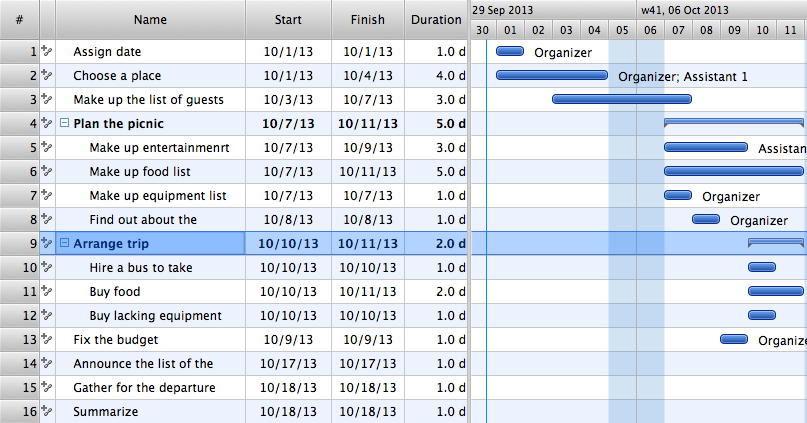
To make subtask a task:

  • Use Outdent in menu Tasks.
  • Call the context menu and use Outdent.
  • Use Outdent Task button on the toolbar Task.

Task: In our example let’s change task "Fix the budget" into subtask "Arrange the trip".

Changing task hierarchy

Showing/hiding subtasks

If the Gantt Chart is too long or if it contains several similar tasks with subtasks, such a task can be shown folded up, i.e. with subtasks hidden. If necessary they can be shown again.

To hide all subtasks use one of the following:

  • Choose Hide subtasks in menu Tasks.
  • Call the context menu and choose Hide subtasks.
  • Use the Hide Subtasks button on the toolbar Tasks. Hide All Subtasks button allows to hide all the subtasks at the same time.

To show subtasks use one of the following:

  • Choose Show subtasks in menu Tasks.
  • Call the context menu and use Show subtasks.
  • Use Show Subtasks buttons on the toolbar Tasks. Show All Subtasks button allows to show all the subtasks at the same time.

Task: In our example let’s try to hide and show subtasks to the tasks "Plan the picnic" and "Arrange the trip".

Managing the task list *

TEN RELATED HOW TO's:
Bubble diagrams solution extends ConceptDraw DIAGRAM software with templates, Using ConceptDraw Connectors, you can create a bubble chart in moments. Using ConceptDraw you will be able to create a bubble chart from the ready ConceptDraw library objects or make your own objects. The created diagram can represent ideas organization, in brainstorming processes, by teachers for explaining difficult ideas or for presentations.How To Create a Bubble Chart *
Picture: How To Create a Bubble Chart
Related Solution:
This sample shows the Strategic Plan of the Broadband Lifecycle that was developed by Strategic Networks Group. The Broadband Lifecycle represents the advance of the broadband investments.Successful Strategic Plan *
Picture: Successful Strategic Plan
There are three main types of organizational structures which can be adopted by organizations depending on their objectives: functional structure, divisional structure, matrix structure. ConceptDraw DIAGRAM diagramming and vector drawing software enhanced with 25 Typical Orgcharts solution from the Management area of ConceptDraw Solution Park is ideal for designing diagrams and charts of any organizational structure types.Organizational Structure Types *
Picture: Organizational Structure Types
Related Solution:
Developing a software project supposes architecture first. To make it proper, you can use data flow diagram model in your current project. The data flow diagram represents the Model of small traditional production enterprise that is made using Yourdon and Coad notation. It shows how the data is transfered through a process. According to the notation of Yourdon and Coad a process is represented by circles and data stores are drawn using parallel lines. This DFD was created using the ConceptDraw Data Flow Diagrams solution. Using this solution one can visualize data flow accordingly to the rules of two basic notations used for data flow modeling.Data Flow Diagram Model *
Picture: Data Flow Diagram Model
Related Solution:
This sample was created in ConceptDraw DIAGRAM diagramming and vector drawing software using the Flowcharts solution from the Diagrams area of ConceptDraw Solution Park. This sample shows the Flowchart of the Subprime Mortgage Crisis. This Flowchart describes the decline in housing prices when the housing bubble burst and what it caused on the housing and financial markets. You can also see the Government and Industry responses in this crisis situation.Flowchart on Bank. <br>Flowchart Examples *
Picture: Flowchart on Bank. Flowchart Examples
Related Solution:
Cause and Effect Analysis - The Seven Management and Planning Tools is a tool for Cause and Effect Analysis that allows users to analyze the root causes for factors that influenced the problem. This diagram is constructed separately for each highly prioritized factor. The Diagram is then used for further formulation of potential actions.Cause and Effect Analysis *
Picture: Cause and Effect Analysis
Create professional business process diagrams using ConceptDraw Activities library with 34 objects from BPMN.Business Process Elements: Activities
Picture: Business Process Model and Notation Elements: Activities
There are many tools to manage a process or to illustrate an algorithm or a workflow. Flowcharting is one of those tools. However, it may be difficult to show complex processes that require multiple attributes or several people in a simple flowchart, so a cross-functional flowchart would be a solution for that situation. To create such flowchart, group processes and steps to labeled rows or columns, and divide those groups with horizontal or vertical parallel lines. It is worth mentioning that there are different types of cross-functional flowcharts, like opportunity or deployment flowchart. This diagram shows a cross-functional flowchart that was made for a trading process. It contains 14 processes, distributed through 5 lines depicting the participants who interact with the process. Also there are connectors that show the data flow of information between processes. The cross-functional flowchart displays a detailed model of the trading process, as well as all participants in the process and how they interact with each other. The lines in the flowchart indicates the position, department and role of the trading process participants.Cross-Functional Flowchart
Picture: Cross-Functional Flowchart
Related Solution:
Flow chart is a diagrammatic representation of an algorithm and essential part of planning the system. Flow charts are widely used in technical analysis and programming for easy writing programs and explaining them to others. So, one of the most popular type of flow charts is Technical Flow Chart. Technical Flow Chart can be drawn by pencil on the paper, but it will be easier to use for designing a special software. ConceptDraw DIAGRAM diagramming and vector drawing software extended with Flowcharts Solution from the Diagrams Area of ConceptDraw Solution Park will be useful for this goal.Technical Flow Chart *
Picture: Technical Flow Chart
Related Solution:
New Smart connectors in ConceptDraw DIAGRAM now have an auto-routing feature. This means that connectors always find the optimal route between objects and automatically recalculate that path when moving these objects. You don't have to think about your connectors, they think for you.ConceptDraw Arrows10 Technology *
Picture: ConceptDraw Arrows10 Technology
ConceptDraw
PROJECT 15