
Example 1. PERT Chart Software
Seven Management and Planning Tools solution from the Management area of ConceptDraw Solution Park provides templates, samples and ready-to-use vector stencils that can help you draw the PERT chart in a few moments.

Example 2. PERT Chart Example
The PERT Charts produced with ConceptDraw DIAGRAM are vector graphic documents and are available for reviewing, modifying, and converting to a variety of formats (image, HTML, PDF file, MS PowerPoint Presentation, Adobe Flash or MS Visio).
TEN RELATED HOW TO's:
ER-modeling nowadays is a very popular approach for database design. If you are tired of looking for a good entity relationship diagram Software for Mac, then your search is almost over. ConceptDraw DIAGRAM is a great tool for creating diagrams of any complexity with tons of editable samples and templates.
This diagram represents the vector library of the Chen’s and Crow’s Foot notation icons for drawing ERD (entity-relationships diagram). ConceptDraw Entity Relationship Diagram solution delivers the ability to visualize databases structure on both Mac and PC. The "bricks" entity-relationships models are the entity, and the relation. An entity is represented by a rectangle comprising the entity name. It means an object, information about which should be available and stored. A relation is intended to show a relations between two entities. There are several types of relations between entities. To show there are a number of different symbols for the types of relationships.
Picture: Entity Relationship Diagram Software for Mac
Related Solution:
ConceptDraw DIAGRAM diagramming and vector drawing software extended with Bar Graphs solution from the Graphs and Charts area of ConceptDraw Solution Park is ideal for drawing the Bar Charts fast and simply.
Picture: Bar Charts
Related Solution:
ConceptDraw DIAGRAM diagramming and vector drawing software is the best choice for making professional looking Emergency Plan template, examples and samples. ConceptDraw DIAGRAM provides Fire and Emergency Plans solution from the Building Plans Area of ConceptDraw Solution Park.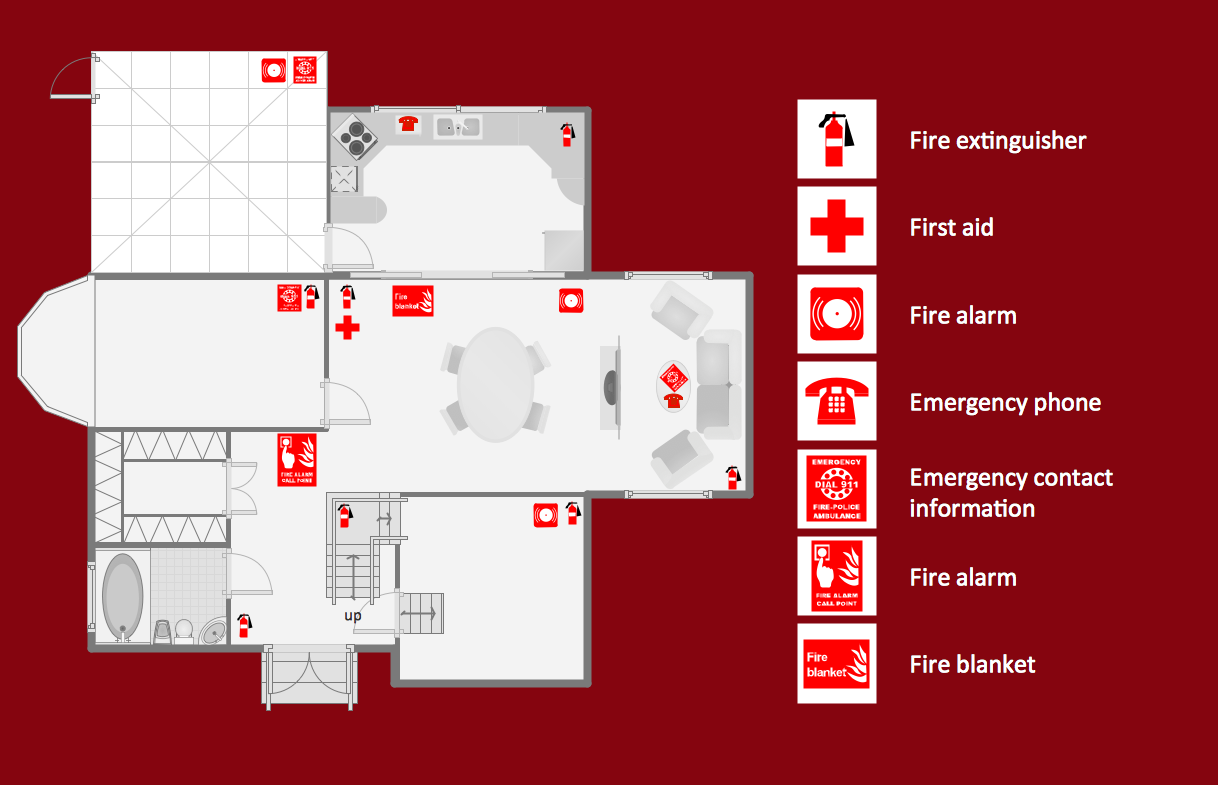
Picture: Emergency Plan Template
Related Solution:
AWS platform is great to develop reliable applications. If you are already aware of all the benefits that Amazon Web Services diagrams bring, then you'll need also a diagramming tool for architecture to share your vision. Luckily, ConceptDraw DIAGRAM has a special AWS Diagrams solution with vector icons and templates that are easy to edit.
The AWS architecture diagram, you see on this drawing, was designed using ConceptDraw Amazon Web Services Architecture Diagrams (AWS) solution. The 14 libraries, delivered with this solution introduces near 250 vector graphic images used to draw AWS Diagrams. The AWS Architecture Diagrams solution is a valuable tool for programmers, software architects and other IT professionals. It enables them to develop reliable applications with a high stage of interaction with AWS cloud.
Picture: Amazon Web Services Diagrams diagramming tool for architecture
Any project is a complex system which rarely goes without some problems, even the most minor. But the success of the project mostly depends from the ability effectively solve appearing problems. There are many methods for problem solving, one of the most effective is the use a Fishbone diagram to attack complex problems.
Use ConceptDraw DIAGRAM diagramming software with Fishbone Diagrams Solution to attack any complex problems with fishbone diagrams graphic method. Construct Fishbone diagram to help users brainstorm and break down a complex problem.
Picture: Use a Fishbone Diagram to Attack Complex Problems
Related Solution:
Business Process Modeling Notation (BPMN) is a set of standard symbols that allow you to create a graphical view of a business process. The symbols were developed to help users develop standard, unified structure of processes, and any messages shared between these processes.
Picture: How to Draw Business Process Diagrams with RapidDraw Interface
This sample was created in ConceptDraw DIAGRAM diagramming and vector drawing software using the Pie Charts Solution from Graphs and Charts area of ConceptDraw Solution Park.
This sample shows the Pie Chart of the approximate air composition. You can see the percentage of oxygen, nitrogen and other gases in the air visualized on this Pie Chart.
Picture: Percentage Pie Chart. Pie Chart Examples
Related Solution:
This sample shows the Business Report Pie Chart. The Pie Chart visualizes the data as the proportional parts of a whole, illustrates the numerical proportion. Pie Charts are very useful in the business, statistics, analytics, mass media.
Picture: Business Report Pie. Pie Chart Examples
Related Solution:
There are many tools to manage a process or to illustrate an algorithm or a workflow. Flowcharting is one of those tools. However, it may be difficult to show complex processes that require multiple attributes or several people in a simple flowchart, so a cross-functional flowchart would be a solution for that situation. To create such flowchart, group processes and steps to labeled rows or columns, and divide those groups with horizontal or vertical parallel lines. It is worth mentioning that there are different types of cross-functional flowcharts, like opportunity or deployment flowchart.
This diagram shows a cross-functional flowchart that was made for a trading process. It contains 14 processes, distributed through 5 lines depicting the participants who interact with the process. Also there are connectors that show the data flow of information between processes. The cross-functional flowchart displays a detailed model of the trading process, as well as all participants in the process and how they interact with each other. The lines in the flowchart indicates the position, department and role of the trading process participants.
Picture: Cross-Functional Flowchart
Related Solution:
The Value Stream Mapping solution found in the ConceptDraw Solution Park continues to extend the range of ConceptDraw DIAGRAM into a business graphics tool that can be used to document processes in any organization.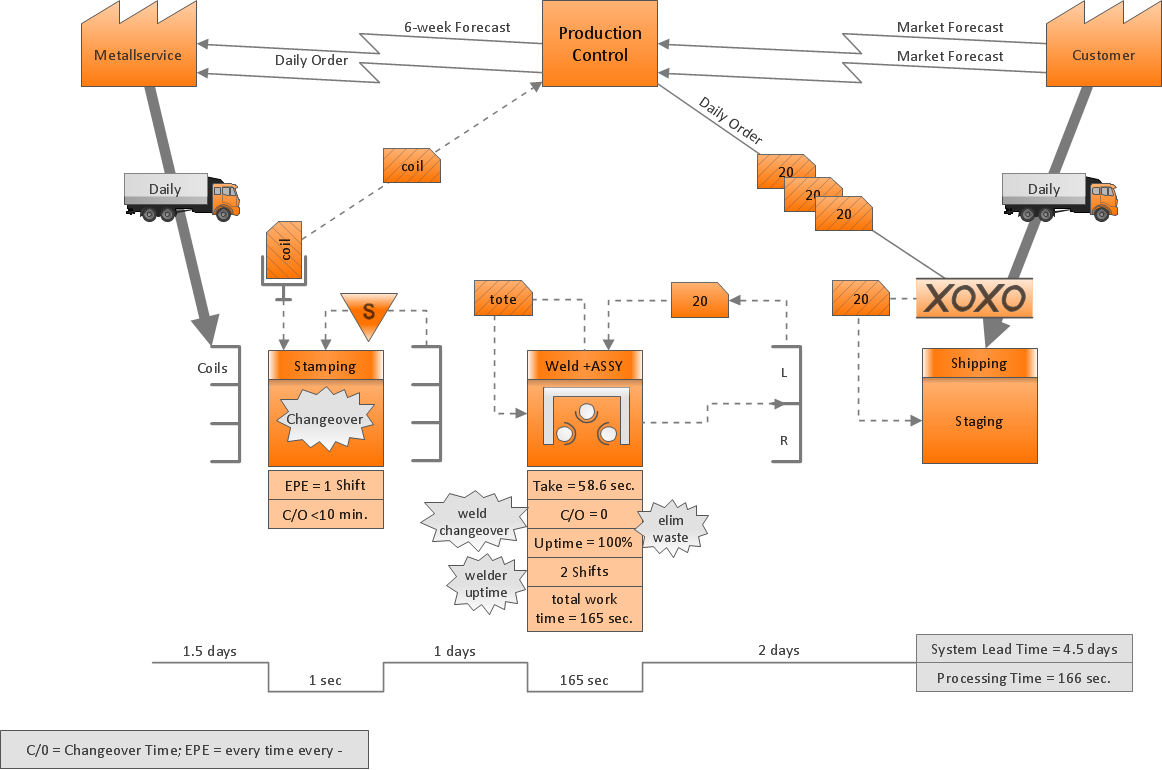
Picture: Value Stream Management
Related Solution: