Made with
ConceptDraw
DIAGRAM 18

Rack Rate

The Rack Diagram visualizes in details the rack mounting of computer and network equipment, so it allows to show what equipment and racks are needed to buy, allows to estimate the rack rate and also helps to organize equipment on the racks virtually, without the real installation.

To facilitate the rack diagrams designing, ConceptDraw DIAGRAM diagramming and vector drawing software was extended with Rack Diagrams Solution from the Computer and Networks Area.

Rack Rate *

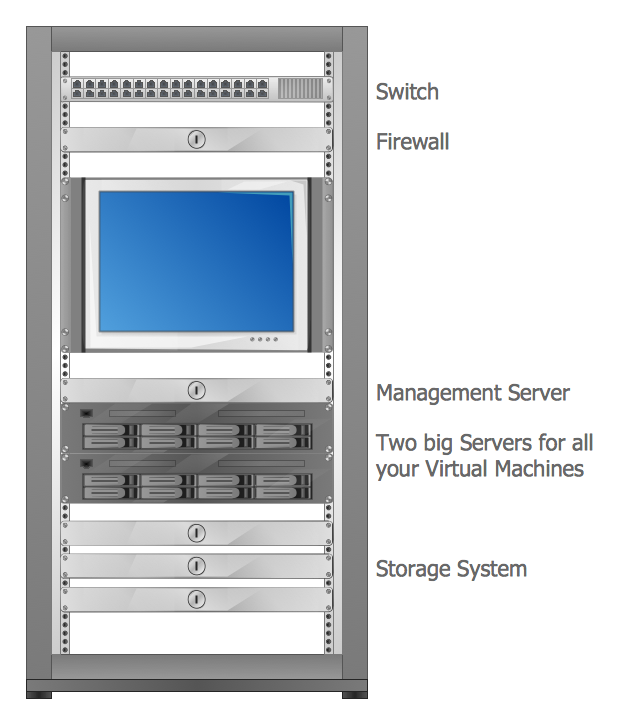
Example 1. Rack Rate - Virtualized Computer Center

First of all the Rack Diagrams Solution includes collection of predesigned templates and samples of various rack diagrams which is offered in ConceptDraw STORE. You can choose any of them which meets your requirements and change it for your needs.

Rack Diagrams Solution in ConceptDraw STORE

Example 2. Rack Diagrams Solution in ConceptDraw STORE

Any template or sample can be changed using the vector shapes from the Rack Diagrams library included in the Rack Diagrams Solution. It's the fastest way of the rack rate diagrams designing. Or you can create your own rack diagram at new document.

Rack Rate - Typical Server Rack Diagram

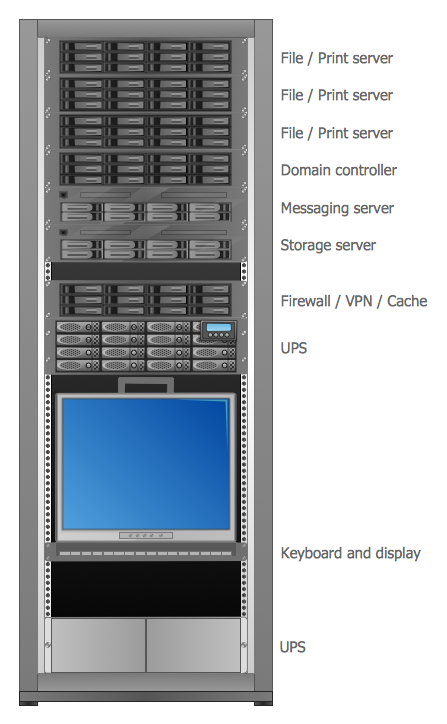
Example 3. Rack Rate - Typical Server Rack Diagram

The samples you see on this page were created in ConceptDraw DIAGRAM using the Rack Diagrams Solution for ConceptDraw DIAGRAM Solution Park. These rack rate diagrams successfully demonstrate solution's capabilities and professional results you can achieve. An experienced user spent 5-10 minutes creating every of these samples.

Use the Rack Diagrams Solution for ConceptDraw DIAGRAM software to create your own professional looking rack diagrams quick, easy and effective.

All source documents are vector graphic documents. They are available for reviewing, modifying, or converting to a variety of formats (PDF file, MS PowerPoint, MS Visio, and many other graphic formats) from the ConceptDraw STORE. The Rack Diagrams Solution is available for all ConceptDraw DIAGRAM or later users.


FIVE RELATED HOW TO's:
ConceptDraw PROJECT’s powerful reporting engine lets you generate a set of tabular reports with just one click, or visualize your project as Radial Tasks Structures, Work Breakdown Structures and Resource Calendars. It also provides you with dynamic Project Dashboards.How to Report Task
Picture: How to Report Task's Execution with Gantt Chart
Creating a detailed network plan can cause a lot of headache to an unexperienced user. And it is worth mentioning that ConceptDraw DIAGRAM is a decent tool for creating a network diagram, a tool that is easy-to-use. To get an accurate diagram use the vector shapes from the special libraries that represent workstations, network appliances, wiring systems and connect them with smart-connectors, just as simple as that. This communication network diagram displays the way different components of a computer network communicate with each other. When representing network information, such as depicting all the equipment in a large network, it is helpful to make visual representation. Network diagram provides an easy way to show the way the connections between an equipment in a large network. This diagram of a communication network depicts a network composed of three sub-networks. It uses a network equipment symbols to represent the different devices that make up a network communication including routers, Ethernet devices and end-point equipment.ConceptDraw DIAGRAM <br> Network Diagram Tool *
Picture: ConceptDraw DIAGRAM Network Diagram Tool
Related Solution:
The Critical Path Method (CPM) is an algorithm for scheduling a set of project activities. It is an important tool for effective project management. ConceptDraw PROJECT implements this method to provide the user with a wide set of project management tools.Critical Path Method in ConceptDraw PROJECT *
Picture: Critical Path Method in ConceptDraw PROJECT
Related Solution:
Working with information can be quite tedious, furthermore, some data can be quite difficult to perceive without any graphic representation. So, to facilitate your work, you can use business diagrams, such as simple flowcharts or Gantt charts for project management and orgcharts for clarifying your company structure. You can use a proper software, like ConceptDraw Pro, draw them on paper, or use whiteboards, but it is more convenient to use a digital tool. This diagram shows a cross-functional flowchart that was made fore telecom service provider. A workflow of a common telecommunication service provider has a rather branched structure. Thus, it is useful to have a flow chart to visualize the sequences and interrelations of the work flow steps. Business process flowchart contains 17 processes and 4 decision points,that are distributed through 2 lines depicting the participants involved. Also there are connectors that show the data flow within processes. This flowchart displays a detailed model of the telecom service trading process, as well as all participants in the process and how they interact with each other.Business diagrams & Org Charts with ConceptDraw DIAGRAM  *
Picture: Business diagrams & Org Charts with ConceptDraw DIAGRAM
Cisco switches and hubs deliver the best performance, and often used as network solutions for small businesses, enterprises, data centers. Cisco switches are the core interconnect devices of each computer network. The numerous Cisco switches specifically designed for various applications. Network switches are separated for two types: fixed configuration and modular switches. The fixed configuration switches deprecate swapping or adding another module, and vice versa for modular switch.Cisco Switches and Hubs. Cisco icons, shapes, stencils and symbols
Picture: Cisco Switches and Hubs. Cisco icons, shapes, stencils and symbols
Related Solution:
ConceptDraw
DIAGRAM 18