EPC for Business Process Implementation
Event-driven Process Chain
The Event-driven Process Chain (EPC) Diagrams allows managers visually present process models for they business implementation. The EPC diagram shows various business processes in terms of work flows.
ConceptDraw DIAGRAM includes tools that are specifically designed to facilitate the process of depicting business processes.
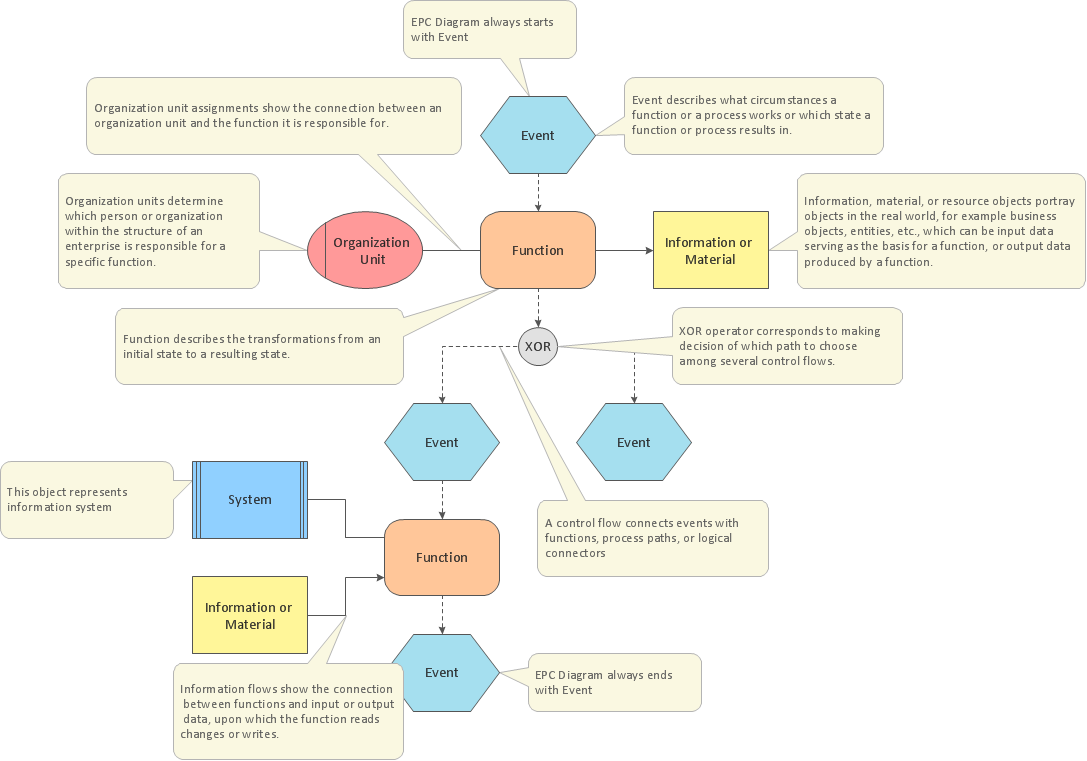
Pic.1 EPC diagram template.
The Event-driven Process Chain Diagrams solution extends ConceptDraw DIAGRAM software with EPC templates, samples, and vector shape library for the drawing of EPC diagrams.
The Event-driven Chain Diagrams solution assists in the planning of resources and improves business processes using EPC flowcharts.
TEN RELATED HOW TO's:
To design a good workflow you have to focus on process analysis, not using the a drawing tool. This is more possible with ConceptDraw DIAGRAM software that brings the most natural drawing manner you have ever tried. First, define steps and procedures using simple rectangle shape, then select all shapes and click the Chain button to connect all shapes just in one click. After that you are able to modify some relations if needed.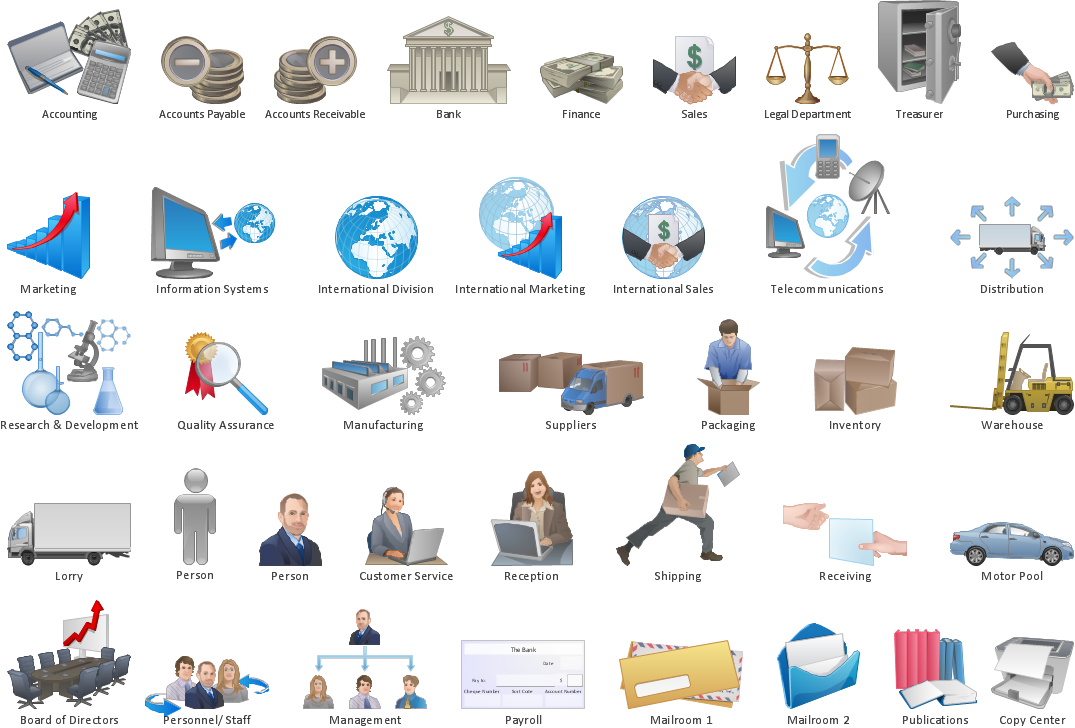
Picture: How to Design a Good Workflow
Related Solution:
There are numerous articles about the advantages of flowcharting, creating business graphics and developing different charts. Nevertheless, these articles are almost useless without the main component - the examples of flowcharts, org charts and without a fine example, it is difficult to get all the conveniences of creating diagrams. You can find tons of templates and vivid examples on Solution Park.
This illustration shows a variety of business diagrams that can be created using ConceptDraw DIAGRAM. It comprises a different fields of business activities: management, marketing, networking, software and database development along with design of infographics and business illustrations. ConceptDraw DIAGRAM provides a huge set of sample drawings including business process modeling diagrams,, network diagrams, UML diagrams, orgcharts, DFD, flowcharts, ERD, geographical maps and more.
Picture: Examples of Flowcharts, Org Charts and More
Related Solution:
Event-Driven Process Chain Diagrams for improvement throughout an organisation.
ConceptDraw DIAGRAM - software that reduces the time needed to create a business process model.
Picture: Beauty of Event-driven Process Chain (EPC) diagrams
Related Solution:
EPC or The Event - driven Process Chain diagrams that provide Enterprise Resource Planning improvement.
ConceptDraw DIAGRAM - software that reduces the time needed to create a business process model.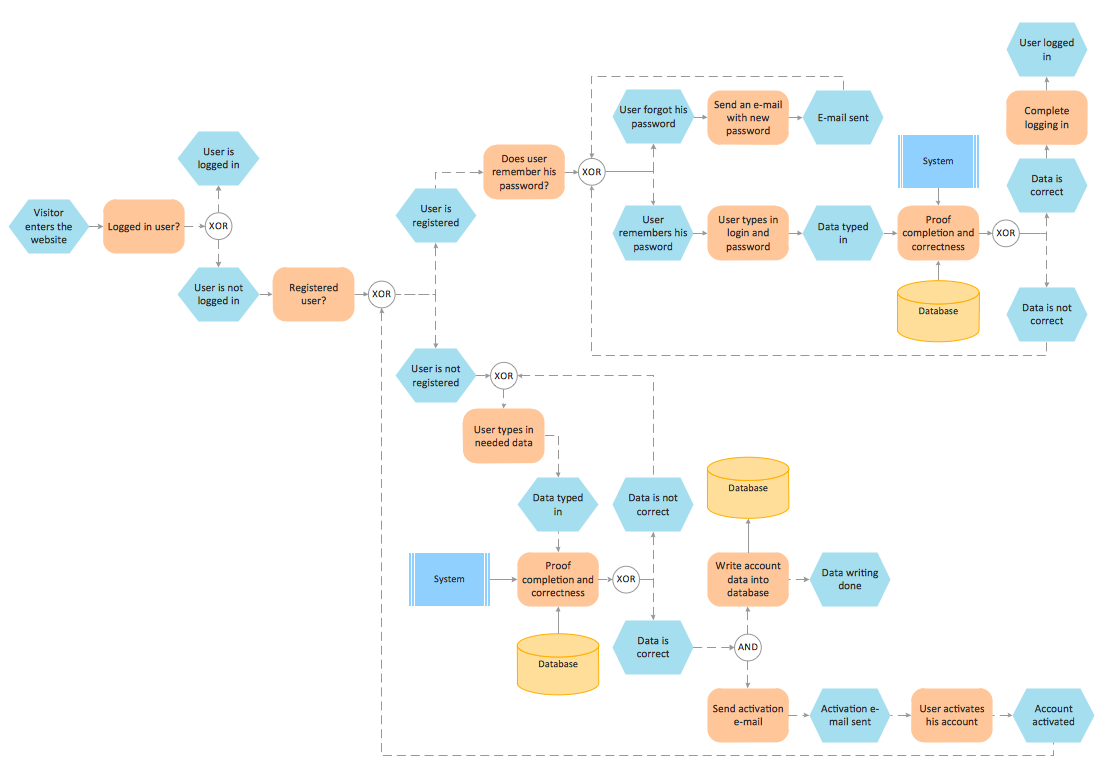
Picture: Formalization and Verification of Event-driven Process chain
Related Solution:
The Rapid UML solution provides diagram examples, templates and vector stencils libraries for quick and easy drawing all types of UML 2.x and 1.x diagrams
Picture: UML Business Process
Related Solution:
When trying to figure out the nature of the problems occurring within a project, there are many ways to develop such understanding. One of the most common ways to document processes for further improvement is to draw a process flowchart, which depicts the activities of the process arranged in sequential order — this is business process management. ConceptDraw DIAGRAM is business process mapping software with impressive range of productivity features for business process management and classic project management. This business process management software is helpful for many purposes from different payment processes, or manufacturing processes to chemical processes. Business process mapping flowcharts helps clarify the actual workflow of different people engaged in the same process. This samples were made with ConceptDraw DIAGRAM — business process mapping software for flowcharting and used as classic visio alternative because its briefly named "visio for mac" and for windows, this sort of software named the business process management tools.
This flowchart diagram shows a process flow of project management. The diagram that is presented here depicts the project life cycle that is basic for the most of project management methods. Breaking a project into phases allows to track it in the proper manner. Through separation on phases, the total workflow of a project is divided into some foreseeable components, thus making it easier to follow the project status. A project life cycle commonly includes: initiation, definition, design, development and implementation phases. Distinguished method to show parallel and interdependent processes, as well as project life cycle relationships. A flowchart diagram is often used as visual guide to project. For instance, it used by marketing project management software for visualizing stages of marketing activities or as project management workflow tools. Created with ConceptDraw DIAGRAM — business process mapping software which is flowcharting visio alternative or shortly its visio for mac, this sort of software platform often named the business process management tools.
Picture: Process Flowchart: A Step-by-Step Comprehensive Guide
Related Solution:
Event-Driven Process chain Diagrams for improvement throughout an organisation. Best software for Process Flow Diagram. The Event-driven Process Chain (EPC) Diagrams allows managers to plan processes and resources.
Picture: Business process Flow Chart — Event-Driven Process chain (EPC) diagrams
Related Solution:
Event-Driven Process Chain flowcharts for improvement throughout an organisation.
ConceptDraw DIAGRAM is a software for making EPC flowcharts to provide business process modelling. Its excellent business process improvement tools.
Picture: An Event-driven Process Chain (EPC) - flowchart used for business process modelling
Related Solution:
Use Software Diagram Templates from the solutions of Software Development area for ConceptDraw DIAGRAM to create your own professional looking Software Diagrams in minutes.
The Software Diagrams designed with ConceptDraw DIAGRAM are vector graphic documents and are available for reviewing, modifying, converting to a variety of formats (image, HTML, PDF file, MS PowerPoint Presentation, Adobe Flash or MS Visio XML), printing and send via e-mail in one moment.
Picture: Software Diagram Templates
Activity Network Diagram - This sample was created in ConceptDraw DIAGRAM diagramming and vector drawing software using the Seven Management and Planning Tools solution from the Management area of ConceptDraw Solution Park.
This sample shows the PERT (Program Evaluation Review Technique) chart of the request on proposal. A request for proposal (RFP) is a request of the company or the organization to potential suppliers to submit the business proposals for service or goods that it is interested to purchase. The RFP is represented on the initial procurement stage and allows to define the risks and benefits.
Picture: Activity Network Diagram Method
Related Solution:
ConceptDraw
DIAGRAM 18