Made with
ConceptDraw
MINDMAP 16

Collaboration in a Project Team

1. From Idea to Result

It is a long and thankless path, requiring patience, concentration of mind and, most importantly, a strong desire to realize your potential. Such a crucial matter as implementing a large-scale project is much easier to cope with when you are working as part of a team.

We believe that a successful project is the sum of ideas from different people.We are offering you a solution to your problems by using a combination of 2 applications, each one a powerful and convenient tool for creating and managing your projects. By using ConceptDraw PROJECT and ConceptDraw MINDMAP together you will be able to complete your work quickly and more efficiently. This is a successful combination of functionality, making it possible to consider and implement any project from the first spark of an idea to the first profits earned from your completed project. It provides you with quality support and increase the efficiency of your team project management processes.

We offer you:

  • A powerful project management tool
  • Easier creation and management of your projects
  • A mechanism for defining objectives and finding solutions
  • The possibility to monitor your project’s work in progress
  • Collaboration with your team-work
  • The possibility to create multi-projects and a shared resource pool.
  • The necessary formats for reporting and documenting your projects.

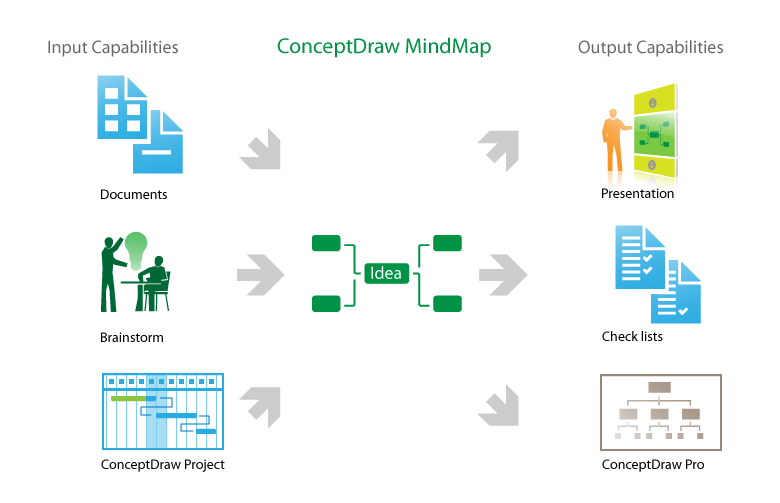
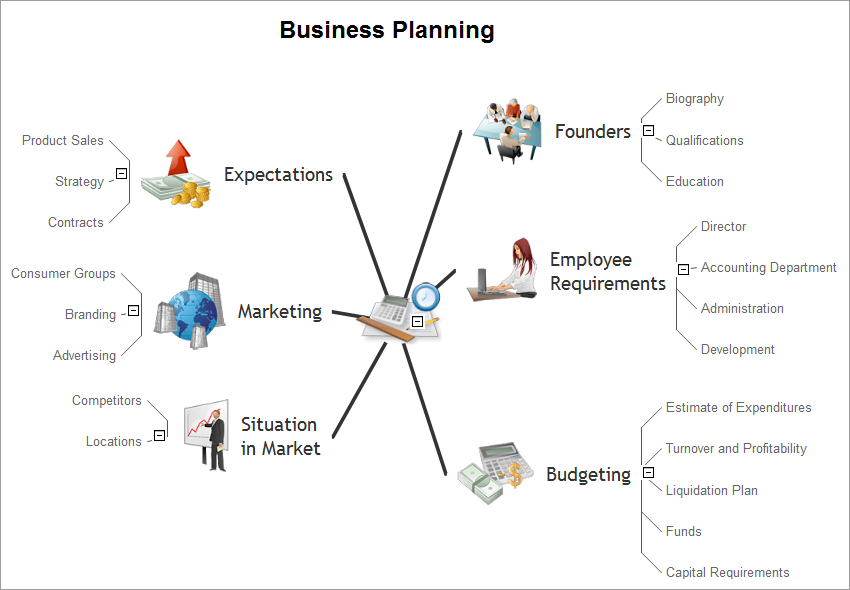
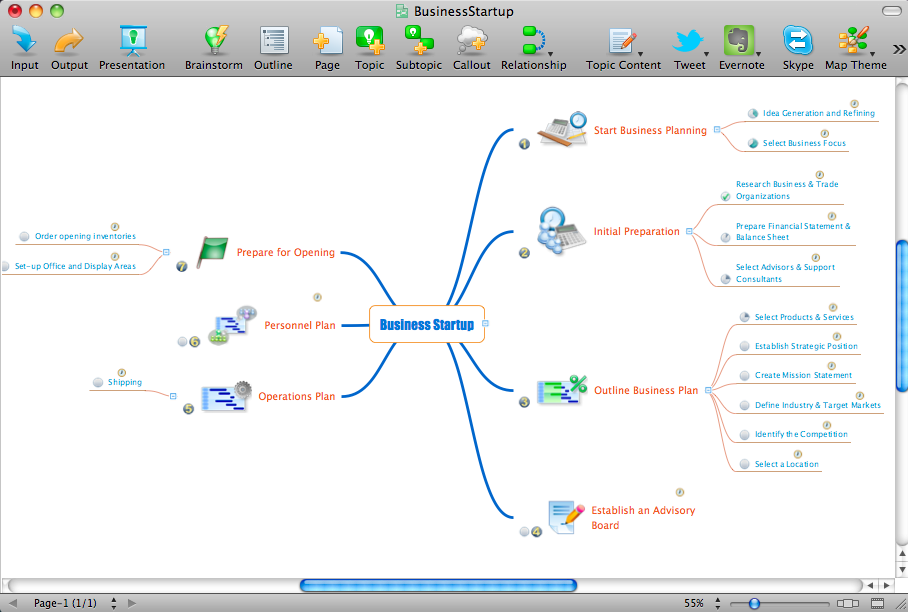
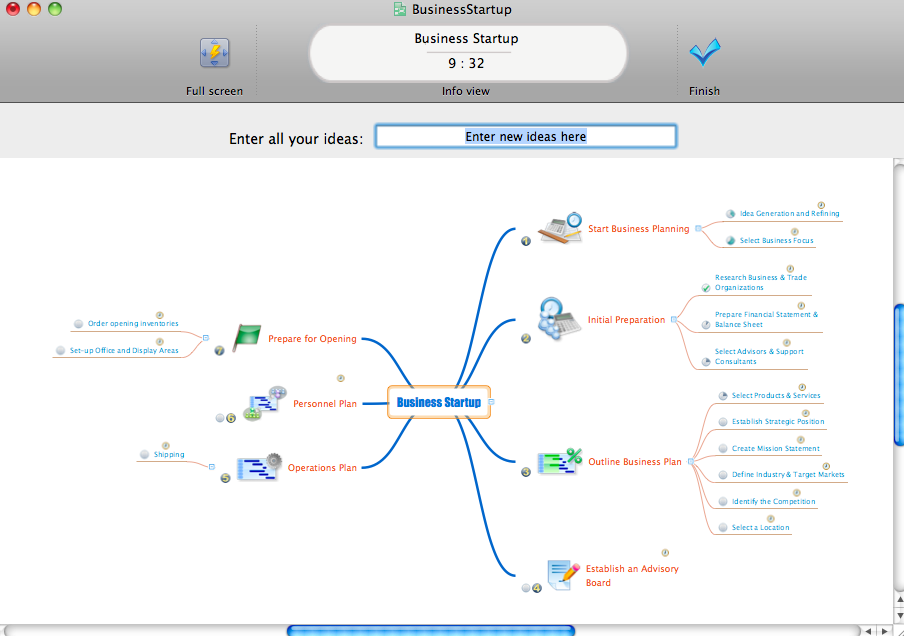
ConceptDraw MINDMAP is a powerful tool allowing you to document your ideas easily, as well as to sort and organize varied information represented in the form of visual maps. Use ConceptDraw MINDMAP to store and organize your ideas in the early stages of your project’s life-cycle.

Thanks to the clear and visual representation of your ideas in the form of maps, schemes and task branches, you can review of your ideas resulting from brainstorming without overlooking the important details that might jeopardize the results of your work.

Form of maps, schemes and task branches

Maps help you to display large amounts of information in a convenient form, and then organize and analyze it, saving you a lot of time. They also enable you to assign priorities to the project, and determine the number of people, resources and time required for both individual tasks and the project as a whole.

Ideas already formed can be assigned a task status and the percentage of the task completed will be displayed as an icon. The completed map can then be easily exported to ConceptDraw Project.

ConceptDraw PROJECT will make your ideas clearer and more accurate, and help you establish the relationships between the actions required to complete your project, so you can manage your project resources and tasks quickly and easily.

It will help you monitor the progress of your tasks, control your resources and finances, and create reports reflecting the current state of your project. It is a powerful and handy tool for managers, letting them control all the necessary data in a project, create a hierarchical structure of available resources, and keep track of the changes and implementation stages of the project’s objectives.

Thanks to clear formulation and the correct definition of problems (ConceptDraw MINDMAP ) plus automation of project management and adaptation of project tasks to specific objectives (ConceptDraw PROJECT ) you can increase the efficiency of your work and achieve success in your business. This combination caters to the needs of both individual users and people working in a team.

2. Working together

The brainstorming modeIn the Brainstorming mode you can create lists of work to do when planning projects, analyze potential problems and find non-standard solutions. It offers additional advantages for team-work, allowing for group discussion of problems and tasks, identifying whether the methods are appropriate for the goals of the project, and finding the most efficient means and strategies for task solving and implementation. The results can be uploaded to your corporate site for review and future amendments.

The brainstorming mode

In the Mind Map mode the ideas are represented as a visual scheme, aiding the perception and transfer of information. Periodic monitoring and group discussion will help you keep track of the stages of your project’s development. Having identified the key factors in advance, you will be able to evaluate the success of the programs being implemented and make necessary changes.

Brainstorming provides you with an excellent opportunity to choose a solution from a large number of suggested variants rather than the opinion of a single person. This will help you reveal the hidden potential of the project and find numerous possible solutions to the assigned tasks.

Advantages of Team-WorkThe combination of these applications gives you the most efficient tool for completing projects of any size, theme or objective successfully.

Use ConceptDraw MINDMAP to brainstorm and compile your existing ideas.

Advantages of Team-Work

Use ConceptDraw PROJECT to manage project tasks and resources quickly and easily. It will help you monitor the progress of tasks, control resources and finances, and create reports reflecting the current state of your project.

Collaboration in a Project Team *

Generate ideas for your project yourself or as part of a group, create a task list and export it to ConceptDraw PROJECT Plan and monitor numerous projects, create reports, distribute resources from the shared resource pool and coordinate the work of multiple work-groups.

All managers will benefit from using ConceptDraw PROJECT and ConceptDraw MINDMAP together. ConceptDraw MINDMAP allows managers to analyze the accumulated information and transform it into a form convenient for presentations and coordinating the work of subdivisions.

ConceptDraw MINDMAP will help you find solutions to your problems and make the most appropriate decisions for your current situation. The program lets you classify accumulated ideas and put them together to get a general overview before making a decision.

So the ideas of both the manager and the team don’t remain mere ideas, they become a tool working for the benefit of the project, making it possible to identify the primary and secondary goals and tasks, work out a work schedule and distribute the work between members of your team (having first evaluated their abilities, ideas and areas they need to work on). It helps manager draw their own ideas together with the ideas of the team into a single whole in order to create a work schedule and assign project objectives and tasks.

For the next stage, all the material created in ConceptDraw MINDMAP is transferred to ConceptDraw PROJECT This means that the ideas will be represented in the form of tasks with resources, deadlines, order and relationships. You will be able to control the available finances, resources, completion speed and stages, as well as create flexible reports.

Another useful ability of the software is the creation of multi-project maps. A multi-page mind map created in ConceptDraw MINDMAP, once exported to ConceptDraw PROJECT, gets transformed into a ready-made system of projects and sub-projects, convenient for further management and implementation.

Having a clear view of the processes underway, it is easy to keep all the changes under control and take the necessary steps in time. With these tools we believe you will be able to make top-quality project management an easy, convenient and cost-efficient affair. So, as a manager you get two tools allowing you to create the basic outline and concept for your project, while being able to directly supervise the project throughout all of the stages leading up to its successful completion.


TEN RELATED HOW TO's:
While creating flowcharts and process flow diagrams, you should use special objects to define different statements, so anyone aware of flowcharts can get your scheme right. There is a short and an extended list of basic flowchart symbols and their meaning. Basic flowchart symbols include terminator objects, rectangles for describing steps of a process, diamonds representing appearing conditions and questions and parallelograms to show incoming data. This diagram gives a general review of the standard symbols that are used when creating flowcharts and process flow diagrams. The practice of using a set of standard flowchart symbols was admitted in order to make flowcharts and other process flow diagrams created by any person properly understandable by other people. The flowchart symbols depict different kinds of actions and phases in a process. The sequence of the actions, and the relationships between them are shown by special lines and arrows. There are a large number of flowchart symbols. Which of them can be used in the particular diagram depends on its type. For instance, some symbols used in data flow diagrams usually are not used in the process flowcharts. Business process system use exactly these flowchart symbols.Flowchart example showing a customer request approval process with start, input output, process steps, decision branches, and end
Picture: Flowchart Symbols: Meaning and Examples
Related Solution:
Activity diagram describes the business and operational step-by-step workflows of components in a system. An activity diagram shows the overall flow of control.Diagramming Software for Design UML Activity Diagrams *
Picture: Diagramming Software for Design UML Activity Diagrams
To your mind, deliberation about the profits of creating organizational charts takes more time than actually creating itself. If lack of software is the only thing that stops you, you should know that organizational charts with ConceptDraw DIAGRAM are created within a few minutes. Owing to the great number of ready-to-use templates, you’ll get your chart easily. Chart is a very handy format for visually depicting official relations of an organization. Usually, an Orgchart (organizational chart) consists from simple geometrical shapes, containing an information on a position, personal data, and the lines that means responsibilities and accountabilities associated with position. ConceptDraw solution designed for making organizational charts enables one to create various org charts effortlessly using special templates and vector libraries.Organizational Charts with ConceptDraw DIAGRAM  *
Picture: Organizational Charts with ConceptDraw DIAGRAM
Related Solution:
What is organizational charts and why your business need them? How to use business process diagram software? Explore how advanced organization chart software transforms the way companies ✔️ visualize, ✔️ communicate, and ✔️ streamline their organizational hierarchiesOrganogram Software
Picture:
What is an Organizational Chart and how it works?
Organization Chart Software
Related Solution:
ConceptDraw helps you to start designing your own UML Collaboration Diagrams with examples and templates.Diagramming Software for Design <br>UML  Collaboration Diagrams *
Picture: Diagramming Software for Design UML Collaboration Diagrams
The Stakeholder Onion Diagram is a popular and widely used way to view the relationships of stakeholders to a project goal. The Onion Diagram focuses on the project goal, most of other diagram styles focus on the project, stakeholders, and timeline. This difference favorably distinguishes and separates the Onion Diagram from other types of diagrams. Design fast and easy Stakeholder Onion Diagrams of any complexity in ConceptDraw DIAGRAM diagramming and vector drawing software using the powerful tools of Stakeholder Onion Diagrams Solution from the Management Area of ConceptDraw Solution Park.Stakeholder Onion Diagrams *
Picture: Stakeholder Onion Diagrams
Related Solution:
Enterprise collaboration software helps to facilitate action-oriented teams working together over geographic distances by providing tools that aids on communication, collaboration process and problem solving.How To Use Enterprise Collaboration Software *
Picture: How To Use Enterprise Collaboration Software
Related Solution:
UML Collaboration Diagram Example Illustration. This sample was created in ConceptDraw DIAGRAM diagramming and vector drawing software using the UML Collaboration Diagram library of the Rapid UML Solution from the Software Development area of ConceptDraw Solution Park. This sample shows the creation process of the contact list and can be used at the staff training and staff working, at the attraction process the new clients.UML Collaboration Diagram Example Illustration *
Picture: UML Collaboration Diagram Example Illustration
Related Solution:
When thinking about data visualization, one of the first tools that comes to mind is a flowchart design. You can find flowchart symbols, shapes, stencils and icons easily on the Internet, but it might take time to systematize this information. Nevertheless, once you start flowcharting, you’ll love its simplicity and efficiency. This diagram consists from standard flowchart symbols, approved by ANSI (American National Standard Institute) for drawing flowcharts. A flowchart is a diagram that represents a step-by-step algorithm of any process, displaying the process stages as boxes that are connected with arrows. Flowchart design makes it clear and readable. Flowchart designed using ConceptDraw DIAGRAM flowchart software allows to make attractive and clear process presentation, it makes interpretation of the business process flow fresh and versatile. Great flowchart design view is a big advantage over the diagram created manually on a paper.Comparison of bad and good flowchart design showing zigzag flow, crossed connectors, and aligned elements
Picture: Flowchart Design: Principles, Layout, Symbols and Best Practices
Related Solution:
A requisition form is one of the documents used for accounting in different manufacturing processes. There are two main types of requisition: a purchasing requisition and material requisition and difference between them is significant. Creating a flowchart might help you in understanding all the details of accounting process. Flowcharts are a best visual method for dividing a large and complicated procedure into a several little clear pieces. The main value-ability of an effective flowchart is its simpleness. Material requisition flowcharts are used to document the process of relationships between the different departments and the purchasing department within an organization. The flow chart gives the step-by-step guide on how is carried out the procurement process of the materials necessary for the functioning of the organization. This type of flowchart along with many other business flowcharts, one can easy create using ConceptDraw Flowcharts solution.Material Requisition Flowchart
Picture: Material Requisition Flowchart. Flowchart Examples
Related Solution:
ConceptDraw
MINDMAP 16