A full-featured project management solution with all the necessary functions right at your fingertips. Generates an extensive variety of reports on project and task statuses. Centralizes project information through embedded documents and hyperlinks. Unique Multiproject Dashboard manages multiple projects from a single file. Powerful integration with other ConceptDraw products makes project management easier than ever before.
Delivers a rich set of built-in functionalities and optional product extensions that support your daily workflow in time-saving and creative ways.
These videos provide a series of lessons that will enhance the understanding of all our users, from people just starting out with the software, through to expert users.
Separated into categories of Basic, Intermediate, and Advanced categories, the new instructional videos cover a huge breadth of topics. Users new to ConceptDraw PROJECT will find the Basic lessons an essential platform for familiarizing themselves with the ′s functions. Experienced users will benefit from the Intermediate and Advanced lessons, learning to take advantage of the program′s full capabilities and unlock its true potential.
ConceptDraw PROJECT contains an extensive tool set to help project managers. The rich data visualization capability that is provided by ConceptDraw products helps you create project dashboards, one-click reports, multi-project views, Gantt charts, and resource views.
Let′s learn how to get maximum value using ConceptDraw PROJECT !
Here′s some feedback from a customer:
"The documentation behind ConceptDraw Office 2, both online and via the Help system is clear and comprehensive. Also, Odessa is developing a robust set of video tutorials for its website. These are particularly well done and helpful. ...I′ve learned over the years that some of the best software for the Mac comes from the shores of the Black Sea. My compliments to your entire team there."
Ric Getter,
Senior Editor,
MacDirectory Magazine
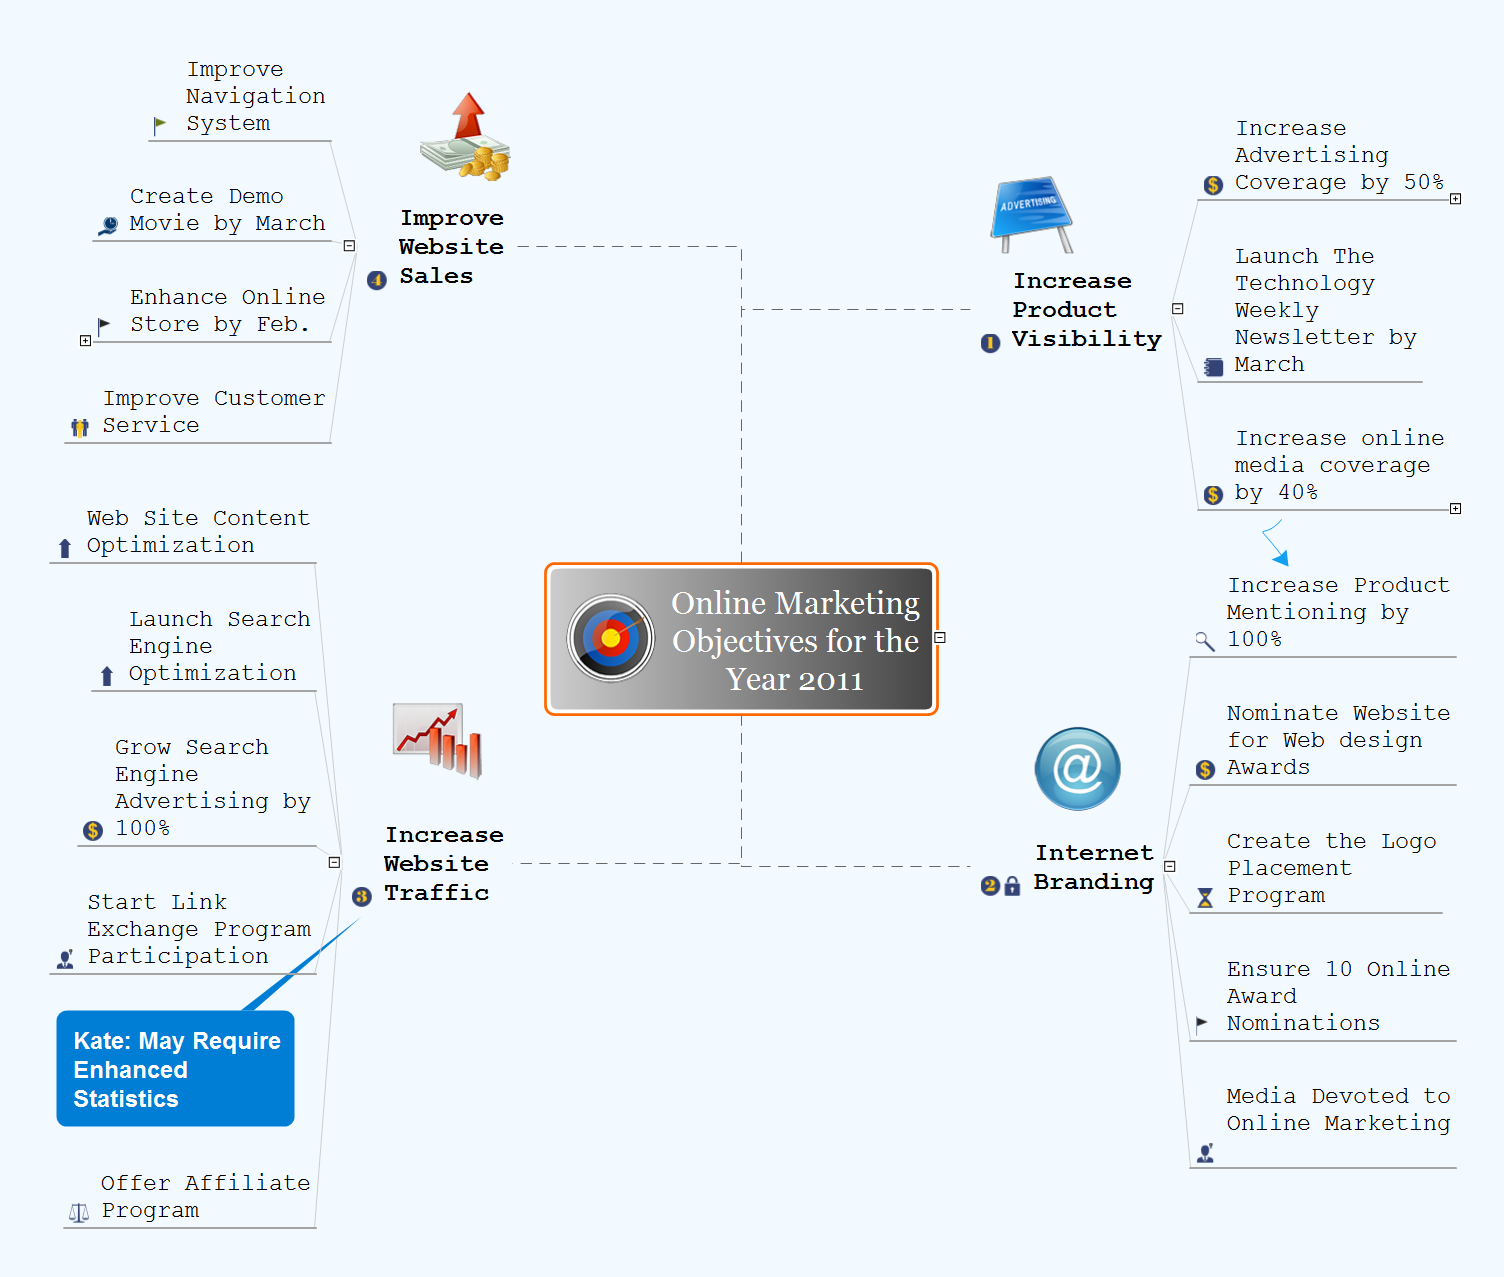
Many things can be listed as potential strengths and weaknesses of a company. To create a good-looking scheme, use SWOT analysis software and enjoy the results within a few minutes. A good practice is to make a SWOT analysis twice a year.
These drawings illustrate the possibilities of ConcptDraw solution for building SWOT and TOWS Matrices. SWOT analysis matrix demonstrates this widely used method for detection of Strengths and Weaknesses, Opportunities and Threats facing any business. If SWOT analysis is carried out properly, it can help to build a good position in the market. The ConceptDraw SWOT and TOWS Analysis solution provides a great number of templates of both SWOT and TOWS matrices. Moreover, this is the only software that offers to carry out SWOT analysis starting from making mind maps. The solution contains SWOT mind map templates. A single mouse click is needed to turn the SWOT mind map into a SWOT matrix. The SWOT diagram will be created in ConceptDraw DIAGRAM on the base of SWOT mind map.
Design efficiently the technical flow charts in ConceptDraw DIAGRAM software for various fields and provide ✔️ clarity, ✔️ accuracy, ✔️ usability, ✔️ simple communication, analysis, and improvement
Enjoy the flowcharting process with the intuitive interface and powerful tools of the user-friendly ConceptDraw DIAGRAM software: ✔️ represent algorithms, ✔️ break down complex processes, ✔️ display workflows, ✔️ show procedures, ✔️ succeed in decision-making, ✔️ streamline processes, ✔️ increase productivity, ✔️ enhance efficiency
Event-Driven Process Chain flowcharts for improvement throughout an organisation.
ConceptDraw DIAGRAM is a software for making EPC flowcharts to provide business process modelling. Its excellent business process improvement tools.
Picture: An Event-driven Process Chain (EPC) - flowchart used for business process modelling
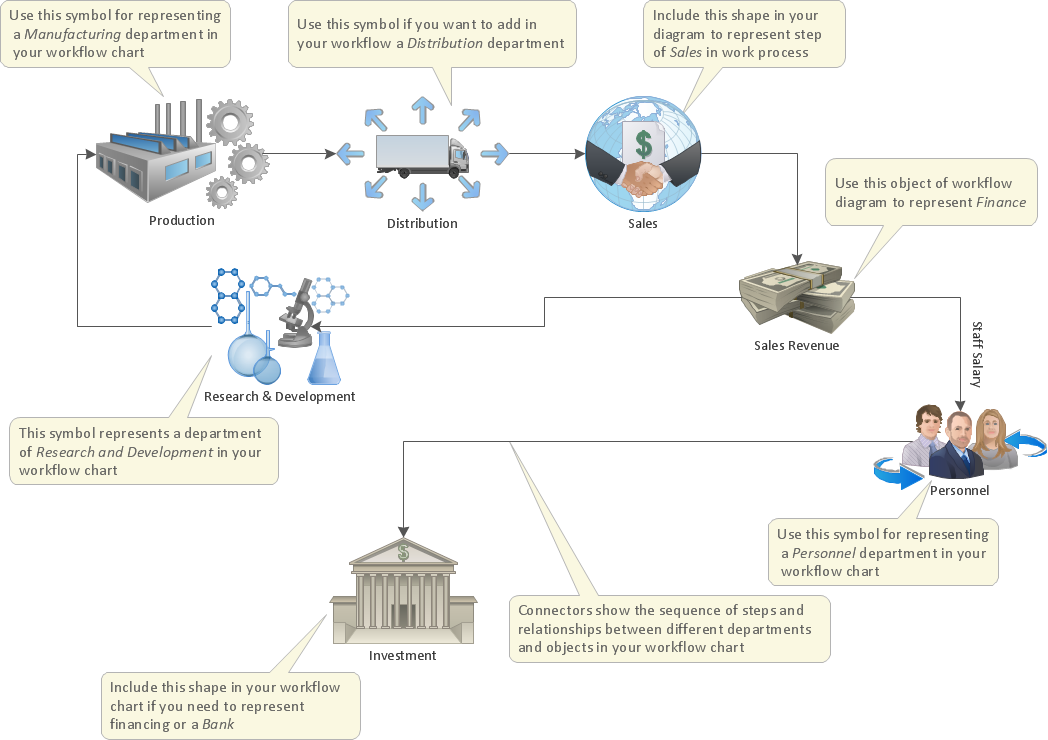
To draw an effective workflow you have to have an ability to focus on thinking, not drawing. This becomes possible with ConceptDraw DIAGRAM software. Thanks to Arrows10 technology, you are able to place steps and relations onto your workflow diagram without thinking of how to do this, or which stencil to use. This is the most natural and effective way of drawing workflows.
Diagrams are a very important part of modern life. With the help of flow diagram software, a lot of companies can promote their ideas at the market. Its usefulness is totally doubtless.
This is a flow chart of the invoice payment flow. This flowchart details decrypts all stages of the process of obtaining and paying bills. It is a description of the universal process - such steps performs accounting departments of almost any organization. Since every business no matter what it does is a consumer of some goods or services. The given flow chart was made using ConceptDraw DIAGRAM software and the Diagrams solution for making flowcharts of any kind.
Quality Control Chart Software (ISO Flowcharting) - ConceptDraw DIAGRAM extended with Total Quality Management TQM Diagrams Solution from the Quality Management Area is the best diagramming and vector drawing software that allows you to draw the quality control charts quick and easy.
The quality control chart is a graphic that illustrates the accordance of processes or products to the intended specifications and degree of differences from them. Depending on what type of data you need analyze, there are used different types of quality control charts: X-bar charts, S charts, Np charts.
Picture: Quality Control Chart Software — ISO Flowcharting
To begin managing a new project, you will need to define the individual Tasks that must be completed to deliver it. The default view for a new project in ConceptDraw PROJECT is the Gantt Chart.
Activity Network and Project Evaluation and Review Technique, or PERT, charts are a way of documenting and analyzing the tasks in a project.
This diagram is constructed as part of the process in creating a schedule of corrective actions. The Activity Network Chart (PERT) shows the logical connections and consequence of tasks to be performed. It displays the time period for problem solving and the implementation of all activities through the critical path.