
Example 1. Positioning Map
Matrices Solution offers the extensive drawing tools and collection of different kinds of predesigned templates and samples of marketing matrices. Use of the ready template is one of the most convenient and helpful ways of drawing. Let's try to verify this.

Example 2. Matrices Library Design Elements
Matrices Solution contains also the Matrices library with ready-to-use vector objects which will help you design various matrix diagrams in a few minutes. Choose the most desired way of drawing among the offered ones to draw your own Positioning Map.

Example 3. Positioning Map Template
This Positioning Map Template was created in ConceptDraw DIAGRAM using the Matrices solution. It is a perfect base for quick, easy and effective creating your own professional looking Positioning Map.
All source documents are vector graphic documents. They are available for reviewing, modifying, or converting to a variety of formats (PDF file, MS PowerPoint, MS Visio, and many other graphic formats) from the ConceptDraw STORE. The Matrices Solution is available for all ConceptDraw DIAGRAM or later users.
TEN RELATED HOW TO's:
If you have doubts about some situation, there are tools that might help you. First used in the Stanford Research Institute in the 60s, SWOT analysis is a great solution and if you need to build a strategy, this tool is very effective. As a result, you will get the clear idea of all the opportunities and threats you might face.
This matrix was build for a TOWS analysis performance. A TOWS analysis includes the same process of listing strengths, weaknesses, opportunities and threats as a SWOT analysis. But, unlike SWOT, TOWS analysis primarily takes into account threats and opportunities and then at least - weaknesses and strengths. This is also a is a strategic planning tool. Beyond making a matrix, the strategy manager should investigate ways the organization can take edge of opportunities and reduce threats by turning to advantage strengths and weaknesses. Making SWOT and TOWS analysis uses the same approach and outputs close results. ConceptDraw SWOT and TOWS Matrix Diagrams solution supplies templates of matrices, that help to list clearly the constituents of SWOT and TOWS analysis.
Picture: SWOT Analysis Solution - Strategy Tools
Every company meets some risks during project life cycle. It’s easy to face them using such tools as SWOT analysis matrix diagram that depicts Strengths, Weaknesses, Opportunities and Threats of any proposed subject. ConceptDraw Solution Park contains excellent templates of of SWOT and TOWS matrices.
Making SWOT matrix is frequently used in practical marketing. It is the valuable tool of marketing strategy development. SWOT matrix allows to define the strengths and weaknesses of the organization, possible outside threats and opportunities and evaluate the current strategic competitors. Using ConceptDraw SWOT and TOWS Matrix Diagrams solution you can perform SWOT analysis. You can create a SWOT matrix in and then compare the strengths and weaknesses of your organization and the opportunities and threats of market. The well-performed SWOT-analysis allows you define the steps that can be taken for the improvement of your company market position and determine and problems that need to be solve urgently.
Picture: SWOT analysis matrix diagram templates
Have you ever created the fire plans on the base of Fire Evacuation Plan Template? It's incredibly convenient and time-saving way. Let's try to make sure this with Fire and Emergency Plans solution for ConceptDraw DIAGRAM software.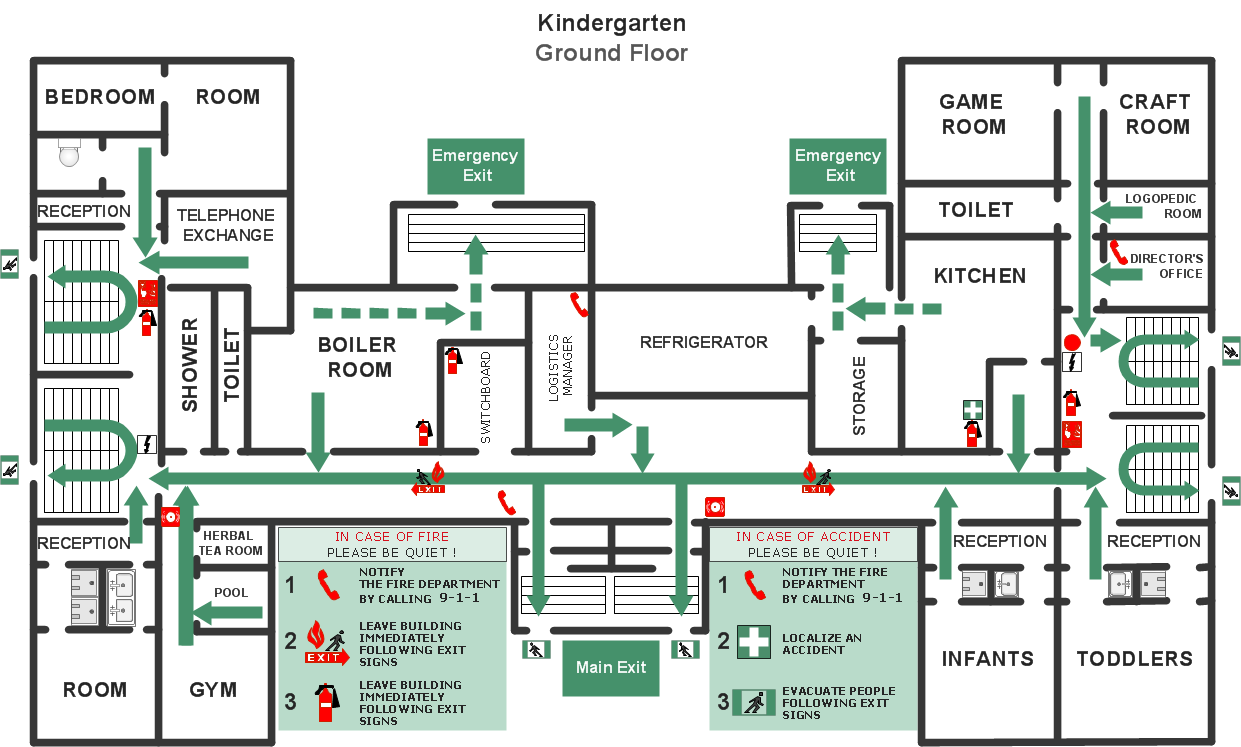
Picture: Fire Evacuation Plan Template
Related Solution:
Take inspiration with ConceptDraw to visualise your maps and make eye-catching infographics.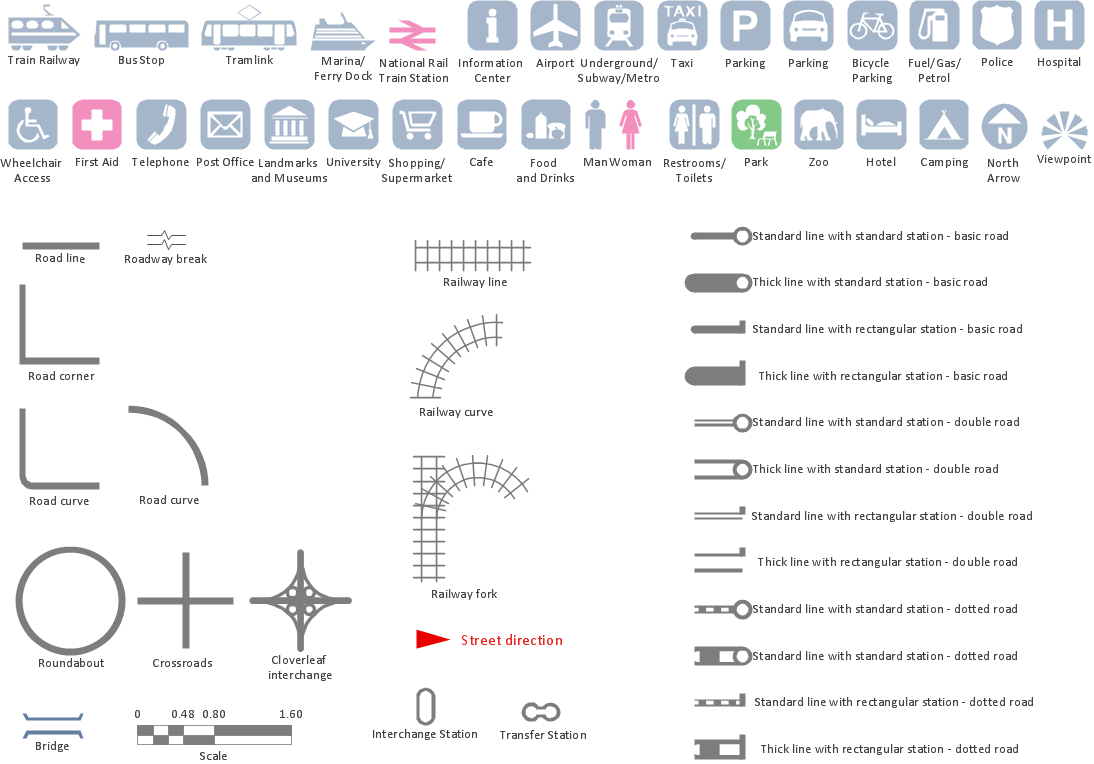
Picture: Map Infographic Maker
SWOT matrix templates is part of SWOT Analysis solution from ConceptDraw Solution Park.
Picture: SWOT matrix template
Being is an accurate representation of some distribution of numerical data, any histogram is one of the most commonly used drawings that can be also created with the help of the ConceptDraw DIAGRAM.
Picture: Making a Histogram
Related Solution:
ConceptDraw DIAGRAM diagramming and vector drawing software extended with Marketing Diagrams Solution from the Marketing Area of ConceptDraw Solution Park is the best software for quick and easy creating Marketing Flow Chart of any complexity and design.
Picture: Marketing Flow Chart
Related Solution:
Bubble Charts are convenient way to visualize ideas and concepts by organizing them in a hierarchy. To show the importance of ideas you can use different bubble sizes and colors. ConceptDraw DIAGRAM diagramming and vector drawing software extended with Business Diagrams Solution from the Management Area affords you the easiest and fastest way for designing professional-looking Bubble Charts.
Picture: Bubble Charts
Related Solution:
Structured-systems analysis and design method uses data flow diagrams to represent the process of data flowing through a system. Talking about this might be useless without a proper example of DFD for online store (Data Flow Diagram). This DFD example shows all the distinctness that a diagram can bring into a scattered data structure.
Data flow diagrams are used to show how data is processed within some business processes. Making DFD is a common practice for business process modeling and analysis. This diagram represents the online store business flow. It describes inputs and outputs within online selling process and depicts the interactions between its participants. This DF diagram can be used by system analysts to create an overview of a business, to study and discover its inherent strengths and weak points.
Picture: Example of DFD for Online Store (Data Flow Diagram)
Related Solution:
In the course of recent decades data visualization went through significant development and has become an indispensable tool of journalism, business intelligence and science. The way visual information may be conveyed is not limited simply to static or dynamic representation, it can also be interactive. Infographics can be conditionally divided into several general levels. Primarily, this is level of visualization of information, its interpretation and association on any ground. Second level can be defined as a visualization of knowledge, depiction of thoughts and ideas in the form of images or diagrams. Finally, the level of data visualization, which processes data arrays in charts, enabling the information to be more clearly perceived. You can also identify the main approaches to the creation of infographics: exploratory and narrative. Exploratory method insists on minimalist design in favor of data precision without unnecessary details and is common for scientific researches and ana
Picture: Design Pictorial Infographics. Design Infographics
Related Solution:

