Pyramid Diagram
Project Management Triangle
The ANSI Standard for project management known as Project Management Body of Knowledge(PMBoK) defines project management as an area of activity which determines and achieves a clear project objectives, balancing among the volume of work, resources (such as money, materials, energy), time, quality and risks.
A key factor in the project management success is to have a clear specific plan in advance, to minimize risks and deviations from the plan, to have an effective change management (as opposed to the process approach, functional management and service level management).
Project Management Triangle model represents the balance between the project scope, project cost, time and quality. The quality was included later, so initially this model is known as "Triple Constraint".
As required by any undertaking the project should proceed and reach the final, encountering certain restrictions. Classically, these constraints are defined as project scope, time and cost and are related to the Project Management Triangle, each side of which represents one of the constraints. Changing one of the triangle sides invariable affects the others. Further refinement of the constraints contributed scope quality and effect, turning quality into the fourth constraint.
The constraint of time is determined by the time available to complete the project. The constraint of cost is determined by the budget allocated for the project. The constraint of scope is determined by a set of actions required to achieve the final result of the project. These three constraints are often competing with each other.
Changing the scope of the project usually leads to a change in time and cost. Tight schedule may cause an increase in cost and a decrease in the scope. A small budget may cause an extension in time and a decrease the scope.
Another approach to project management is to consider the following three constraints: finances, time and human resources. If it is necessary to reduce the time, a project manager can increase the number of employed people to solve problems, although that will inevitably lead to an increase in the budget. Due to the fact that this problem will be resolved quickly, it is possible to avoid the growth of the budget, reducing costs by an equal amount in any other segment of the project.
This project management triangle chart example is included in the Pyramid Diagrams solution from Marketing area of ConceptDraw Solution Park.

Example 1. Pyramid Diagram. Project management triangle diagram
This diagram was redesigned using ConceptDraw DIAGRAM diagramming and vector drawing software from Wikimedia Commons file Project-triangle-en.svg.
[commons.wikimedia.org/wiki/File:Project-triangle-en.svg]
See more Pyramid Diagram:
TEN RELATED HOW TO's:
When we think of an hierarchy, we intuitively imagine a pyramid. Thus, a lot of management tools use pyramid charts as examples or illustrations of various documents or models. You can create any type of triangle diagram using ConceptDraw DIAGRAM.
A triangle (pyramid) diagram is often used in marketing to show the data hierarchy. This pyramid diagram represents the Top Brand Model. It illustrate the model of rebranding strategy. It can be used by marketing agency dealing with rebranding strategies development. It’s critical for marketing diagrams to be both clear and eye catching. ConceptDraw Pyramid diagrams solution meet all these requirements and can be successfully applied for creating and presenting various marketing pyramidal diagrams.
Picture: Pyramid Chart Examples
Related Solutions:
While creating flowcharts and process flow diagrams, you should use special objects to define different statements, so anyone aware of flowcharts can get your scheme right. There is a short and an extended list of basic flowchart symbols and their meaning. Basic flowchart symbols include terminator objects, rectangles for describing steps of a process, diamonds representing appearing conditions and questions and parallelograms to show incoming data.
This diagram gives a general review of the standard symbols that are used when creating flowcharts and process flow diagrams. The practice of using a set of standard flowchart symbols was admitted in order to make flowcharts and other process flow diagrams created by any person properly understandable by other people. The flowchart symbols depict different kinds of actions and phases in a process. The sequence of the actions, and the relationships between them are shown by special lines and arrows. There are a large number of flowchart symbols. Which of them can be used in the particular diagram depends on its type. For instance, some symbols used in data flow diagrams usually are not used in the process flowcharts. Business process system use exactly these flowchart symbols.
Picture: Flowchart Symbols: Meaning and Examples
Related Solution:
Any hierarchical structure of any company can be represented as a triangle or a pyramid. You can create a pyramid diagram and pyramid chart of any complexity using special libraries included in ConceptDraw DIAGRAM. Actually, any knowledge or chain of facts can also be depicted as a pyramid.
A wide range of graph and chart are utilized in marketing to maintain documentation and various visual issues, that deal with marketing information and data. The marketing value pyramid can be created to illustrate how the value of company, or product is based on its competitiveness. To design this diagram we used ConceptDraw DIAGRAM drawing tools in conjunction with Pyramid solution for Solution Park.
Picture: Pyramid Diagram and Pyramid Chart
Related Solutions:
The DIKW Pyramid refers loosely to a class of models for representing purported structural and/or functional relationships between data, information, knowledge, and wisdom.
Picture: Pyramid Diagram
Related Solution:
A triangular graphic representing Graham's hierarchy of disagreement, based on Paul Graham's March 2008 essay How to Disagree.
Picture: Pyramid Diagram
Related Solutions:
This pyramid chart example is supplied with the ConceptDraw Pyramid Diagrams solution. This is a model of Information Management Systems classification. It is made in a form of a four-level pyramid. The top level shows the information system developed for an executive management. Below, there is a level depicting the system of decision making process for the managers of the senior level. A schematic representation of the middle management information system, following to logic, is in the middle of the pyramid. And at least, the lowermost level represents an information processing system for employees.
Picture: Pyramid Diagram
Related Solutions:
Interactive Voice Response (IVR) Balance Recharge Diagram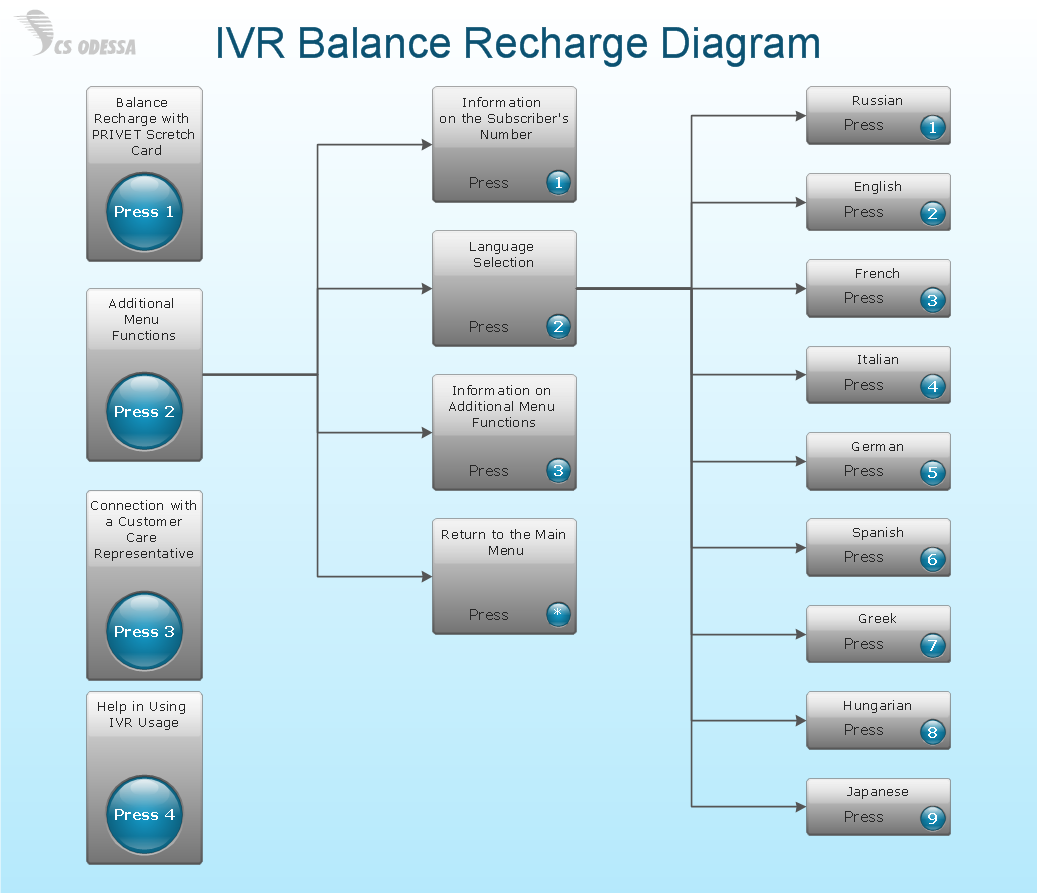
Picture: Network Diagram SoftwareIVR Balance Recharge Diagram
At the base of the identity of an organisational is its organizational culture.
Picture: Pyramid Diagram
Related Solutions:
The Total Quality Management Diagram solution helps you and your organization visualize business and industrial processes. Create Total Quality Management diagrams for business process with ConceptDraw software.
Picture: Organizational Structure Total Quality Management
Related Solution:
Of course it is possible to keep network records in text documents, but it is very difficult to use them later. A more sound way to keep such documentation is to create a network diagram that might represent either logical network structure or physical. These diagrams are easy to understand and you will thank yourself later.
There is a physical network diagram. It is a tool to represent, maintain and analysis of network equipment and interconnections. Network diagram depicts the actual network information in the attractive clear graphic form. One can learn here the LAN cable length, telecommunication type and carrying capacity. The diagram depicts servers, IP address and domain name as well. Also it shows location of hubs, switches, modems, routers, and other network equipment. The sets of special symbols and images delivered with ConceptDraw Network Diagrams solution are used to show network components. Symbols have a standard view. Therefore, various specialists can read the network diagram without any discrepancies.
Picture: Network diagrams with ConceptDraw DIAGRAM
Related Solution: