
Example 1. Pyramid Diagram. 5 level pyramid model of information systems types
This diagram was redesigned using ConceptDraw DIAGRAM diagramming and vector drawing software from Wikimedia Commons file. [commons.wikimedia.org]
This file is licensed under the Creative Commons Attribution 3.0 Unported license. [creativecommons.org]
This triangle chart example is included in the Pyramid Diagrams solution from Marketing area of ConceptDraw Solution Park.

Example 2. Pyramid Diagrams solution in ConceptDraw STORE
All source documents are vector graphic documents. They are available for reviewing, modifying, or converting to a variety of formats PDF file, MS PowerPoint, MS Visio, and many other graphic formats.
See more Pyramid Diagram:
TEN RELATED HOW TO's:
ConceptDraw DIAGRAM diagramming and vector drawing software extended with Flowcharts Solution from the 'Diagrams' area of ConceptDraw Solution Park is a powerful tool for drawing Flow Charts of any complexity you need. Irrespective of whether you want to draw a Simple Flow Chart or large complex Flow Diagram, you estimate to do it without efforts thanks to the extensive drawing tools of Flowcharts solution, there are professional flowchart symbols and basic flowchart symbols. This sample shows the Gravitational Search Algorithm (GSA) that is the optimization algorithm.
Picture: Simple Flow Chart
Related Solution:
If you have a small budget to design a computer network, you have to be very careful. One of the most cheap technologies to implement is a bus network topology, however it has many disadvantages. For instance, if the network cable is somehow damaged, the entire network won't work.
This diagram illustrates a so-called "Bus" network topology. This type of network arrangement means that each computer or other device is linked to a main link (bus). The end nodes are shown as a circle. The links to the bus are depicted as solid vertical lines. The bus is shown as a bold horizontal line. This diagram can serve as a template for creating logical or physical network diagrams. The set of vector libraries supplied with ConceptDraw Computer and Networks solution contains the symbols of all LAN and WLAN elements required for creating network diagrams of any configuration.
Picture: Bus Network Topology
Related Solution:
This sample shows the Flowchart that displays the solid-state welding processes, the types of welding.
Picture: Types of Welding in Flowchart
Related Solution:
To describe the accounting processing use ConceptDraw Flowchart set of symbold created for Accounting data processing.
Tips, Methods and Symbols on How to Create Flowcharts for an Accounting Information System.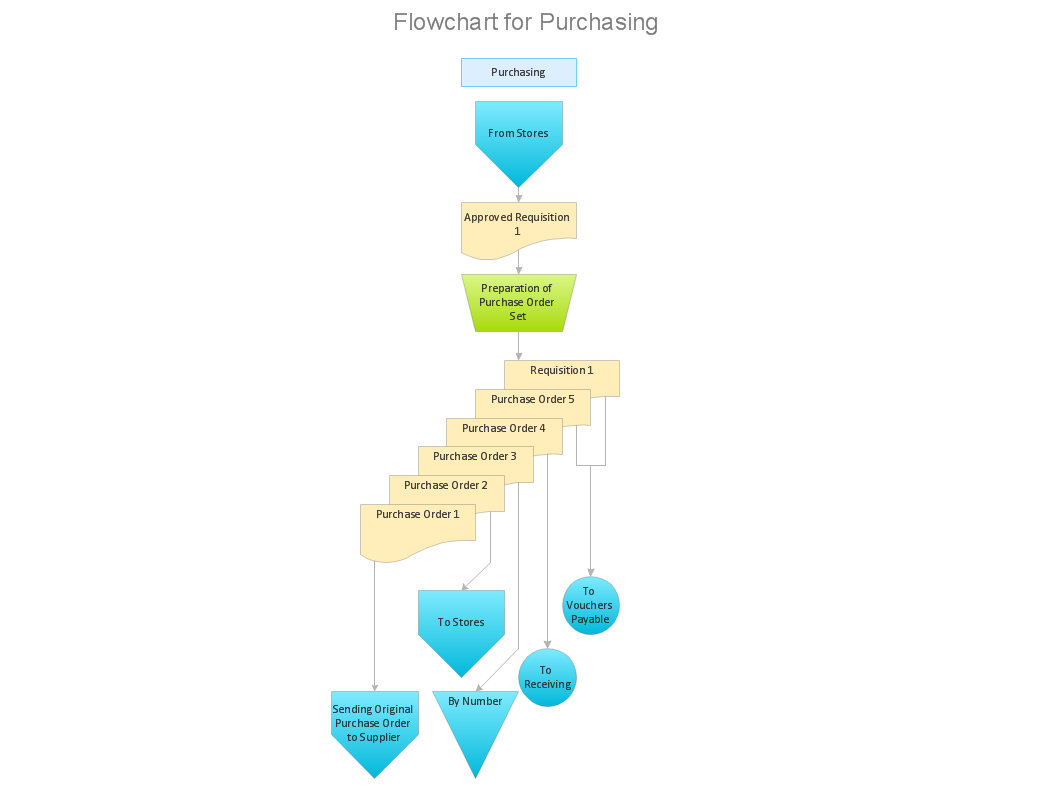
Picture: How Do You Make An Accounting Process Flowchart?
Related Solution:
A pie chart is a circular diagram showing a set of data divided into proportional slices. There are several variations of this chart such as donut chart, exploded pie chart, multi-level pie charts. Although it is not very informative when a ring chart or circle chart has many sections, so choosing a low number of data points is quite important for a useful pie chart.
ConceptDraw DIAGRAM software with Pie Charts solution helps to create pie and donut charts for effective displaying proportions in statistics, business and mass media for composition comparison, i.e. for visualization of part percentage inside one total.
Picture: Pie Chart Software
Related Solution:
ConceptDraw DIAGRAM diagramming and vector drawing software supplied with Chemical and Process Engineering Solution from the Industrial Engineering Area of ConceptDraw Solution Park is powerful and effective process engineering software.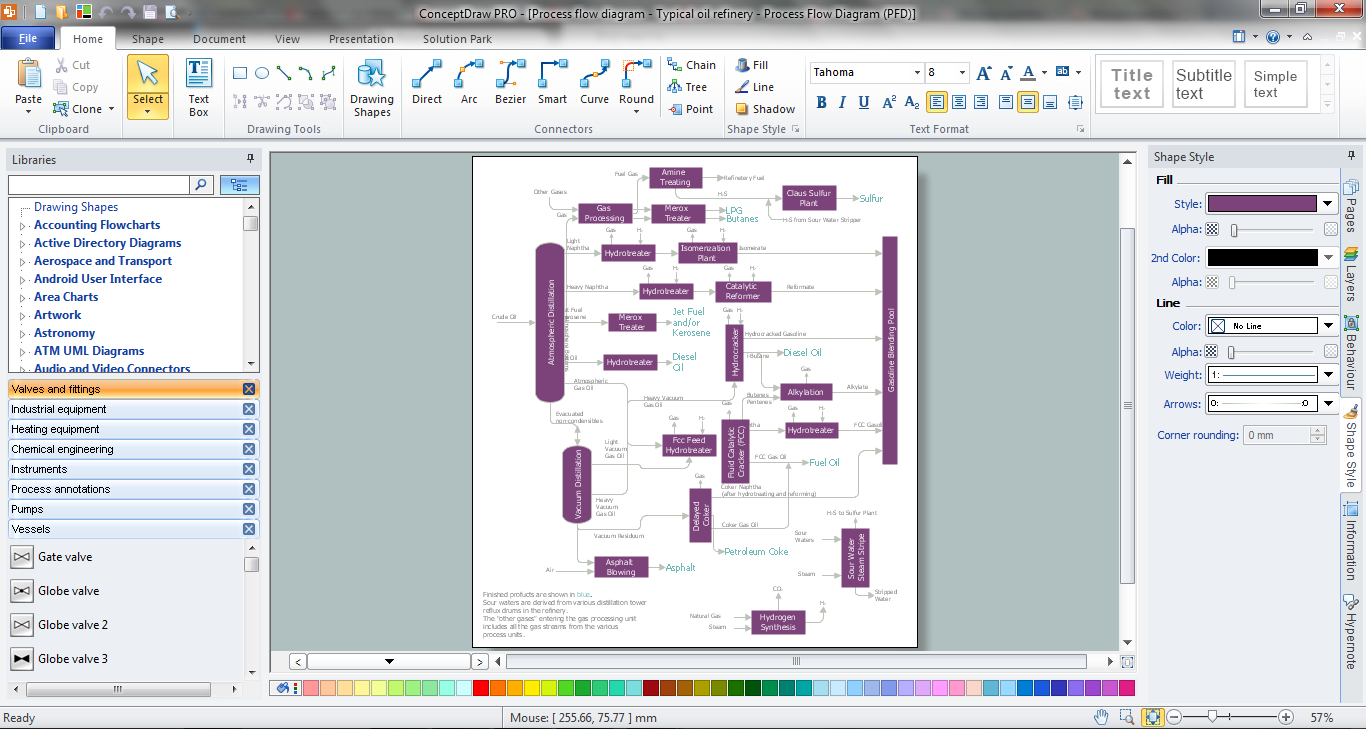
Picture: Process Engineering
Related Solution:
Explore practical flowchart examples including business process diagrams, workflow charts, swimlane flowcharts, and IT troubleshooting flows. Review common patterns and start from ready templates.
Picture: Flowchart Examples
Related Solution:
This template was created in ConceptDraw DIAGRAM diagramming and vector drawing software using the Block Diagrams Solution from the “Diagrams” area of ConceptDraw Solution Park.
This template shows the Product Proposal Diagram on that is displayed the sequence of the product planning steps. This diagram is convenient, visual and clear.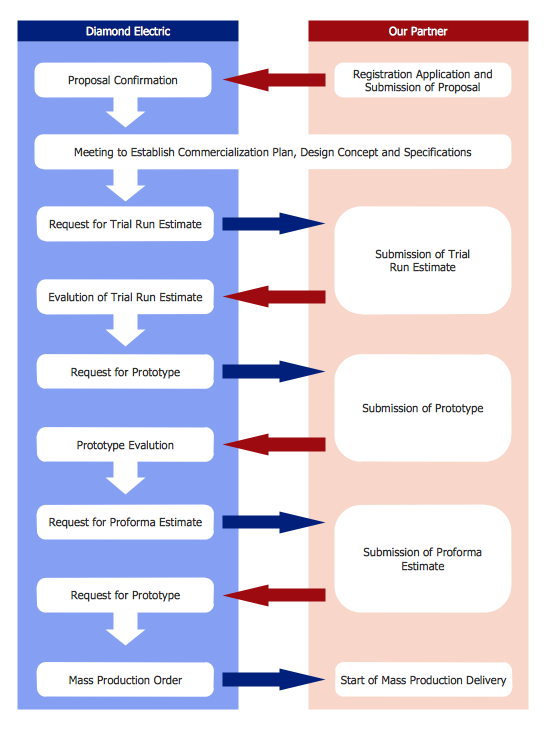
Picture: Product Proposal Template
Related Solution:
Azure is a cloud computing platform developed by Microsoft which offers the extensive infrastructure and wide set of integrated Azure services useful for effective computing, storage, analytics, databases, networking, application development and deployment.
ConceptDraw DIAGRAM extended with Azure Architecture Solution from the Computer and Networks area is a powerful diagramming and vector drawing software with extensive set of useful drawing tools for easy creating Azure Architecture Diagrams and documenting Azure services.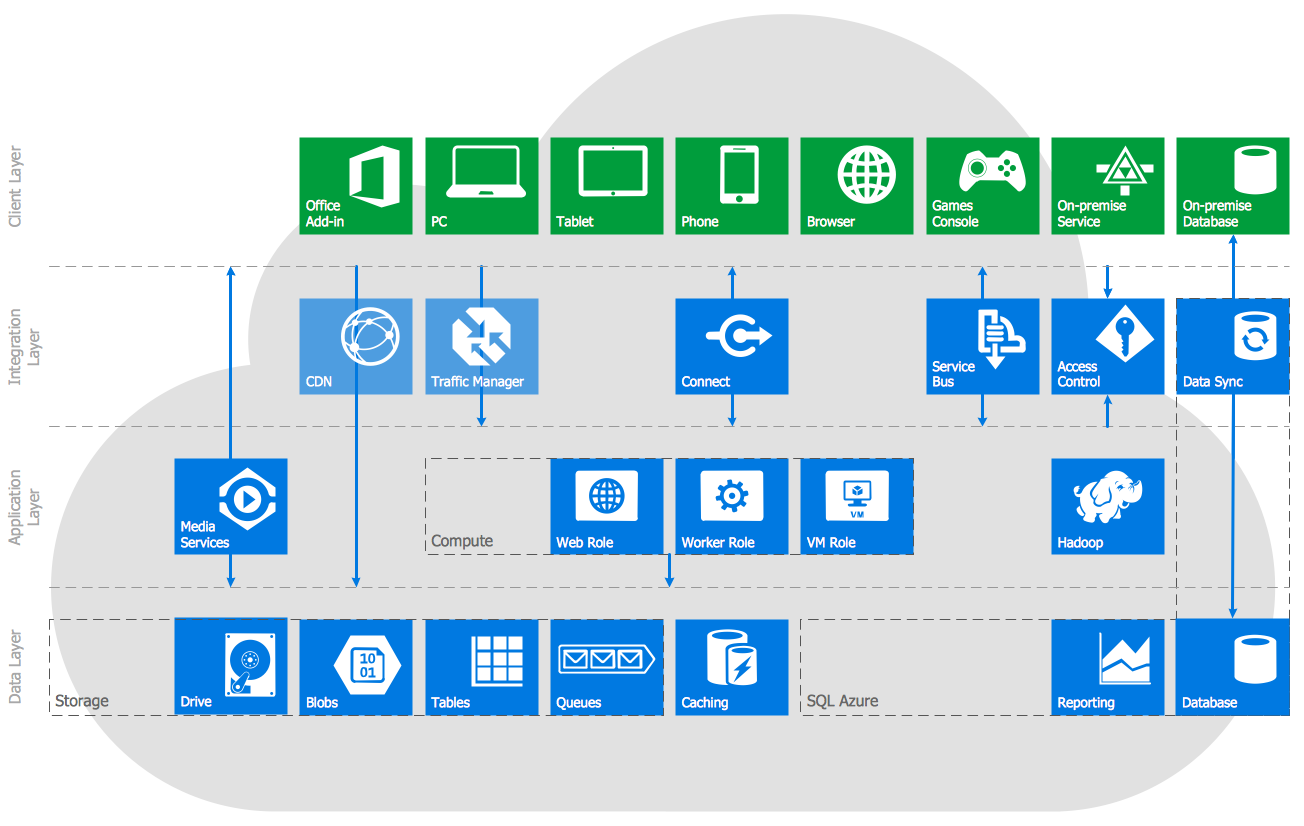
Picture: Azure Services
Related Solution:
Compare flowchart software by type, features, and workflow fit. Learn the difference between desktop and online tools and choose the right solution for documentation or collaboration.
Picture: Flowchart Software: Tools for Process and Workflow Diagramming
Related Solution:
