Pyramid Diagram
Four level pyramid model
A four level pyramid model of different types of Information Systems based on the different levels of hierarchy in an organization.
The first level represents transaction processing systems for workers.
The second level represents management information systems for middle managers.
The third level represents decision support systems for senior menegers.
The fourth level represents executive information systems for executives.
This triangle chart example is included in the Pyramid Diagrams solution from Marketing area of ConceptDraw Solution Park.

Example 1. Pyramid Diagram. 4 level pyramid model of information systems types
This diagram was redesigned using ConceptDraw DIAGRAM diagramming and vector drawing software from Wikimedia Commons file Four-Level-Pyramid-model.png.
[commons.wikimedia.org/wiki/File:Four-Level-Pyramid-model.png]
This file is licensed under the Creative Commons Attribution-Share Alike 3.0 Unported license. [creativecommons.org/licenses/by-sa/3.0/deed.en]
See more Pyramid Diagram:
TEN RELATED HOW TO's:
ConceptDraw DIAGRAM is a powerful software that helps you create professional and easy drawing diagrams for business, technology, science and education.
Picture: Create Sophisticated Professional Diagrams - Simply
Use the set of special professionally developed swim lane flowchart symbols - single, multiple, vertical and horizontal lanes from the Swimlanes and Swimlanes BPMN 1.2 libraries from the Business Process Diagram solution, the Swim Lanes library from the Business Process Mapping solution as the perfect basis for your Swim Lane Flowcharts of processes, algorithms and procedures.
Picture: Swim Lane Flowchart Symbols
Related Solution:
ConceptDraw Quality MindMap solution is a perfect additional tool for the quality team of your organization.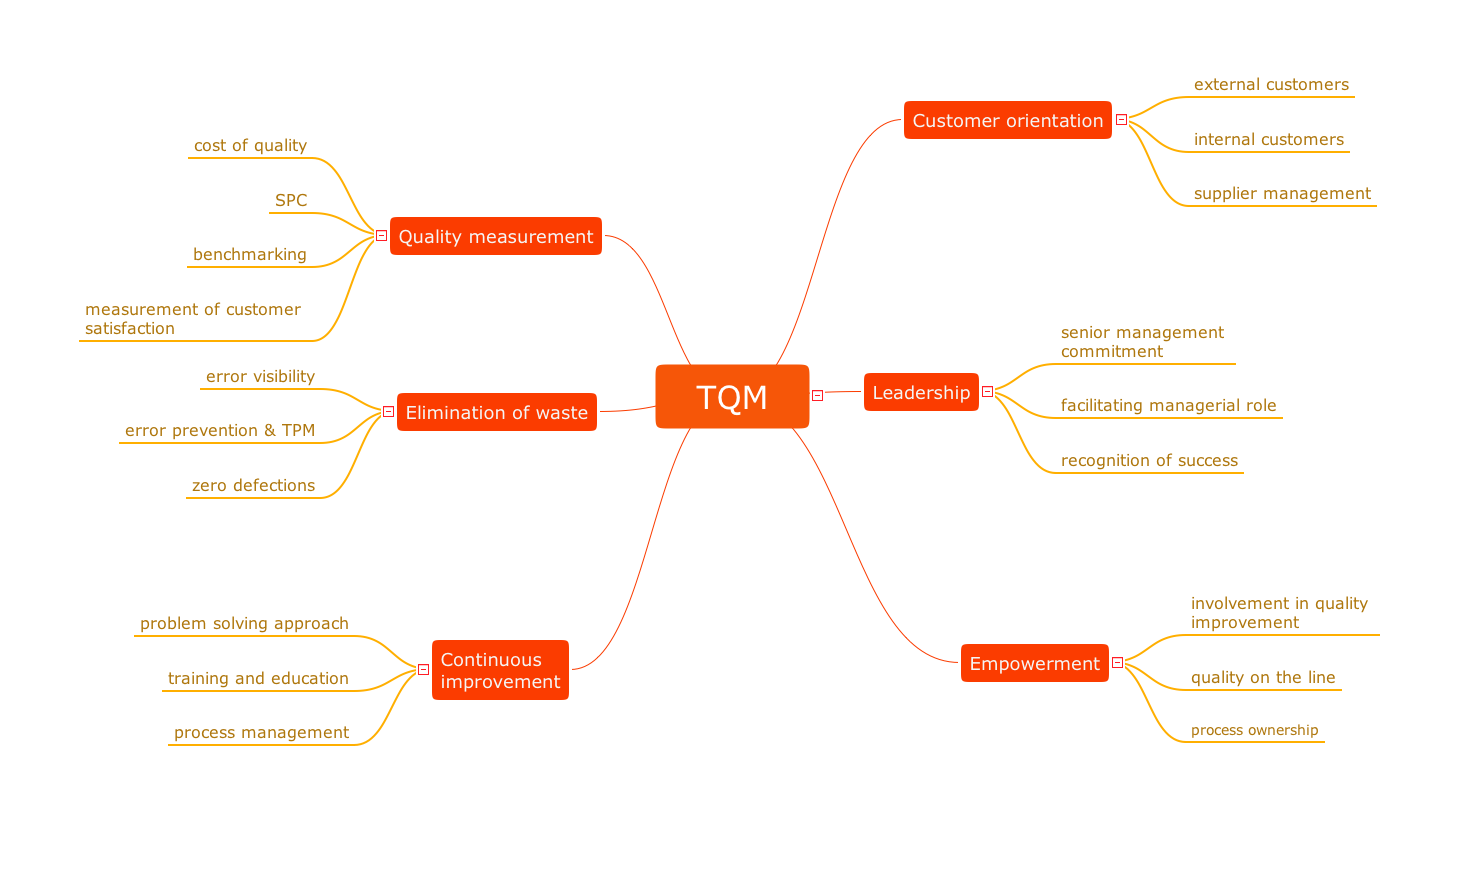
Picture: Quality issues in heir organization
Related Solution:
The UML Diagrams are widely used by developers and software engineers for professionally design and development any bank system or Automated Teller Machine (ATM) system. You need a powerful software for their design? ConceptDraw DIAGRAM extended with ATM UML Diagrams Solution from the Software Development Area of ConceptDraw Solution Park suits the best for this goal.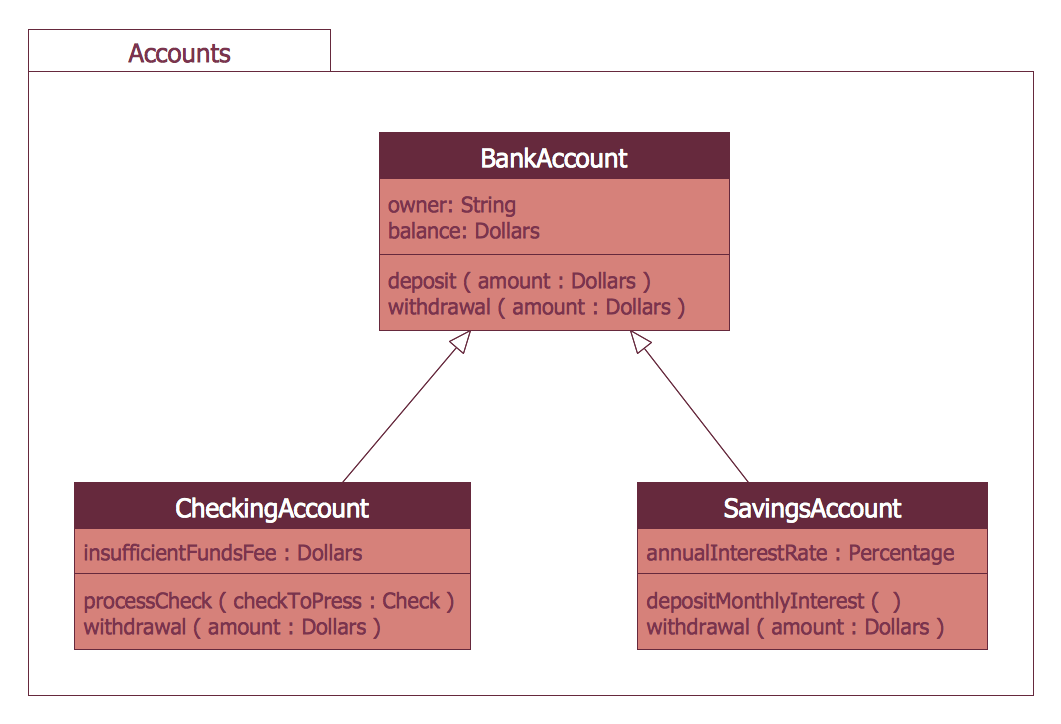
Picture: Bank System
Related Solution:
Processing Flow Chart is a simplified sketch used in chemical and process engineering to illustrate general plant streams, major equipment, and key control loops. ConceptDraw DIAGRAM enhanced with Flowcharts Solution is ideal software for designing ✔️ Processing Flow Charts, ✔️ Process Flow Charts, ✔️ Flow Chart Process Maps
Picture: Processing Flow Chart
Related Solution:
A functional organizational structure is a structure that consists of activities such as coordination, supervision and task allocation. You want to draw a functional organizational structure and look for the helpful software for this? Pay attention for the ConceptDraw DIAGRAM software! Extended with Organizational Charts Solution from the Management Area, it is ideal for functional organizational structure development.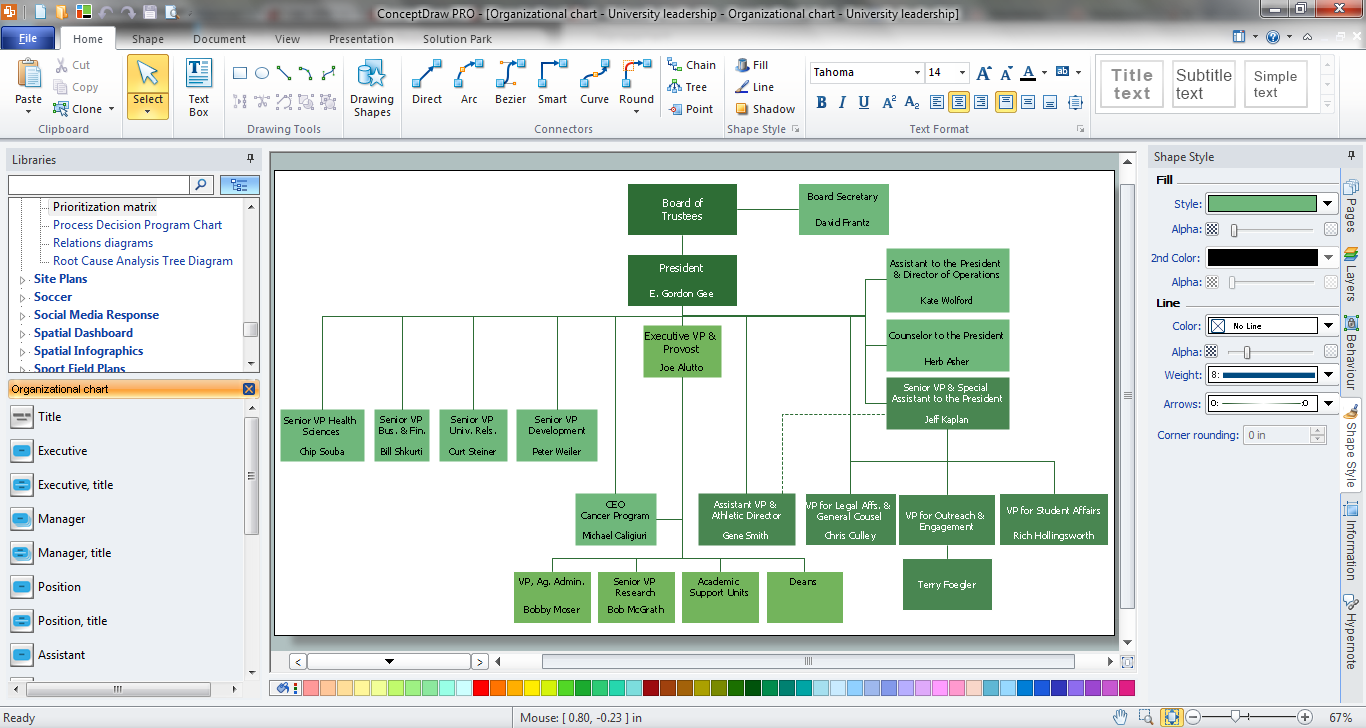
Picture: Functional Organizational Structure
Related Solution:
When it comes to system construction, a class diagram is the most widely used diagram. UML Class Diagrams is a type of static structure diagram that is used for general conceptual modeling of the systematics of the application. Such a diagram would illustrate the object-oriented view of a system. The object orientation of a system is indicated by a class diagram. It describes the structure of a system by showing the general issues,classes of a system, attributes, operations, interfaces, inheritance, and the relationships between them.
Picture: UML Class Diagram Notation
Related Solution:
ConceptDraw DIAGRAM - business process modeling software for mac offers the Business Process Diagram Solution with powerful tools to help you easy represent the business processes and create the business process diagrams based on BPMN 1.2 and BPMN 2.0 standards that allows to create of both simple and complex (nested) models of processes.
There are 16 BPMN 1.2 and BPMN 2.0 stencil libraries containing 230 vector objects: Rapid Draw library, Connections library, Gateways and Artifacts libraries, Data library, Gateways library, Choreographies library, Conversations library, Activities libraries, Events libraries, Expanded Objects libraries, Swim lanes libraries.
Picture: Business Process Modeling Software for Mac
Related Solution:
How to draw Metro Map style infographics of New York subway.
New York Subway has a long history starting on October 27, 1904. Since the opening many agencies have provided schemes of the subway system. At present time are 34 lines in use. This page present New York City subway map construct with Metro Map Solution in Conceptdraw DIAGRAM software. This is a one-click tool to add stations to the map. It lets you control the direction in which you create new stations, change lengths, and add text labels and icons. It contains Lines, Stations, and Landmarks objects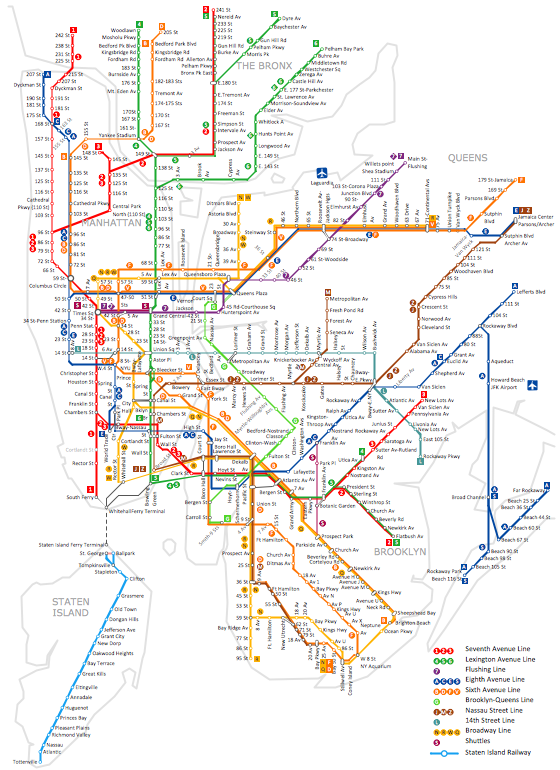
Picture: How to draw Metro Map style infographics? (New York)
Related Solution:
Gant Chart is a graphical representation of tasks as segments on a time scale. It helps plan and monitor project development or resource allocation. The horizontal axis is a time scale, expressed either in absolute or relative time.
Picture: Gant Chart in Project Management
Related Solution: