
Pic. 2. Accounting Information System flowchart
Flowcharts help users of Accounting Information System to understand the step sequences of accounting processes.
Use such professional flowchart maker as ConceptDraw DIAGRAM with Accounting Flowcharts solution to document and communicate visually how accounting processes work, and how each operation is done.

Pic. 3. Accounting Information System solution
All documents are vector graphic documents. They are available for reviewing, modifying or converting to a variety of formats (Bitmap Image, PDF, PowerPoint Presentation or MS Visio).
TEN RELATED HOW TO's:
ConceptDraw DIAGRAM is a professional software for creating great looking flowcharts. The samples included in this set of software allows users to draw any type of flowchart.
Picture: Flowchart Process Example
Related Solution:
A model of a system is defined as a set of hierarchical diagrams representing the asynchronous process of data transformation from the moment it is input to the system to the moment it is output to the user. To demonstrate how a process transforms the initial data, you should design a data flow diagram using a DFD Library included in ConceptDraw DIAGRAM Solution Park. Start your diagramming experience now!
You can use this library of symbols related to data flow diagrams (DFD) to design data-oriented or process-oriented models along with data process diagrams. This vector objects library It is a part of ConceptDraw solution designed for data flow diagramming, along with corresponding samples and templates. A data flow diagram is a 2D flowchart that depicts the sequence of particular activities and operations operations and activities which is accompanied by the dynamic flow of some data.
Picture: Design Data Flow. DFD Library
Related Solution:
Times when you had difficulties in searching for an appropriate software depending on your OS, had passed. If you still look for a great software to create flowcharts on Mac, here is the answer. ConceptDraw Pro is a great tool for creating diagrams, with tons of samples, libraries and tutorials.
Making flowchart diagram is the best way to represent a process as a sequence of steps. Flowcharting provides a simple way of organizing and representing data so that even complex and detailed processes become clear. That is why using a flowchart software tool is proven to be an ideal for structure and share an information on process workflow structure. This flow chart was created to depict the steps of certification process. This flow chart was created using ConceptDraw DIAGRAM software for Apple OS X. The Rapid Draw technology was used to create this flow chart. ConceptDraw DIAGRAM also supports popular Apple OS X features such as Quick Look, Full-Screen Mode, Version Browsing and Autosave. You can export your multi-page diagrams to SVG or graphic formats such as TIFF, JPEG, PNG and PDF.
Picture: Create Flow Chart on Mac: The Comprehensive Guide
Related Solution:
Timeline is a type of diagram which illustrates the series of events in a chronological order on a linear timescale. How to make a timeline? It is convenient to use a modern powerful software. ConceptDraw DIAGRAM diagramming and vector drawing software extended with Timeline Diagrams solution from the Management area is exactly what you need.
Picture: How to Make a Timeline
Related Solution:
ConceptDraw DIAGRAM diagramming and vector drawing software supplied with Chemical and Process Engineering Solution from the Industrial Engineering Area of ConceptDraw Solution Park is powerful and effective process engineering software.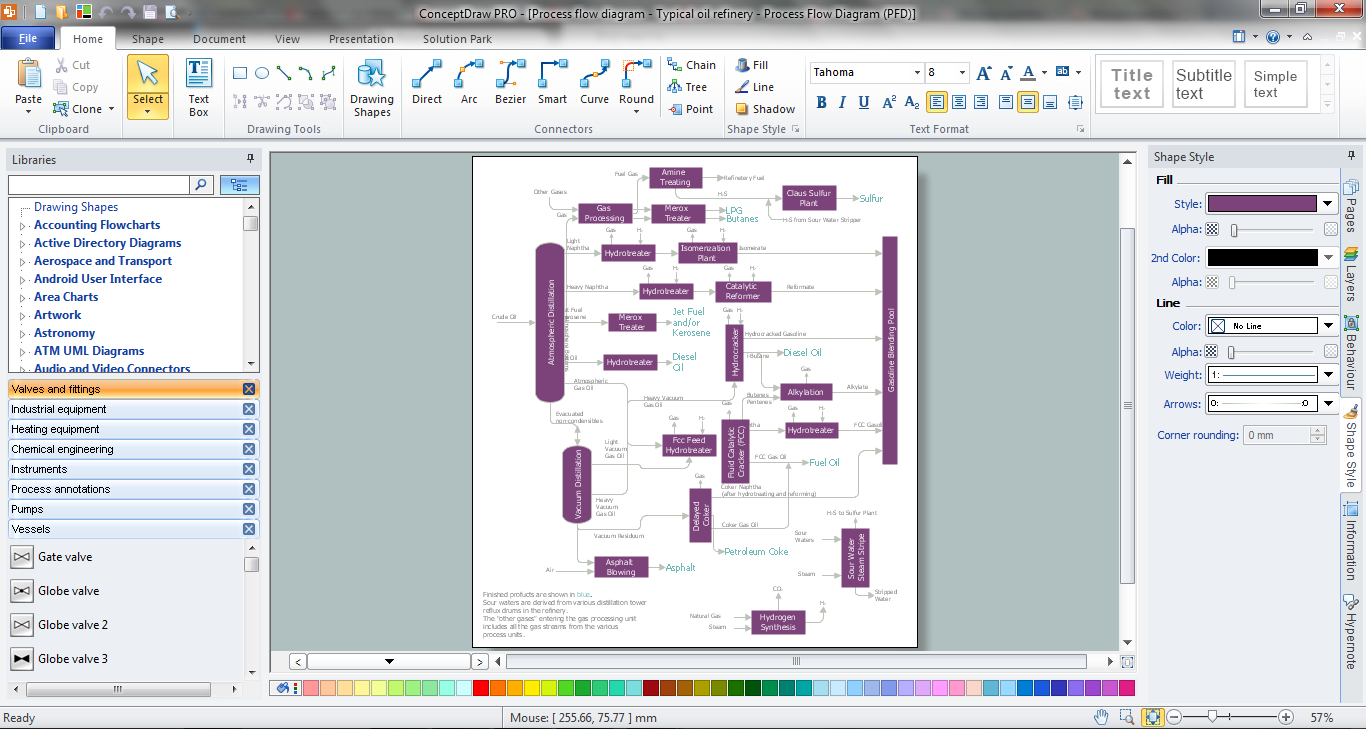
Picture: Process Engineering
Related Solution:
The Time-Money-Quality Triangle illustrates an advertising truism, that you can't have all three.
Picture: Pyramid Diagram
Related Solutions:
This pyramid chart example is supplied with the ConceptDraw Pyramid Diagrams solution. This is a model of Information Management Systems classification. It is made in a form of a four-level pyramid. The top level shows the information system developed for an executive management. Below, there is a level depicting the system of decision making process for the managers of the senior level. A schematic representation of the middle management information system, following to logic, is in the middle of the pyramid. And at least, the lowermost level represents an information processing system for employees.
Picture: Pyramid Diagram
Related Solutions:
ConceptDraw RapidDraw technology is a simple point-and-click design that helps create professional, presentation-ready business process diagrams quickly and efficiently.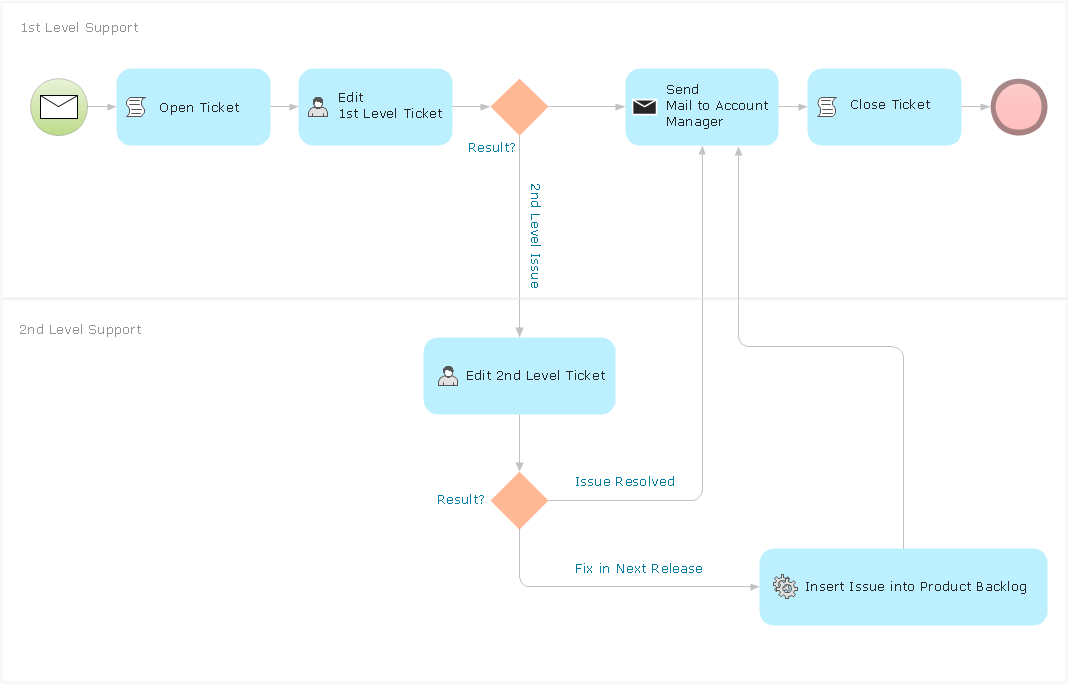
Picture: Business Process Management
Internet solutions on ConceptDraw base. What may interest developers of Internet solutions.
Picture: Software development with ConceptDraw products
Identify and Structure Factors. Use the Affinity Diagram to collect and structure factors that impact on a problem.
ConceptDraw OFFICE suite is a software for identify and structure factors with affinity diagram. This is a grouping and structuring of factors that impact on a problem.
Picture: PROBLEM ANALYSIS. Identify and Structure Factors

