Flowchart Maker
Common graphical software devided into: photo imaging tools, artistic tools, business graphic tools. Business graphic applications show a special knowledge representations and include many features for creating schematic pictures. These graphic tools are known as flowchart maker or flowchart maker software. Its main purpose is making presentation of thoughts using schematic drafts and pictures. Flowchart maker mostly used as critical documenting tool in business, science and education.

The common illustrated documents use schematic drafts to convey knowledge as a drawn presentation of thoughts. An abstract symbols of documents are graphical signs used to explain interactions between objects, display sequence of actions or disclose an internal organization of something. These include precise drawings along with abstract exposition and both are subject to standards. These illustrative symbols known as flowchart symbols. Usually these symbols are the part of a flowchart maker and gathered into sets of interaction, sequence and organization.
There are many special industry standards for abstract symbols used in business documenting. Following the standards flowchart makers use special drawing technique to create documents and its main purpose is creating any drawn representation using industry standard graphic symbols. That type of pictures are knows as schematic drafts and schematic flowchart pictures.
Standard flowchart symbols divided into different types: standard symbols, branded set and authored. The classic flowchart maker deliver thousands of symbols following almost all industries standards. Besides, the branded sets are subject for user licensing conditions and these symbols shapes do not regulated by standards, these are representational symbols. This type of representational symbols together with special conceptdraw software also known as flowchart maker branded symbols.
The rich sets of branded symbols represented by number of solutions from ConceptDraw Solution Park. These symbols from ConceptDraw Solution Park also known as flowchart symbols. It also delivered as an oposite to standard version with the number of abstract symbols.
A flowchart maker is a software showing the interaction, sequence or organization. It also known as flowchart maker or standard software of ConceptDraw DIAGRAM It supplied with different types of symbol collections: standard symbols, branded set and authored. It used strictly for enhancing scientific or business documents with abstract explanatory pictures.

Example 1. This is an example of basic schematic picture combining both: precise drawings along with abstract exposition. This basic example created using standard flowchart maker of ConceptDraw DIAGRAM
TEN RELATED HOW TO's:
This sample shows the Business Report Pie Chart. The Pie Chart visualizes the data as the proportional parts of a whole, illustrates the numerical proportion. Pie Charts are very useful in the business, statistics, analytics, mass media.
Picture: Business Report Pie. Pie Chart Examples
Related Solution:
The Total Quality Management Diagram solution helps you and your organization visualize business and industrial processes. Create Total Quality Management diagrams for business process with ConceptDraw software.
Picture: TQM Diagram Example
Related Solution:
Pictures of Food represented on the food court signboards, show-cases, at the menus form the cafe style and attract clients. Bright, colorful and effective advertising increases the chance of visiting exactly this cafe among many in the food court. When visiting fast food at the food court, a potential client is enough to throw just a glance at the menu-board. ConceptDraw DIAGRAM software offers the Food Court solution from the Food and Beverage area of ConceptDraw Solution Park for easy designing unique pictures of food.
Picture: Pictures of Food
Related Solution:
Action Plan - For the action planning define people and groups involvement in corrective actions by roles, identify logical sequences of scheduled actions and critical path of problem solving, identify possible risks of action plan and propose preventive actions.
ConceptDraw Office suite is a software for decision making and action plan.
Picture: The Action Plan
Cisco icons are globally recognized and generally accepted as standard for network icon topologies. The ConceptDraw vector stencils library Cisco buildings contains 21 symbols for drawing the computer network diagrams using the ConceptDraw DIAGRAM diagramming and vector drawing software.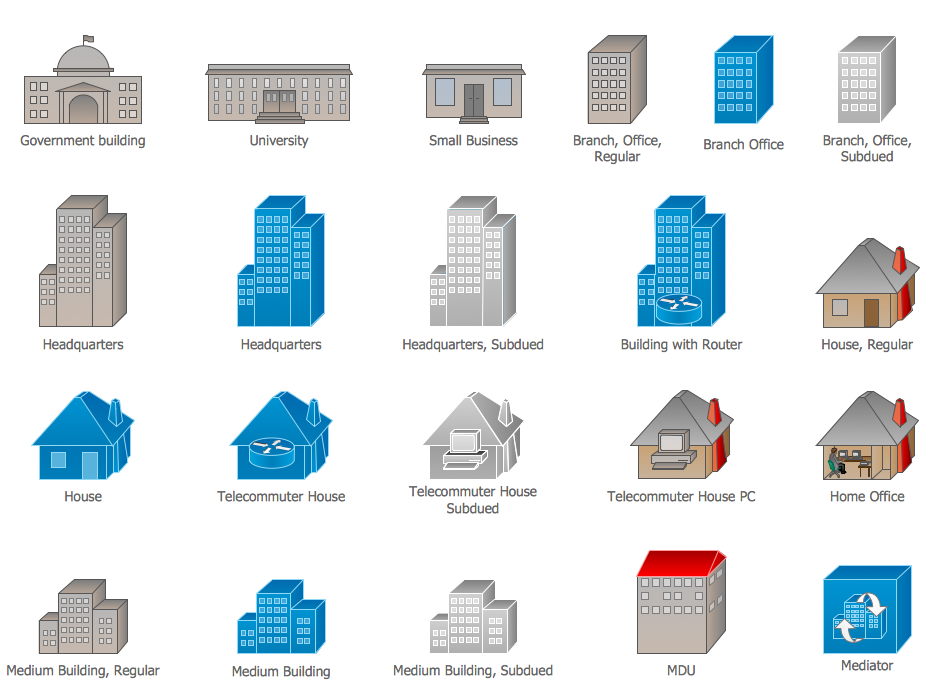
Picture: Cisco Buildings. Cisco icons, shapes, stencils and symbols
Related Solution:
Beginning from the 19th century, people tried to tame electricity. Nowadays, electrical engineering covers a wide range of applications starting from providing illumination in our homes to developing space technologies. Considering the fact that every project needs documentation, engineers use electrical diagram software to develop these projects. Standard electrical symbols of electrical components are recognizable all around the world.
This illustration represents the 26 libraries that are supplied by the ConceptDraw Electrical Engineering solution. The Electric Engineering libraries contains about a thousand objects enabling you to draw various charts depicting electrical connections and circuits, along with schemes of different equipment and devices. The electric engineering libraries delivered with ConceptDraw solution meet the standards adopted in the image to electrical circuits. So they can be used by professionals along with amateurs in electrical engineering.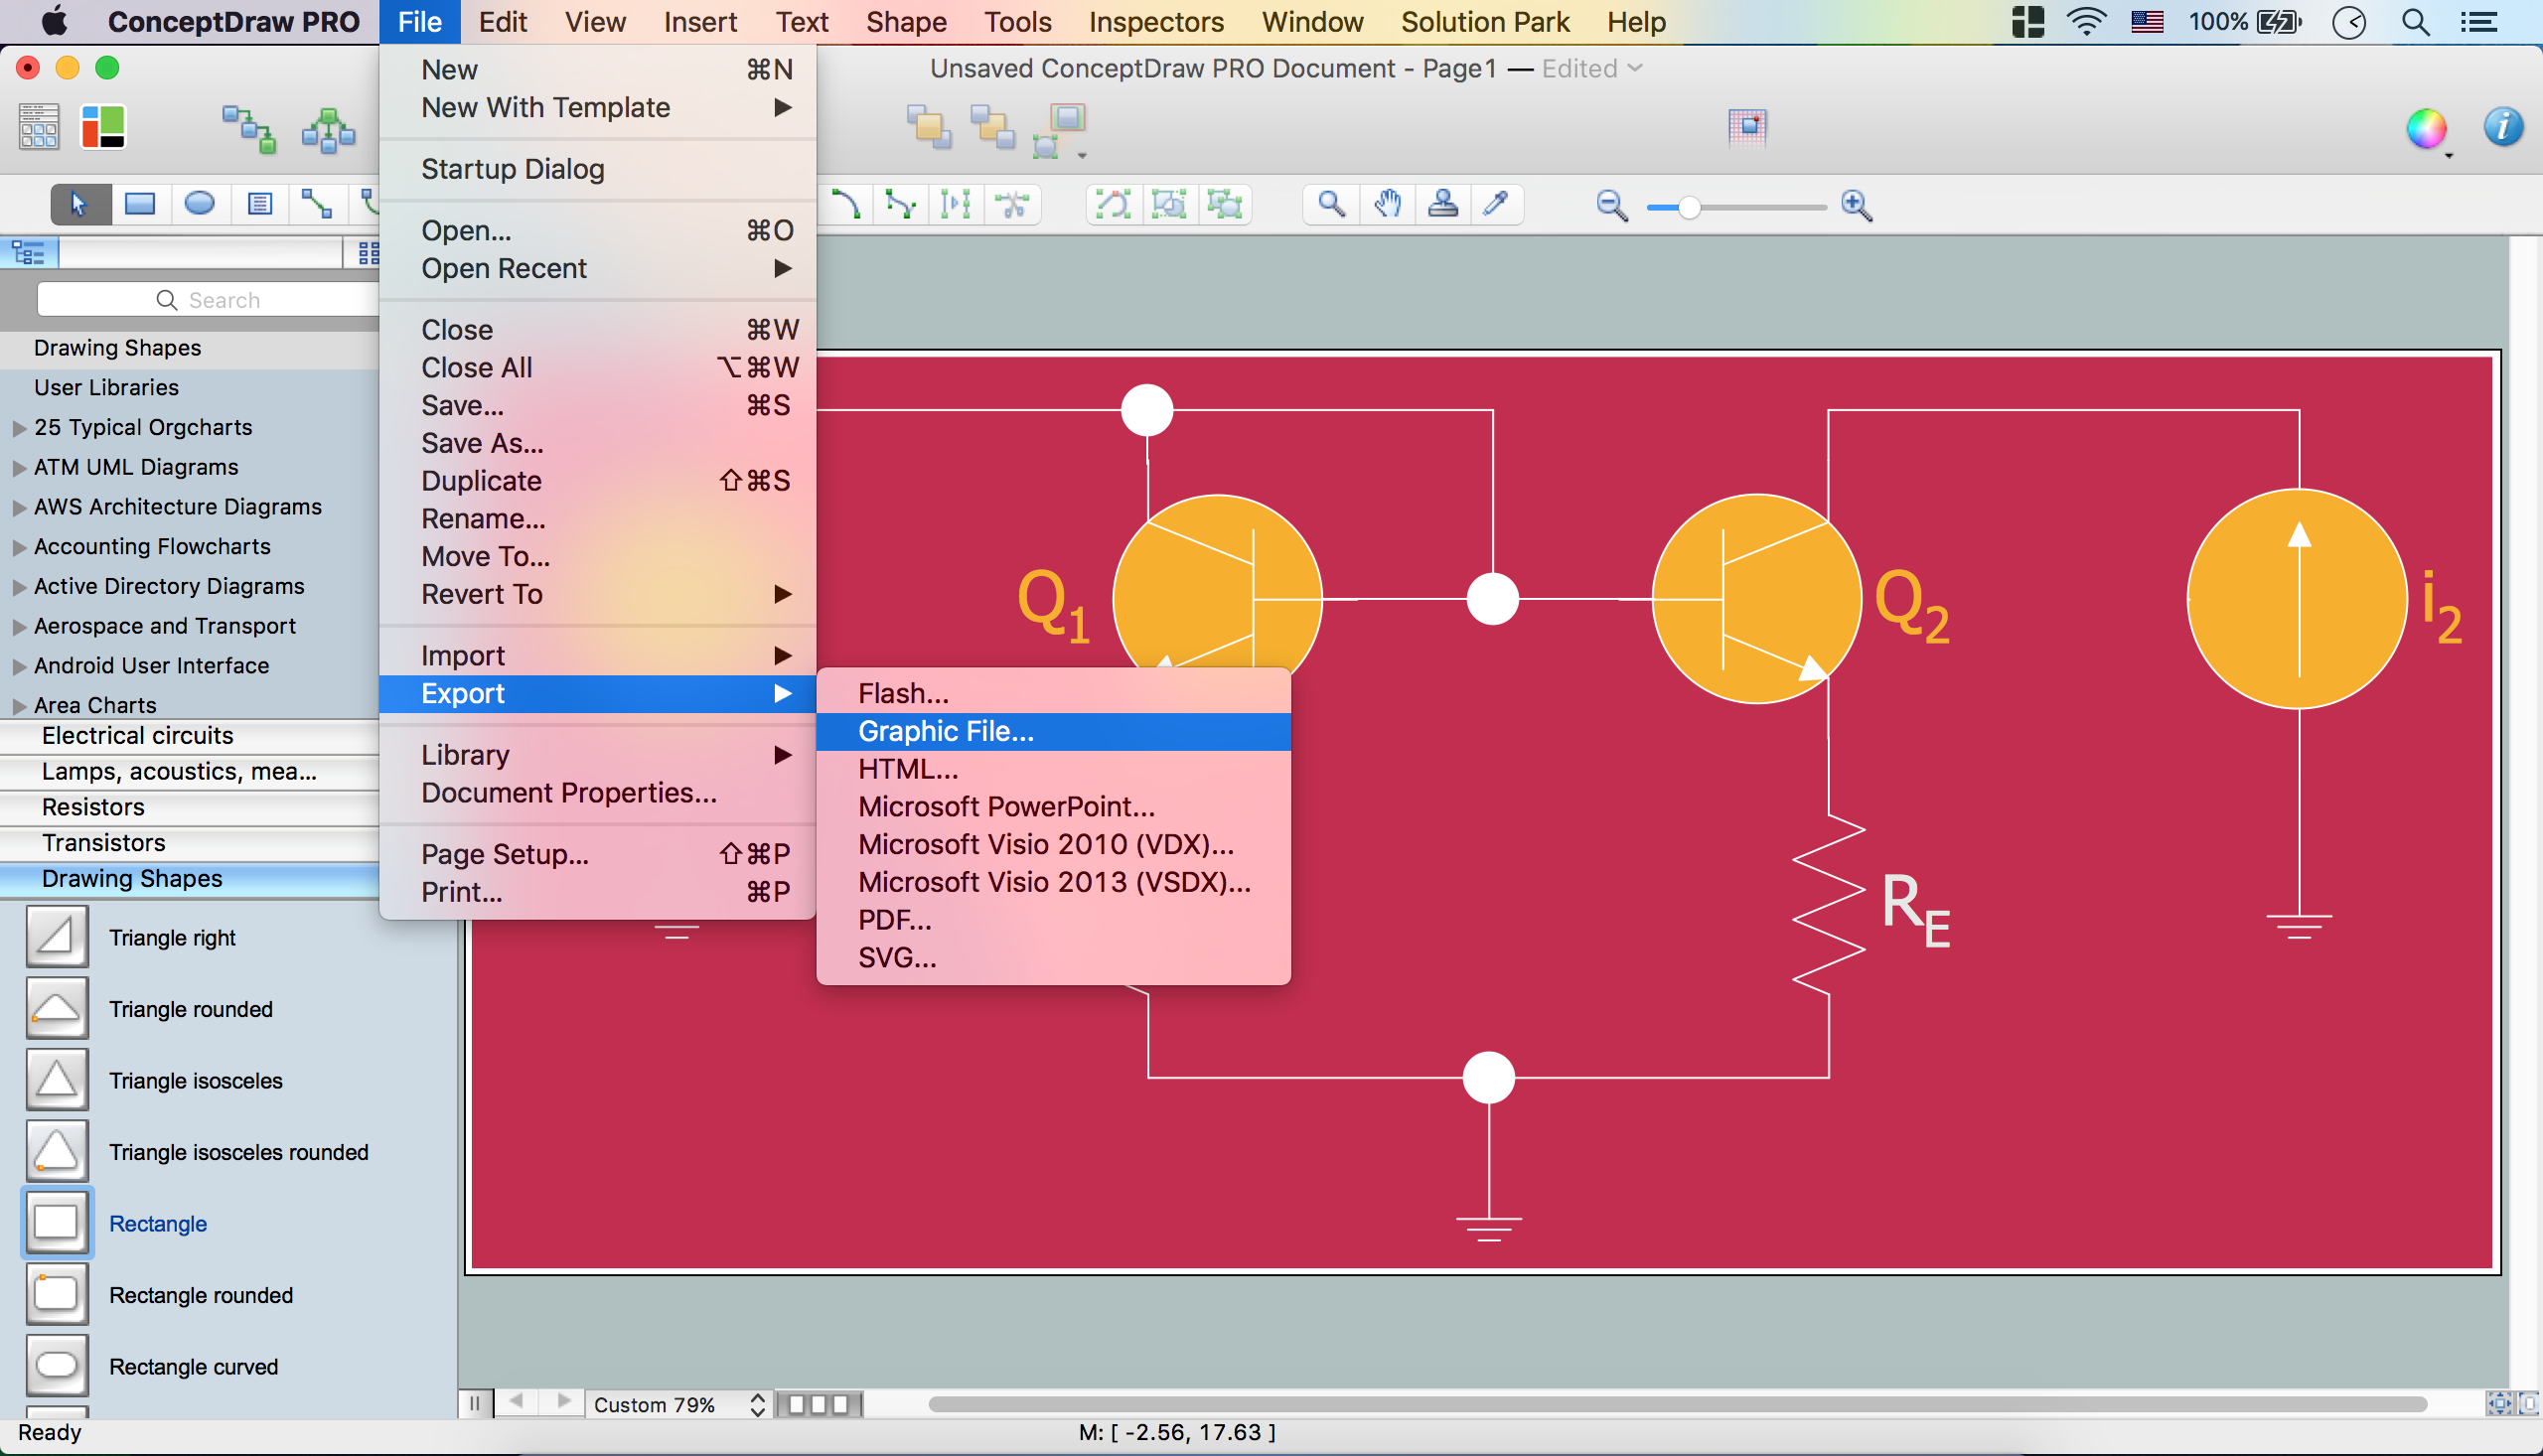
Picture: Electrical Diagram Software
Related Solution:
Enjoy the flowcharting process with the intuitive interface and powerful tools of the user-friendly ConceptDraw DIAGRAM software: ✔️ represent algorithms, ✔️ break down complex processes, ✔️ display workflows, ✔️ show procedures, ✔️ succeed in decision-making, ✔️ streamline processes, ✔️ increase productivity, ✔️ enhance efficiency
Picture: Flowcharting Software
Related Solution:
The Total Quality Management Diagram solution helps your organization visualize business and industrial processes. Create Total Quality Management diagrams for business process with ConceptDraw software.
Picture: Management Tools — Total Quality Management
Related Solution:
ConceptDraw DIAGRAM enhanced with Flowcharts Solution is the best flow chart maker online design software. Use it to ✔️ create clear and actionable Flowcharts, ✔️ improve decision-making, ✔️ enhance problem-solving in various scenarios, ✔️ enhance creativity and productivity across industries, ✔️ streamline workflows
Picture: Flow Chart Online
Related Solution:
Do you like the professional schemes that you can find on the Internet? Take into account that the most part of them is made using the Best Flowchart Software and Flowchart Symbols. Try you own powers in creating such diagrams!
Flowcharts are the most business diagramming tool. If you are a business manager, you can use flow chart to depict work flow in your organization, develop the effective organizational structure and present the information to investors or other stakeholders. Combining the smart management solutions with ConceptDraw DIAGRAM diagramming engine delivers the set of comprehensive flowchart tools necessary to support professionals in their creativeness and business activity.
Picture: Best Flowchart Software and Flowchart Symbols
Related Solution:

")
")