Flowchart Software: Tools for Process and Workflow Diagramming
Last updated: 2026
Compare flowchart software by type, features, and workflow fit. Understand the difference between desktop and online tools and choose the right solution for your documentation or collaboration needs.
Quick answer: The best flowchart software depends on your workflow. Some tools are designed for quick browser-based collaboration, while others are better suited to structured documentation, reusable templates, standardized symbols, and export-ready process diagrams.
Flowchart software is a diagramming tool used to design, structure, and document workflows, processes, and decision paths using standardized flowchart symbols. Whether you are mapping business processes, visualizing workflows, or documenting systems, this type of software improves clarity, consistency, and collaboration.
These tools are also referred to as flowchart tools, diagramming applications, or workflow software, depending on their capabilities and use cases.
For a complete overview of process visualization concepts, symbols, and workflow structure, see our flowchart guide.
Most users comparing flowchart software are not just looking for a drawing tool. They are evaluating how well a diagramming application supports structured workflows, reusable templates, standardized symbols, export quality, and the level of collaboration required by their process documentation.
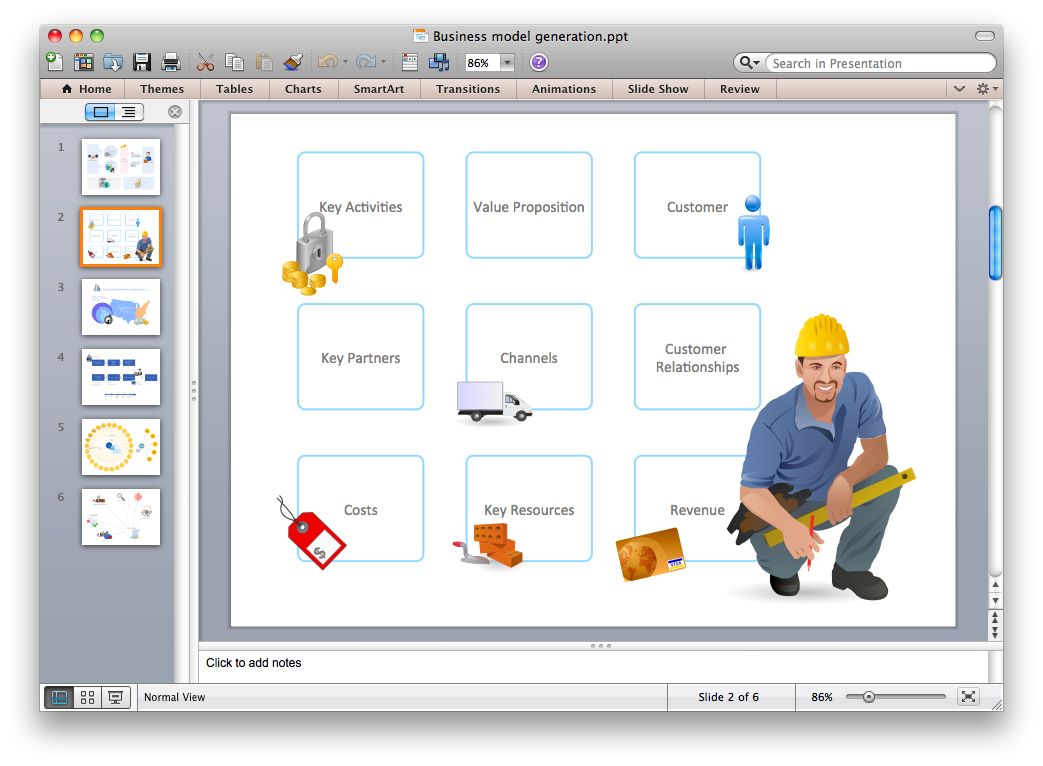
Flowchart Software in Practice
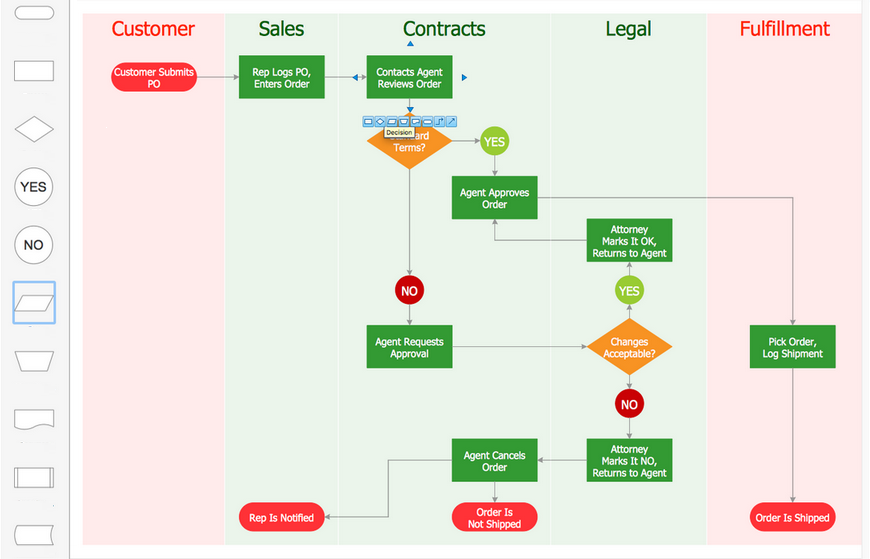
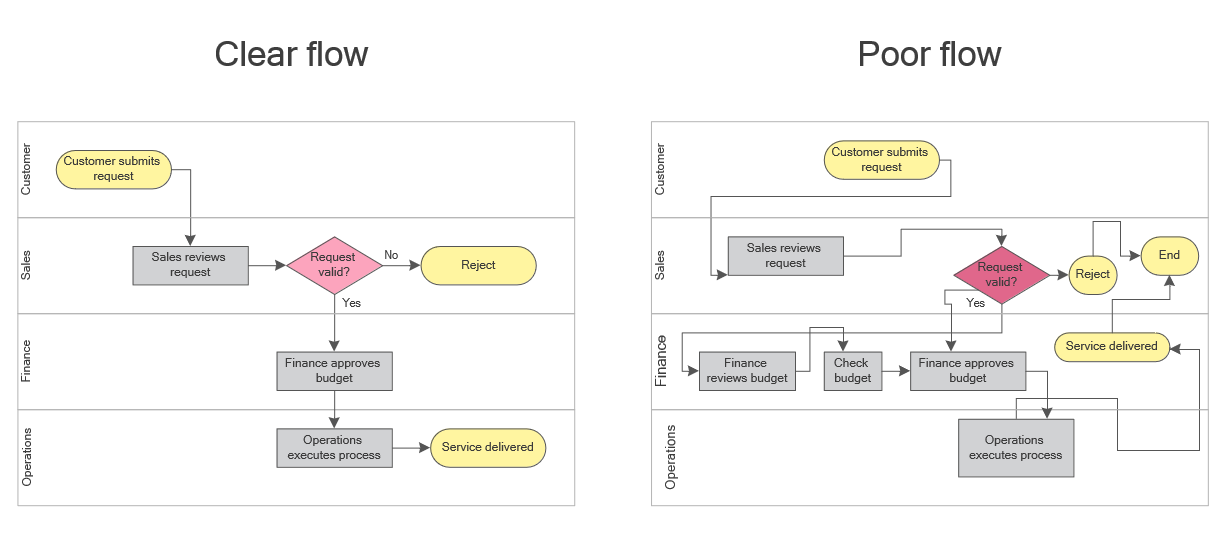
Example of a real workflow diagram created in flowchart software, demonstrating structured process mapping across multiple roles and decision points.
A strong flowchart software environment should support both quick diagram creation and long-term workflow maintenance. That includes templates for common process structures, clear symbol libraries, and output formats suitable for documentation, review, and reuse.
Best Flowchart Software and Tools
This comparison highlights common categories of flowchart software based on how workflows are created, shared, and maintained. The best choice depends on whether you prioritize collaboration, structured documentation, or enterprise-level process control.
| Tool / Category | Best For |
|---|---|
| Desktop diagramming software | Structured documentation, reusable workflow diagrams, file control, and export-ready process assets. |
| Browser-based flowchart tools | Real-time collaboration, quick diagram sharing, and distributed team workflows. |
| Enterprise process modeling platforms | Formal BPM, governance, and large-scale process management across complex organizations. |
| Lightweight diagram editors | Simple diagrams, quick visual notes, and basic workflow sketching for presentations or brainstorming. |
To better understand how flowchart software is used in practice, explore flowchart examples, learn the meaning of flowchart symbols, or review flowchart design principles.
Common tools in these categories include desktop diagramming applications, browser-based collaboration tools, and enterprise process modeling platforms.
This overview helps narrow down the type of flowchart software that fits your workflow before evaluating specific tools, features, and platforms.
What Is Flowchart Software?
Flowchart software is a type of diagramming application used to create flowcharts, process diagrams, and workflow visualizations that represent how tasks, decisions, and data move through a system.
It enables professionals to translate complex procedures into structured visual formats using standardized symbols such as processes, decisions, connectors, and terminators. These diagrams help simplify communication, clarify logic, and make workflows easier to analyze and improve.
Flowchart tools are used across business, technical, and operational contexts to document standard operating procedures, map approval paths, visualize systems, and support structured decision-making.
Unlike informal sketching tools, professional flowchart software provides symbol libraries aligned with process notation standards, layout control for readability, and export capabilities suitable for documentation and reporting.
For a broader understanding of flowchart concepts and notation, see our complete flowchart guide.
Why Flowchart Software Matters
Flowchart software is important because complex workflows are difficult to understand and maintain when they exist only in text, memory, or disconnected notes. Visual diagrams make processes clearer, easier to review, and more consistent across teams.
By representing steps, decisions, and dependencies visually, flowchart tools help reduce ambiguity, improve communication, and support more reliable execution of processes.
In business environments, this improves documentation quality, onboarding, and process standardization. In technical contexts, it helps structure system logic, troubleshoot workflows, and clarify decision paths.
The value of flowchart software is not only in drawing diagrams, but in making workflows easier to interpret, maintain, and reuse over time.
Key Features of Flowchart Software
Effective flowchart software should support both fast diagram creation and long-term workflow maintenance. The most useful tools are those that improve clarity, consistency, and usability of diagrams rather than simply offering drawing controls.

Concept visual showing the main capabilities users evaluate when choosing flowchart software.
| Feature | Why It Matters |
|---|---|
| Templates | Provide structured starting points and speed up diagram creation for common workflows. |
| Standardized symbols | Ensure consistency and readability across diagrams and teams. |
| Export formats | Enable diagrams to be used in reports, manuals, and presentations. |
| Collaboration options | Support different workflows, from real-time editing to controlled review processes. |
| Layout control | Improves readability in complex, multi-step workflows. |
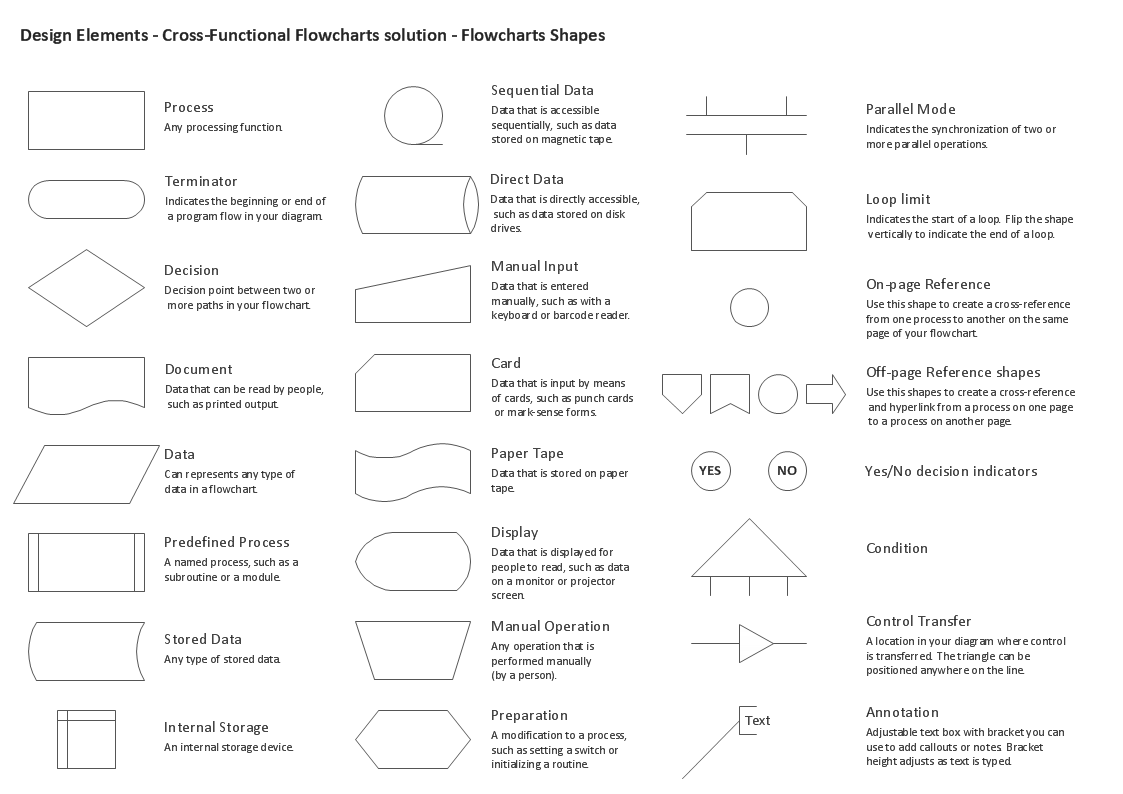
To explore symbol meaning and notation standards, see the flowchart symbols reference.
Types of Flowchart Software and Tools
Flowchart software is available in several categories depending on how diagrams are created, shared, and maintained. Each type supports a different workflow model, and the best choice depends on how your team works with diagrams.
| Type | Typical Use |
|---|---|
| Desktop diagramming software | Structured documentation, reusable workflow diagrams, file control, and export-ready process assets. |
| Browser-based flowchart tools | Real-time collaboration, quick diagram sharing, and distributed team workflows. |
| Enterprise process modeling platforms | Formal BPM, governance, and large-scale process management across complex organizations. |
| Lightweight diagram editors | Simple diagrams, quick visual notes, and basic workflow sketching. |
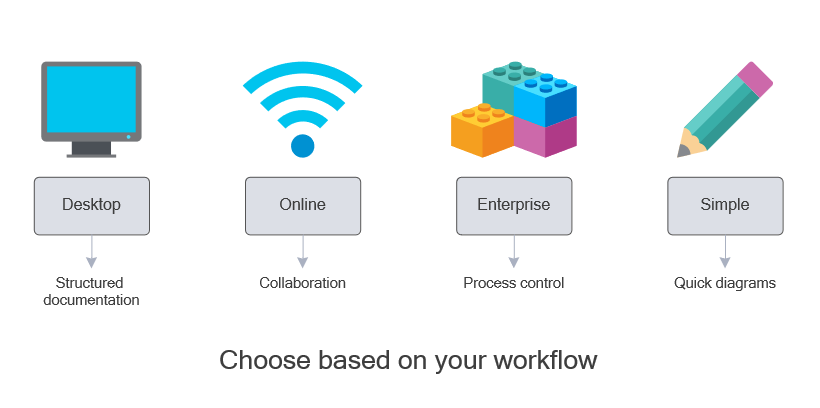
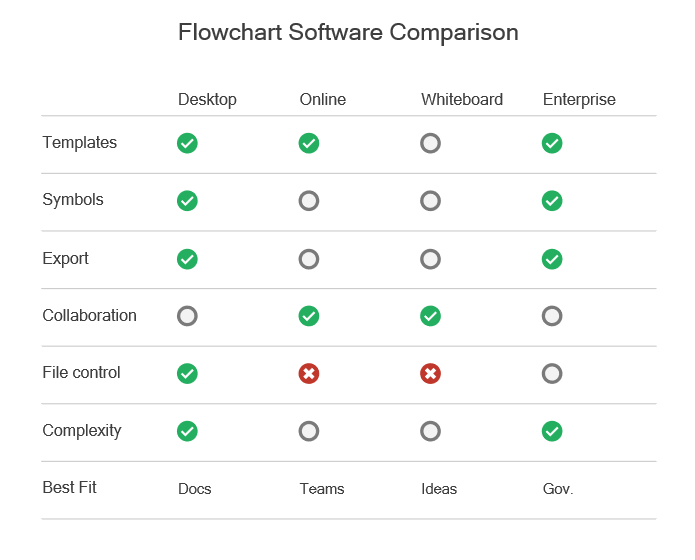
Visual comparison of flowchart software types showing how different tools are suited for documentation, collaboration, process management, and quick diagramming tasks.
These categories are not interchangeable. A tool designed for quick collaboration may not be suitable for long-term documentation, while a documentation-focused tool may provide more control than needed for simple diagrams.
Desktop vs Online Flowchart Software
One of the most important decisions when choosing flowchart software is whether to use a desktop application or an online tool. Each approach supports a different way of working with diagrams.
Decision-support visual contrasting documentation-first workflows with collaboration-first scenarios.
| Aspect | Desktop Flowchart Software | Online Flowchart Tools |
|---|---|---|
| Access | Installed locally and available offline | Browser-based and internet-dependent |
| File control | Direct control over storage, backup, and versioning | Managed within cloud workspaces |
| Collaboration | File sharing, review workflows, version control | Real-time co-editing and team collaboration |
| Best fit | Long-term documentation, SOPs, structured workflows | Brainstorming, workshops, fast team collaboration |
No single approach is universally better. Online tools are often preferred for fast collaboration, while desktop tools are better suited to structured documentation and long-term workflow assets.
The right choice depends on whether your diagrams are temporary working boards or maintained process documentation.
Flowchart Software Comparison
To compare flowchart software effectively, it is important to evaluate how different tools support workflow needs such as collaboration, documentation, file control, and long-term diagram maintenance.
The goal is not to identify a single “best” tool, but to understand which type of software fits your workflow.
Comparison visual helping evaluate tool categories before reviewing detailed platform differences.
| If your priority is… | ConceptDraw DIAGRAM | Lucidchart | Miro | Microsoft Visio |
|---|---|---|---|---|
| Full file ownership | Local storage | Cloud workspace | Cloud workspace | Local / SharePoint |
| Mac compatibility | Native Mac & Windows support | Browser-based | Browser-based | Web access on Mac, desktop on Windows |
| Offline work | Native desktop workflow | Limited depending on setup | Requires internet | Desktop supports offline |
| Collaboration approach | File sharing and review workflows | Real-time cloud collaboration | Real-time board collaboration | Varies by Microsoft environment |
| Templates & symbol depth | Structured libraries + templates | Strong | Strong for boards | Strong in Microsoft ecosystem |
| Export quality for manuals | High | Good | Good | High |
| Best fit | Documentation-driven users and small teams | Collaborative teams | Workshops and ideation | Windows-centered documentation environments |
No single tool is best for every scenario. Browser-based platforms are often preferred for live collaboration and fast iteration, while desktop-oriented tools are better suited to structured documentation, reusable process assets, and controlled workflows.
In practice, the right choice depends on how your diagrams are used — whether they are temporary working visuals or long-term documentation assets.
Which Flowchart Software Should You Choose?
If your primary goal is quick collaboration and team editing, browser-based tools are often the most efficient option.
If your diagrams need to be maintained over time, reused across documentation, and exported into reports or manuals, a more structured diagramming environment may be a better fit.
For workflows that require reusable templates, standardized symbols, and strong export control, tools designed for documentation-oriented use cases can provide more stability and consistency.
For example, desktop diagramming applications such as ConceptDraw DIAGRAM are often used in documentation-driven workflows where diagrams are part of long-term process assets rather than temporary collaboration boards.
How to Choose the Right Flowchart Software
Choosing the right flowchart software depends on how your diagrams are created, used, and maintained over time. The best tool is not necessarily the one with the most features, but the one that fits your workflow.
Before selecting a tool, consider the following factors:
- Workflow complexity: Will you create simple diagrams or multi-step process maps with dependencies?
- Collaboration style: Do you need real-time co-editing or structured review and version control?
- Documentation role: Are diagrams temporary working visuals or long-term documentation assets?
- Export requirements: Will diagrams be used in reports, manuals, or presentations?
- Template and symbol needs: Do you require reusable workflow structures and standardized notation?
These criteria help narrow down the type of software that fits your use case before evaluating specific tools.
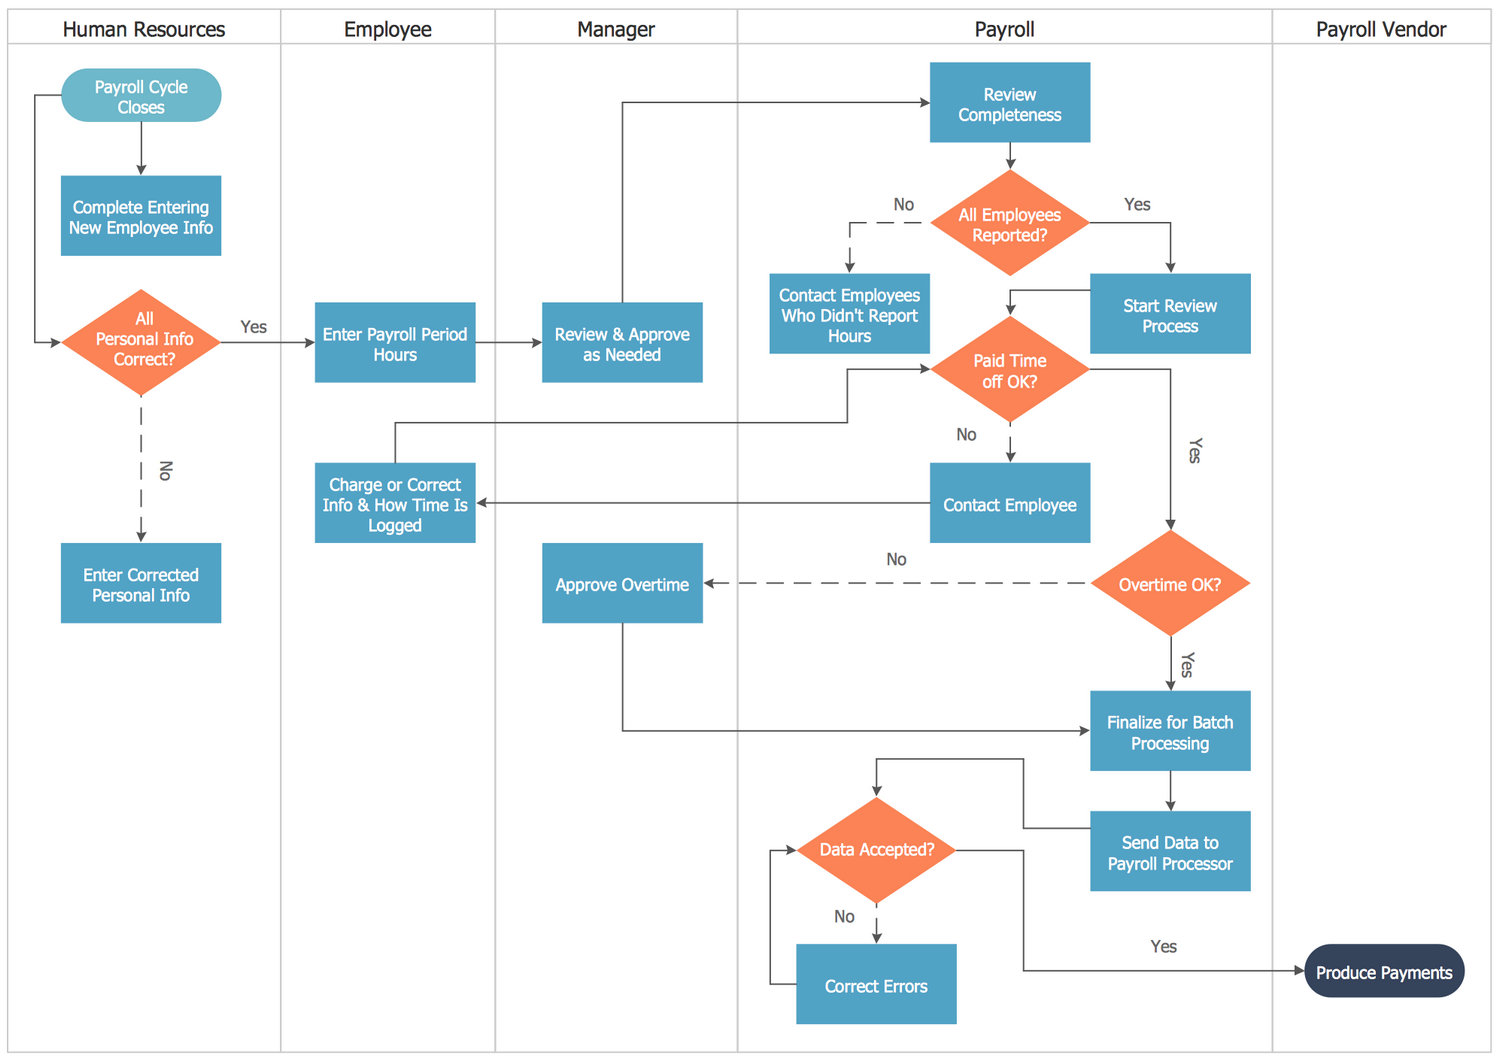
Example of a structured workflow where tool choice affects readability and maintainability.
Templates and Symbol Libraries
Templates and symbol libraries play a key role in how efficiently flowchart software can be used in real workflows. Instead of starting from a blank canvas, templates provide predefined structures that reflect common process patterns.
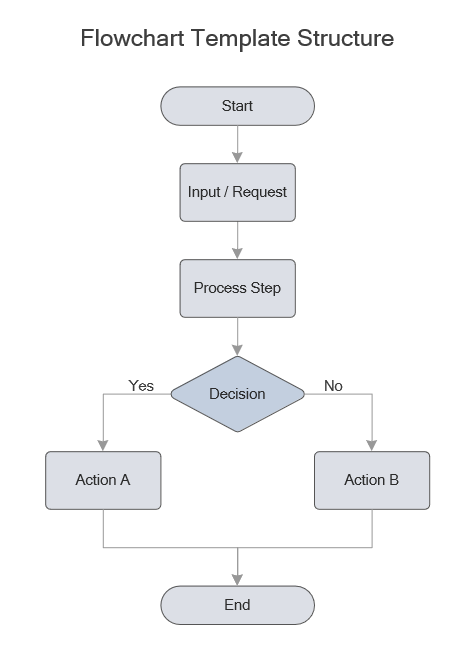
Example of a reusable workflow structure that helps standardize diagram creation and reduce setup time.
Templates improve speed and consistency, especially for repeatable processes such as approvals, onboarding workflows, service procedures, and system diagrams.
Symbol libraries are equally important. Standardized shapes ensure that diagrams remain readable and consistent across teams, projects, and documentation sets.
Together, templates and symbol libraries help transform flowchart software from a drawing tool into a structured documentation system.
Recommendation for Documentation-Focused Workflows
If your diagrams are part of structured documentation — such as SOPs, process manuals, technical workflows, or repeatable business procedures — choosing software that supports long-term diagram maintenance becomes important.
In these cases, tools that provide reusable templates, standardized symbol libraries, layout control, and reliable export formats tend to offer more consistency over time.
For example, desktop diagramming applications such as ConceptDraw DIAGRAM are often used in documentation-driven workflows where diagrams are maintained as process assets rather than temporary collaboration boards.
This type of solution is especially relevant when diagrams need to remain readable outside the editor, be reused across projects, and integrated into formal documentation systems.
Start Creating Flowcharts for Real-World Workflows
Move from simple diagrams to structured, reusable process documentation. Evaluate how a documentation-focused flowchart tool fits your workflow in practice.
Available for Mac and Windows. 21-day trial. No subscription required.
FAQ
Choosing flowchart software
- What is the best flowchart software?
- The best flowchart software depends on your workflow. Online tools are often better for collaboration, while desktop tools are more suitable for structured documentation, reusable diagrams, and long-term process assets.
- Is desktop flowchart software outdated?
- No. Desktop tools remain widely used in documentation-driven workflows where file control, offline access, and stable diagram performance are important.
- Should I choose online or desktop flowchart tools?
- Choose online tools for real-time collaboration and fast editing. Choose desktop tools for documentation, reusable workflows, and controlled file management.
Workflow and usage
- Can flowchart software handle complex workflows?
- Yes. Professional tools support multi-step processes, decision branches, and cross-functional workflows while maintaining readability.
- Why are templates important in flowchart software?
- Templates provide structured starting points, reduce setup time, and help maintain consistency across diagrams and documentation.
- How are flowcharts used in business processes?
- Flowcharts are used to document workflows, standard operating procedures, approval chains, onboarding processes, and system logic.
Features and capabilities
- What features should I look for in flowchart software?
- Key features include templates, standardized symbols, export formats, layout control, and collaboration options that match your workflow.
- Can flowcharts be used in documentation and reports?
- Yes. Flowcharts are commonly exported to PDF or image formats and included in manuals, presentations, and documentation systems.
- Do flowchart tools support reusable diagrams?
- Yes. Many tools support templates and reusable components that help standardize workflows across projects.