Sample 1. Sign Making Software
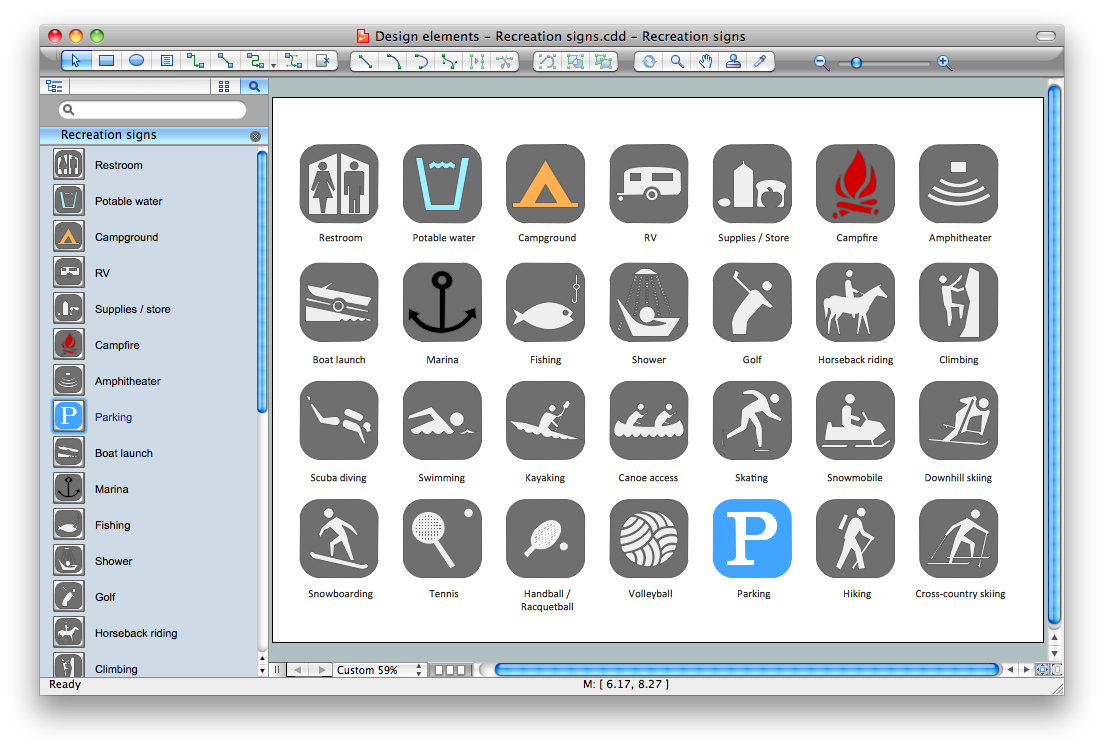
"Recreation signs" library from the Directional Maps solution contains 28 pictogram symbols for labeling the street and locator maps, road and route maps, transit and tourist maps with information signs. Nothing could be easier than create new document and drag the ready-to-use objects from the library. Or even use the predesigned sample or template from the Directional Maps solution and fill it to get excellent results in minutes.

Sample 2. Recreation Signs
The following features make ConceptDraw DIAGRAM the best Easy Sign Making Software:
- You don't need to be an artist to draw professional looking diagrams in a few minutes.
- Large quantity of ready-to-use vector objects makes your drawing diagrams quick and easy.
- Great number of predesigned templates and samples give you the good start for your own diagrams.
- ConceptDraw DIAGRAM provides you the possibility to use the grid, rules and guides. You can easily rotate, group, align, arrange the objects, use different fonts and colors to make your diagram exceptionally looking.
- All ConceptDraw DIAGRAM documents are vector graphic files and are available for reviewing, modifying, and converting to a variety of formats: image, HTML, PDF file, MS PowerPoint Presentation, Adobe Flash, MS Visio.
- Using ConceptDraw STORE you can navigate through ConceptDraw Solution Park, managing downloads and updates. You can access libraries, templates and samples directly from the ConceptDraw STORE.
- If you have any questions, our free of charge support is always ready to come to your aid.
TEN RELATED HOW TO's:
At the base of the identity of an organisational is its organizational culture.
Picture: Pyramid Diagram
Related Solutions:
Any information system receives data flows from external sources. In order to visualize them there is a list of data flow diagram symbols that describes how the system components cooperate. If you want to create a data flow diagram, ConceptDraw DIAGRAM Solution Park has DFD Library that contains both Yourdon and Gane-Sarson notations.
This figure shows the content of vector libraries, delivered with ConceptDraw solution for data flow diagram (DFD). There are three libraries composed from about 50 vector objects used to make data flow diagrams.
They include a complete set of objects utilized by Yourdon-Coad and Gane-Sarson notations - two primary notations that are apply for data flow diagramming. Also, one can discover additional "Data flow diagram (DFD)" library that provides a data flow diagram elements for designing level 1 and context-level data flow diagrams.
Picture: Data Flow Diagram Symbols. DFD Library
Related Solution:
ConceptDraw Flowcharts visualize a process or algorithm of program as step/operation blocks of various shapes connected with arrowed lines showed the process flow direction. They are used to visualize business or technical processes and software algorithms.
Picture: Selecting & Creating Flowcharts
Related Solution:
This sample was created in ConceptDraw DIAGRAM diagramming and vector drawing software using the Organizational Charts Solution from the Management area of ConceptDraw Solution Park.
The Organizational Chart is a diagram that shows the structure of the organization, different levels of management, hierarchy and the relationships of the organization parts.
Picture: Horizontal Org Flow Chart
Related Solutions:
ConceptDraw MINDMAP is the most productive tool you can use to solve problems and generate yout great ideas.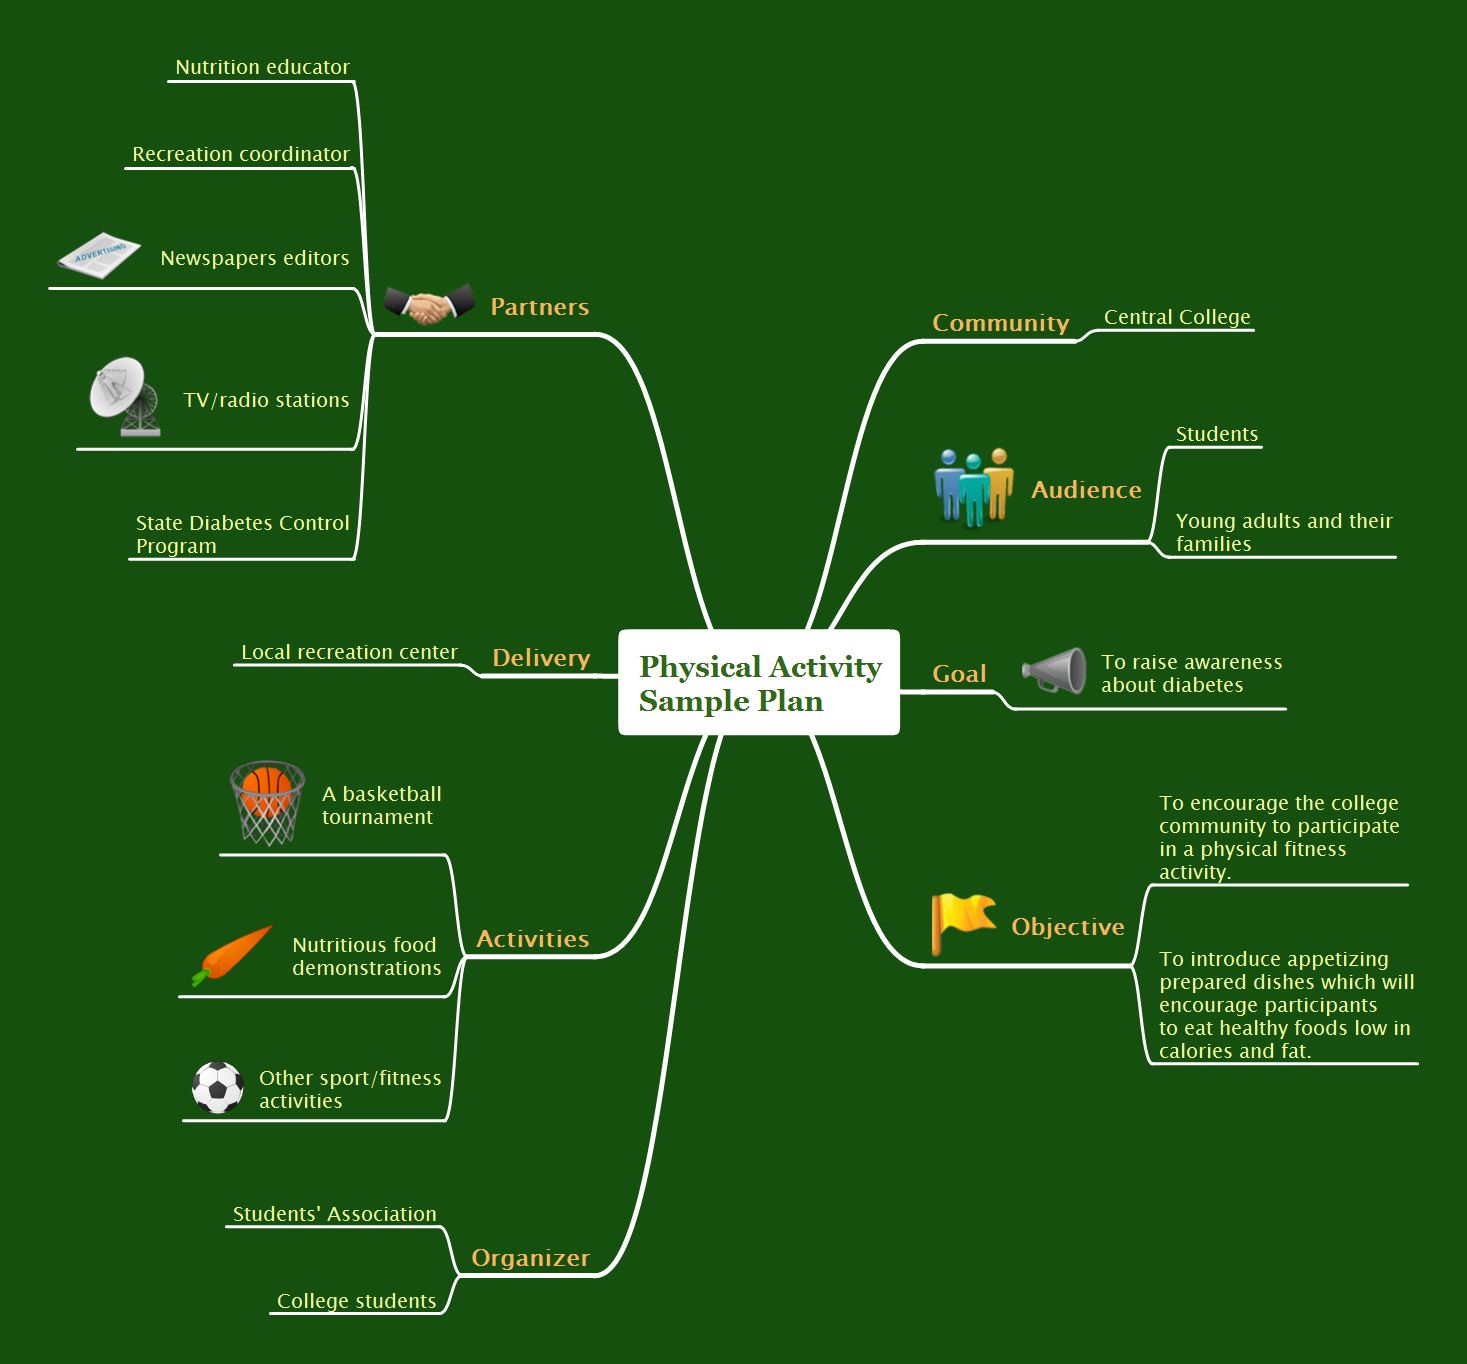
Picture: Professional & Powerful Mind Mapping Software
Related Solution:
Entity Relationship Diagram (ERD) is the world-known way to show the logical structure of databases in visual manner. The best software tool for drawing Entity-Relationship Diagram is ConceptDraw DIAGRAM vector graphics software with Entity-Relationship Diagram (ERD) solution from Software Development area which gives the ability to describe a database using the Entity-Relationship model. The vector graphic diagrams produced using this solution can be successfully used in whitepapers, presentations, datasheets, posters, or any technical materials.
Picture: Entity-Relationship Diagram
Related Solution:
It is convenient to represent various routes, directions, roads on the directional maps and navigation schemes. ConceptDraw DIAGRAM diagramming and vector drawing software supplied with Directional Maps Solution from the Maps Area of ConceptDraw Solution Park is effective for drawing Directions Maps.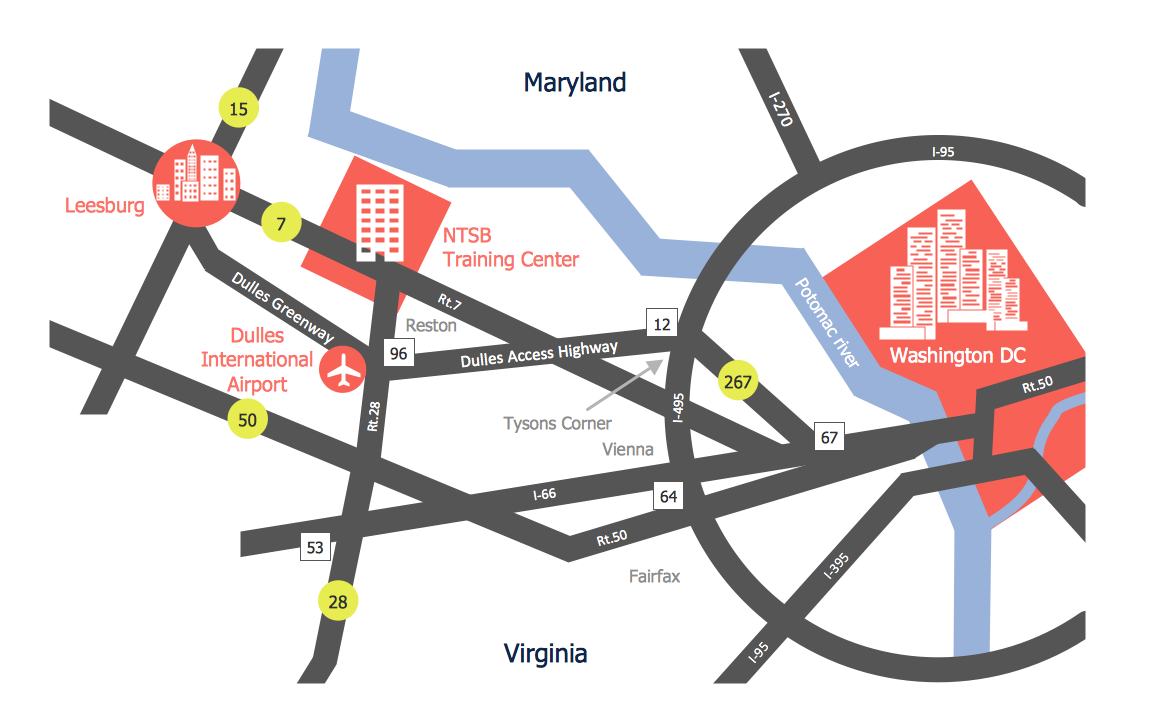
Picture: Directions Maps
Related Solution:
The art of arranging furniture and other decorations in space is called interior design. Some sites, like sport fields have tight restrictions in dimensions, but there's still a lot of work for a designer. You can help yourself to design such a plan with ConceptDraw DIAGRAM solution Sport Field Plans that contains elements of sport equipment and recreation plans.
This drawing represents the set of vector graphic objects that compose the Sport fields and Recreation library, supplied by ConveptDraw Sport Fields Plans solution. It can be used for drawing interior designs and layouts of sport fields and recreation zones. By using ConceptDraw with Sport Field Plans solution you can create professional plans for different sport fields: basketball, volleyball, football, tennis, golf, etc. Moreover, the use of this solutions enables making a site plans including green zone, pools, parkings - in short, what makes the recreation area, that usually accompanies sports facilities.
Picture: Interior Design. Sport Fields — Design Elements
Related Solution:
It is impossible to imagine mechanical engineering without drawings which represent various mechanical schemes and designs. ConceptDraw DIAGRAM diagramming and vector drawing software supplied with Mechanical Engineering solution from the Engineering area of ConceptDraw Solution Park offers the set of useful tools which make it a powerful Mechanical Drawing Software.
Picture: Mechanical Drawing Software
Related Solution:
Structure of a software product might get very complex and complicated, if software engineers did not pay much attention to the architecture of the product. It will take a few minutes to create UML diagrams with ConceptDraw DIAGRAM , because this software is just perfect for diagramming. You can alter ready-to-use templates, or make your own, whatever you need.
This illustration represent the example of UML diagram made by using ConceptDraw Rapid UML solution. This activity diagram displays the stages of the software development process similar to a flow chart. This diagram depicts the states of elements in the software system. It can be applied to represent software and coding logic. This UML diagram was drawn with the help of the ConceptDraw Rapid UML solution which supplies the kit of vector libraries, containing the symbols of the Unified Modeling Language notations.
Picture: UML Diagrams with ConceptDraw DIAGRAM
Related Solution: