Technical Drawing Software
Brief info about ConceptDraw — easy-to-use technical drawing software.Technical drawing or draft is a form of specialized graphic communication, exchange of ideas in industry and engineering. It is a visual representation of object with indication of dimensions and used material, constructed with maintaining the proportions between its parts. Technical drawings are constructed by architects, technologists, engineers, designers, drafters, and other technical professionals according to defined rules, specifications, internationally accepted standards and standardized notations allowing to make unambiguous, clear and understandable technical drawings. ConceptDraw Technical Drawing Software extended with:
from the Industrial Engineering Area is powerful software for business and technical drawing. Mechanical Engineering, Electrical Engineering, Chemical and Process Engineering Solutions from the Industrial Engineering Area offer you the useful tools for all kinds of technical drawing with pre-drawn shapes, free samples of business drawings and flowcharts. With ConceptDraw Technical Drawing Software you can easily design:
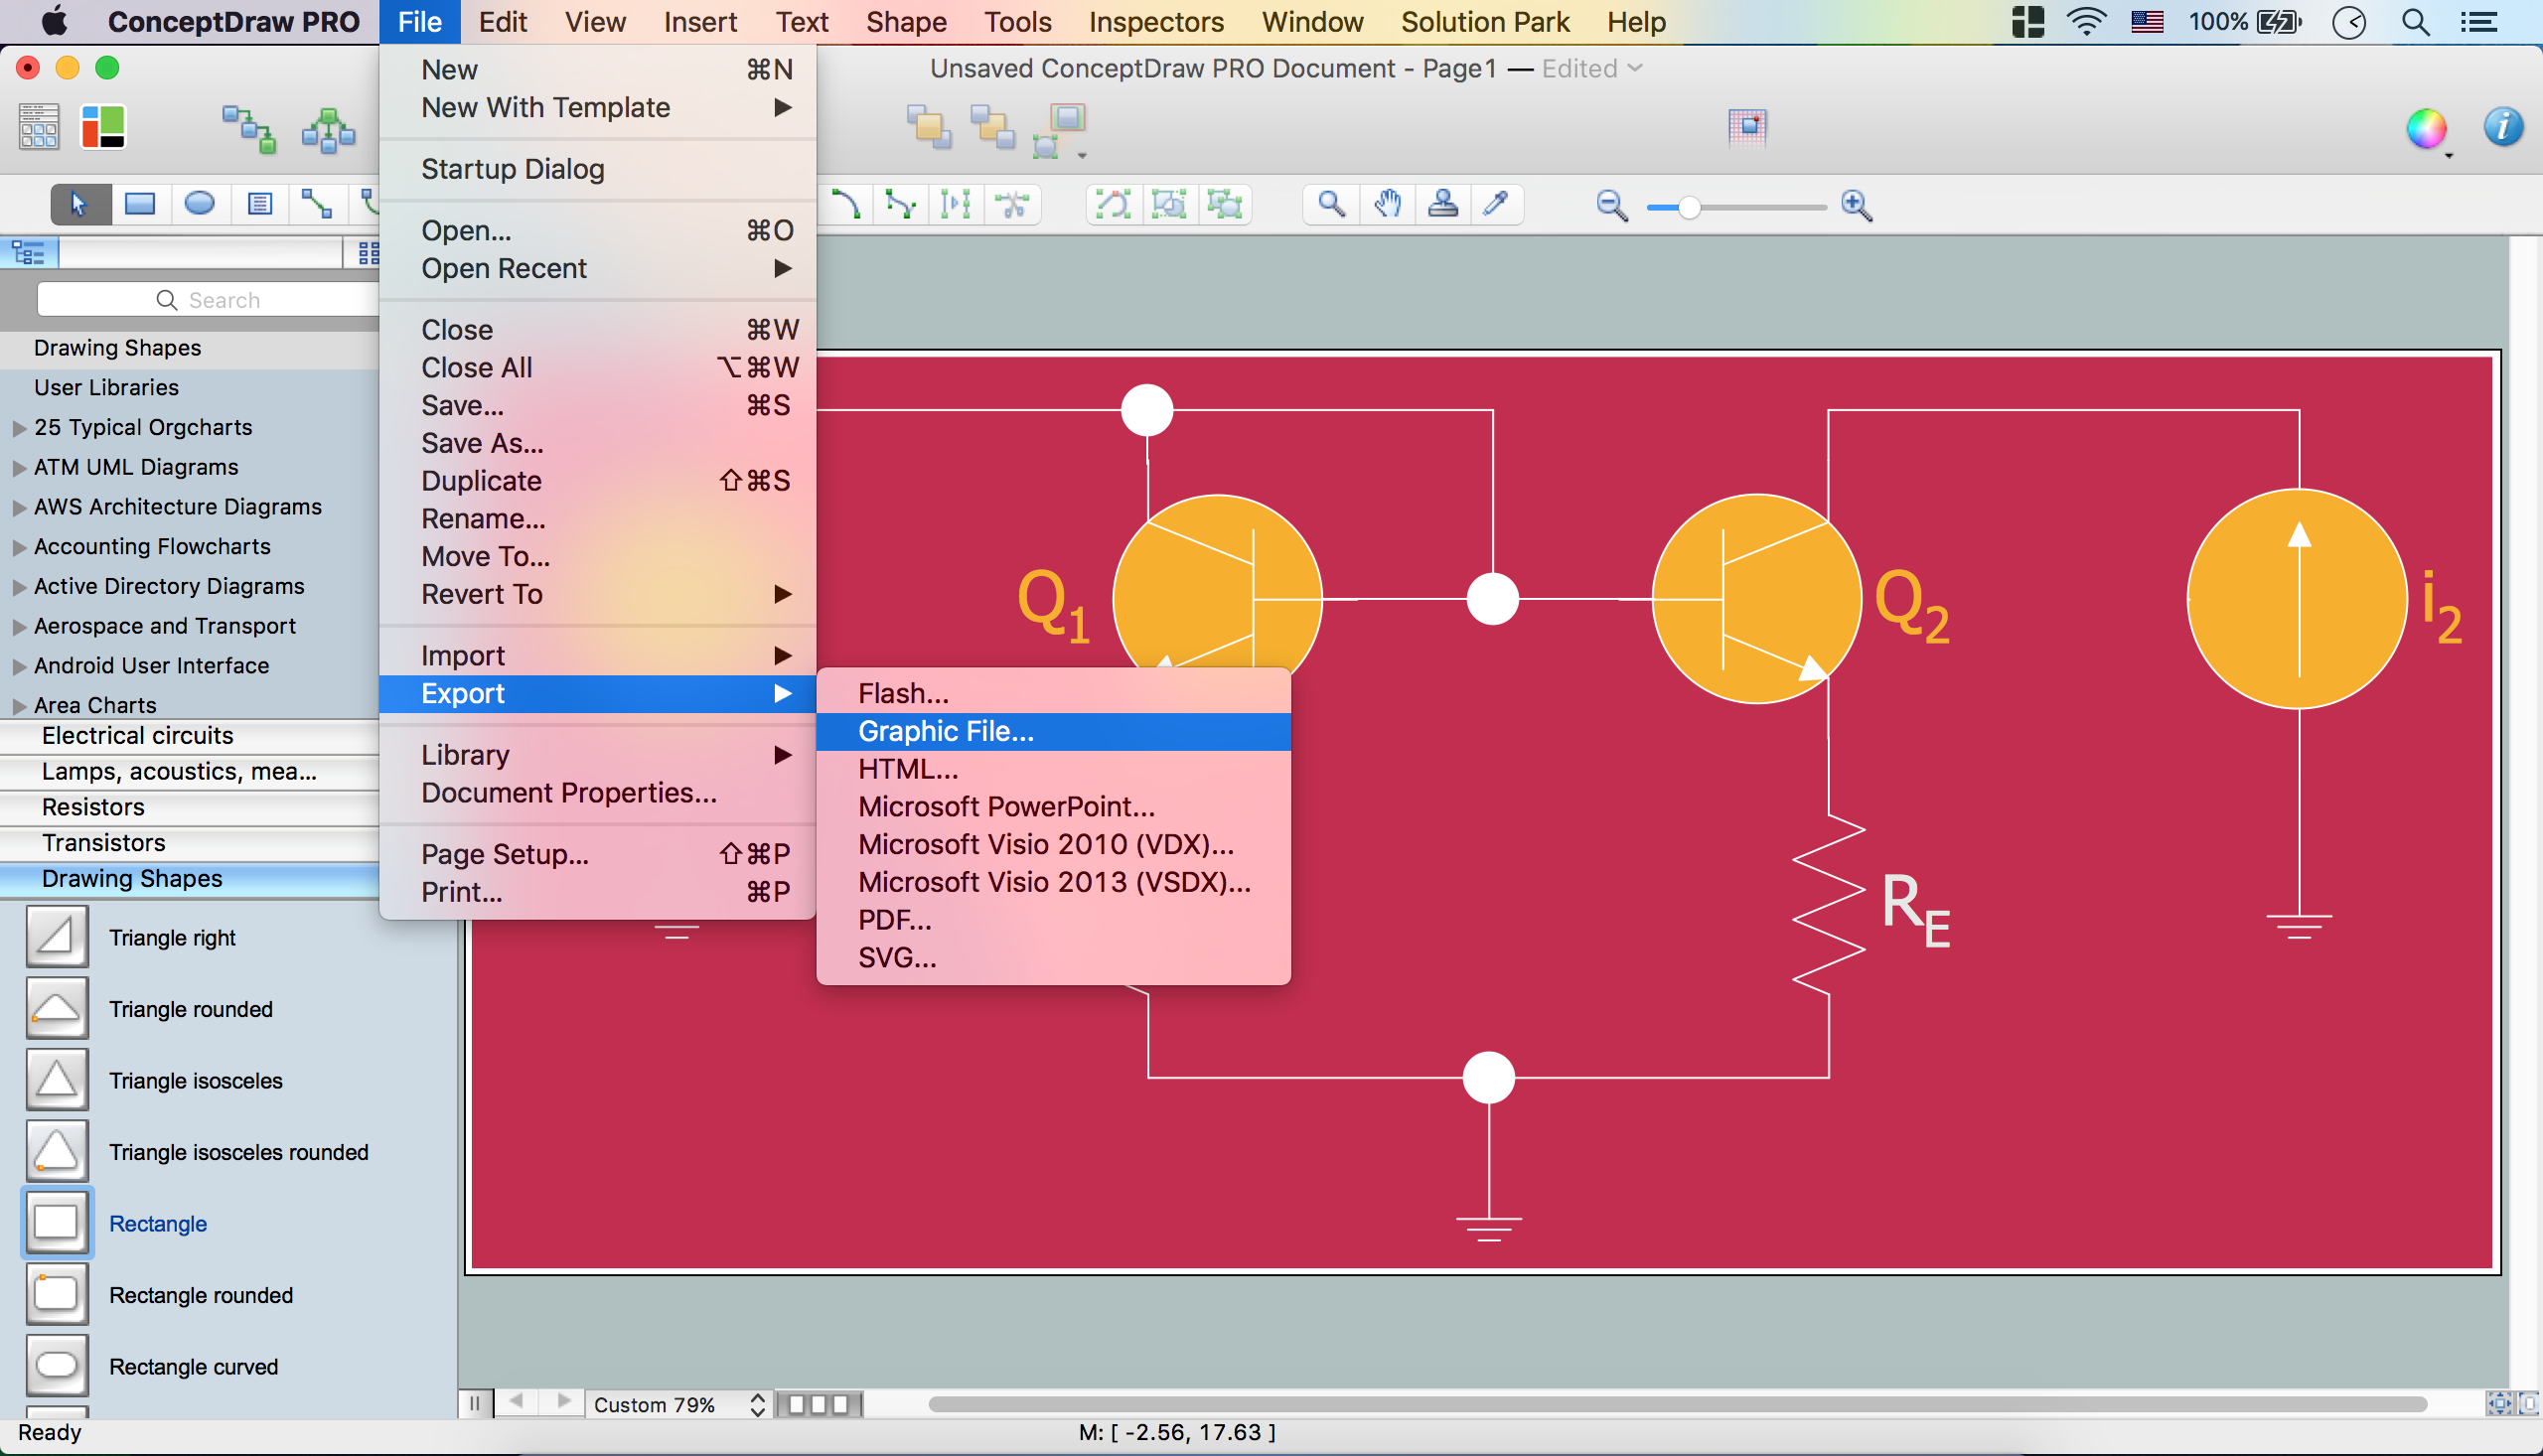
ConceptDraw DIAGRAM is the only professional technical drawing and vector diagramming software of its kind designed to work on both Macintosh OS X and Windows. It support for many graphic formats enables users to visually develop their technical drawings charts and diagrams in any combination of drawings, diagrams and flow charts.
ConceptDraw DIAGRAM Technical Drawing software offers you a wide set of templates and samples of technical drawing created with help of Mechanical Engineering, Electrical Engineering, Chemical and Process Engineering Solutions. They are available from ConceptDraw STORE.
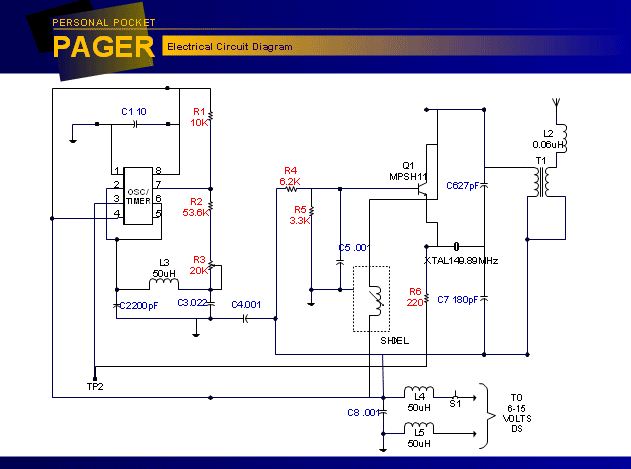
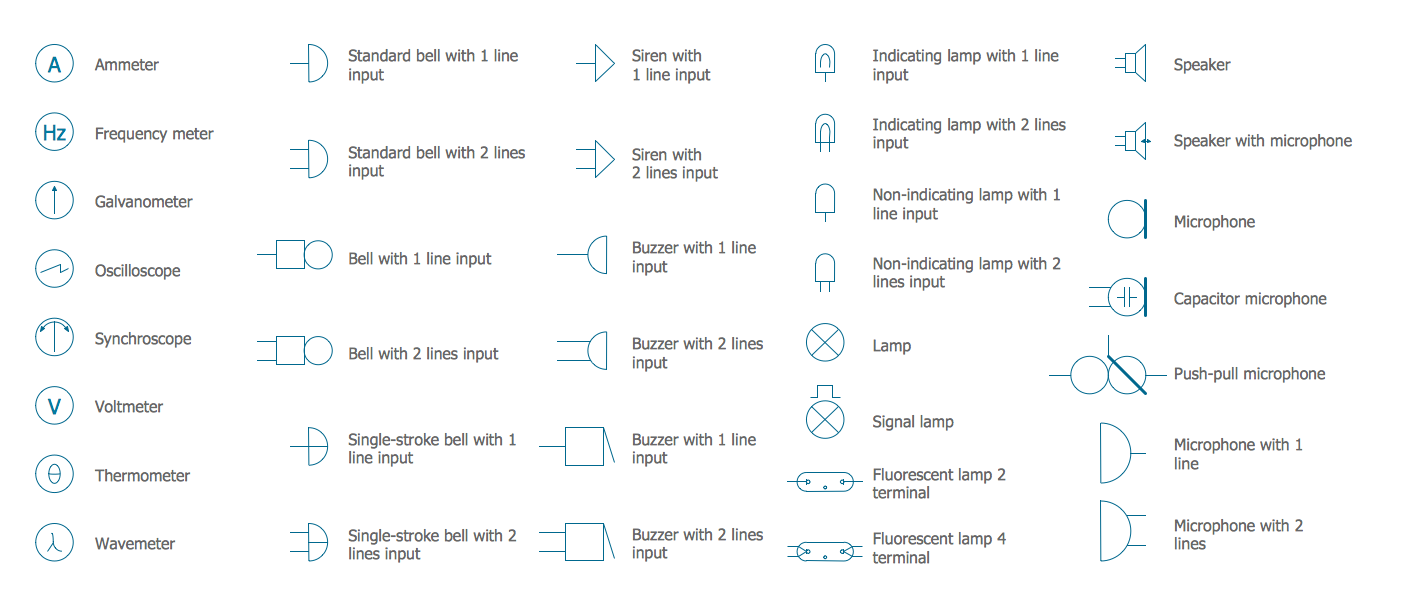
Use ConceptDraw Technical Drawing Software to create professional mechanical engineering documents, with elements relating to valve assembly, pumps and motors, dimensioning and tolerance, bearings, and welding; chemical processes; electrical schematics, digital and analog logic, circuit and wiring schematics and diagrams, power systems diagrams. |


ConceptDraw Technical Drawing Software works across any platform, meaning you never have to worry about compatibility again. ConceptDraw DIAGRAM allows you to make technical diagram on PC or macOS operating systems.
See also Samples:

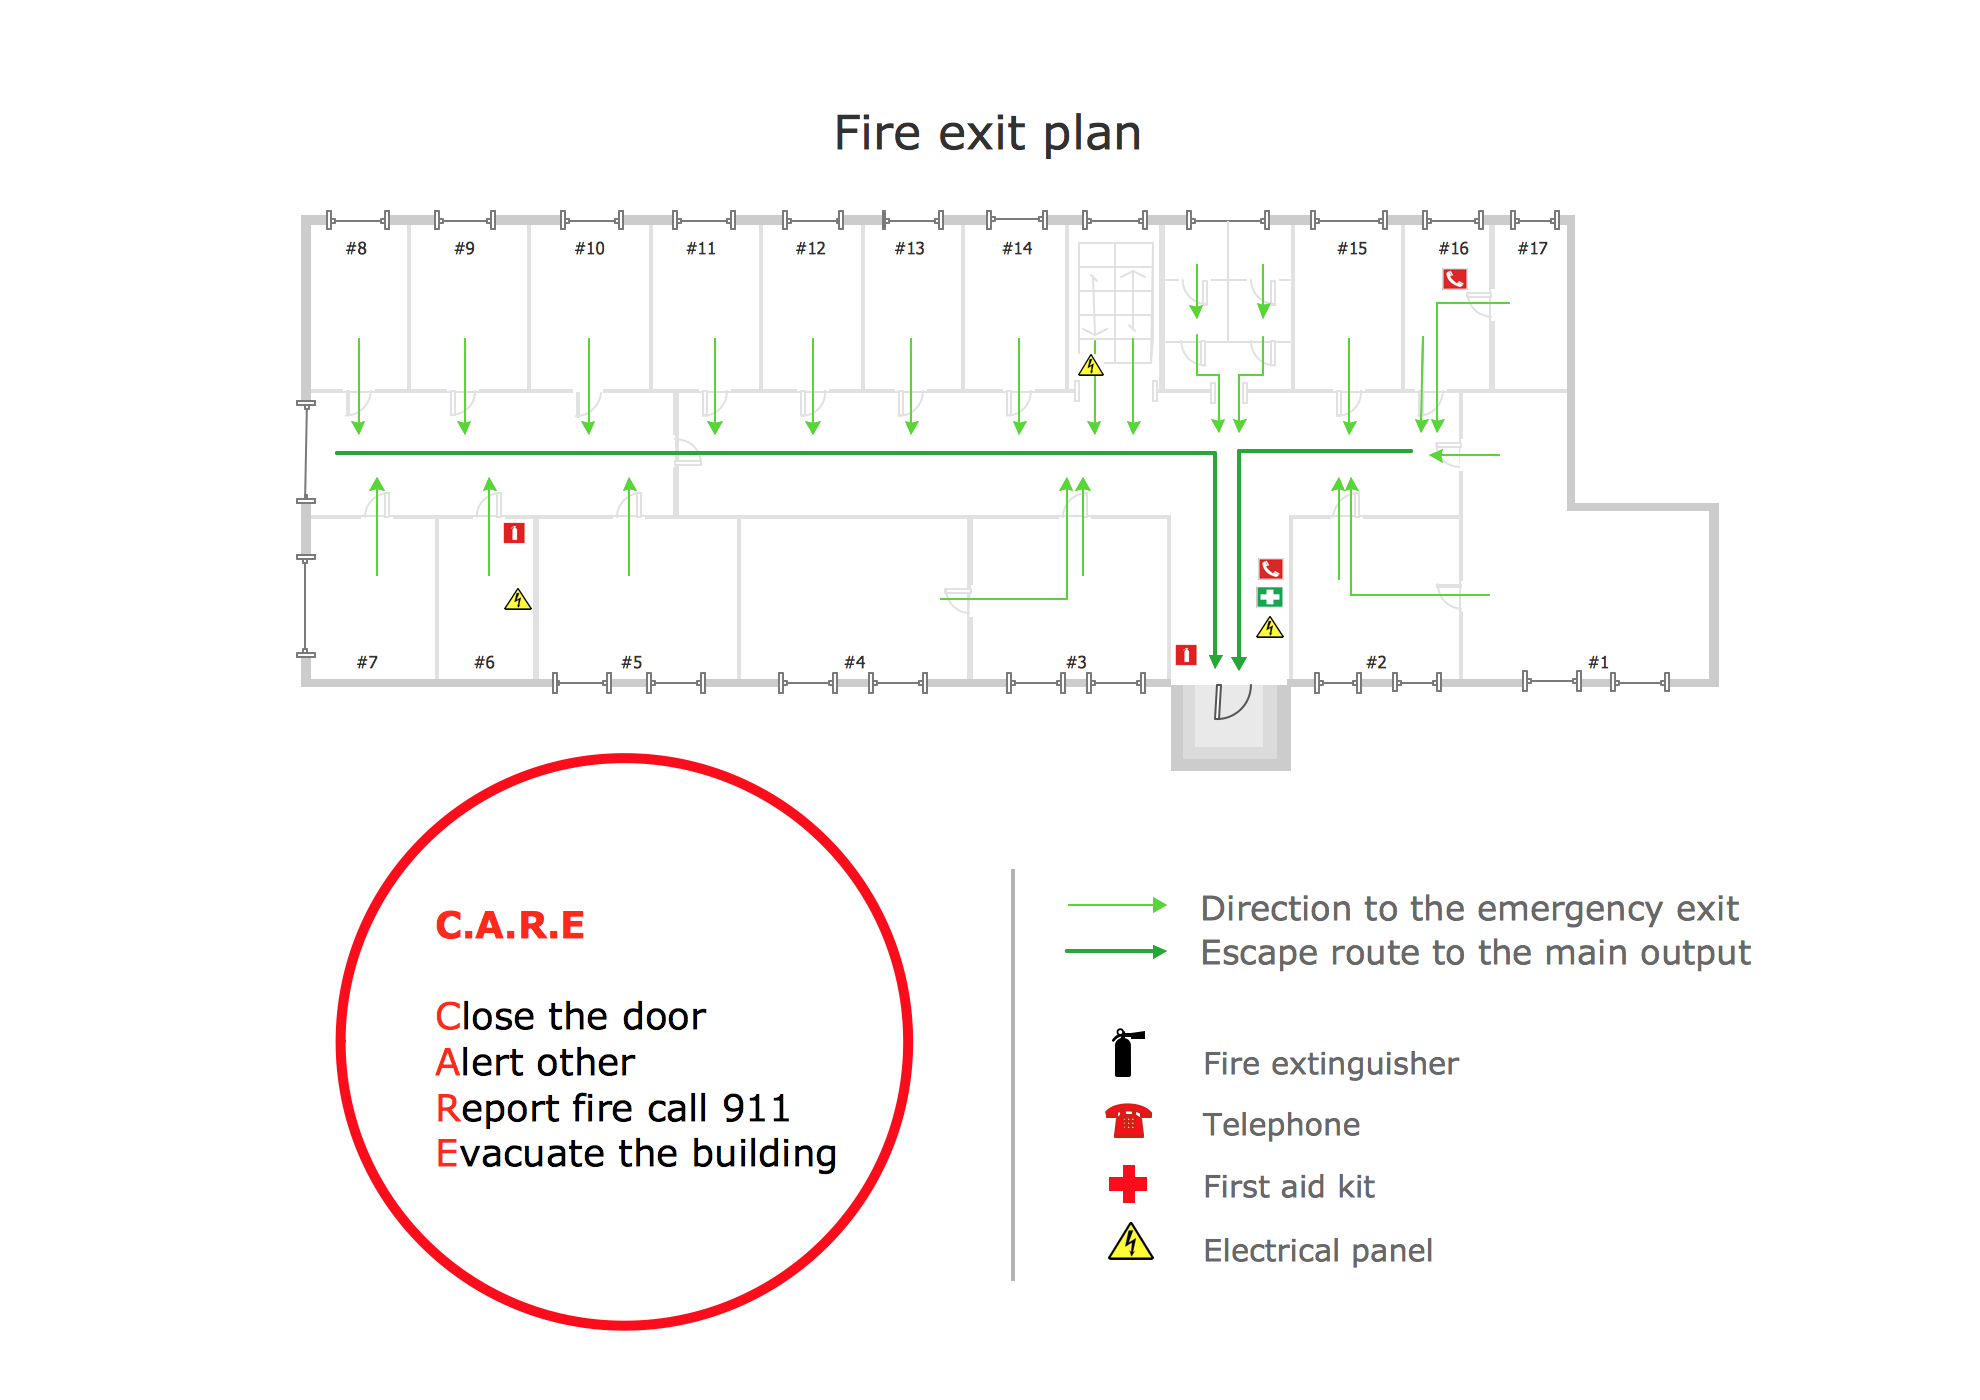

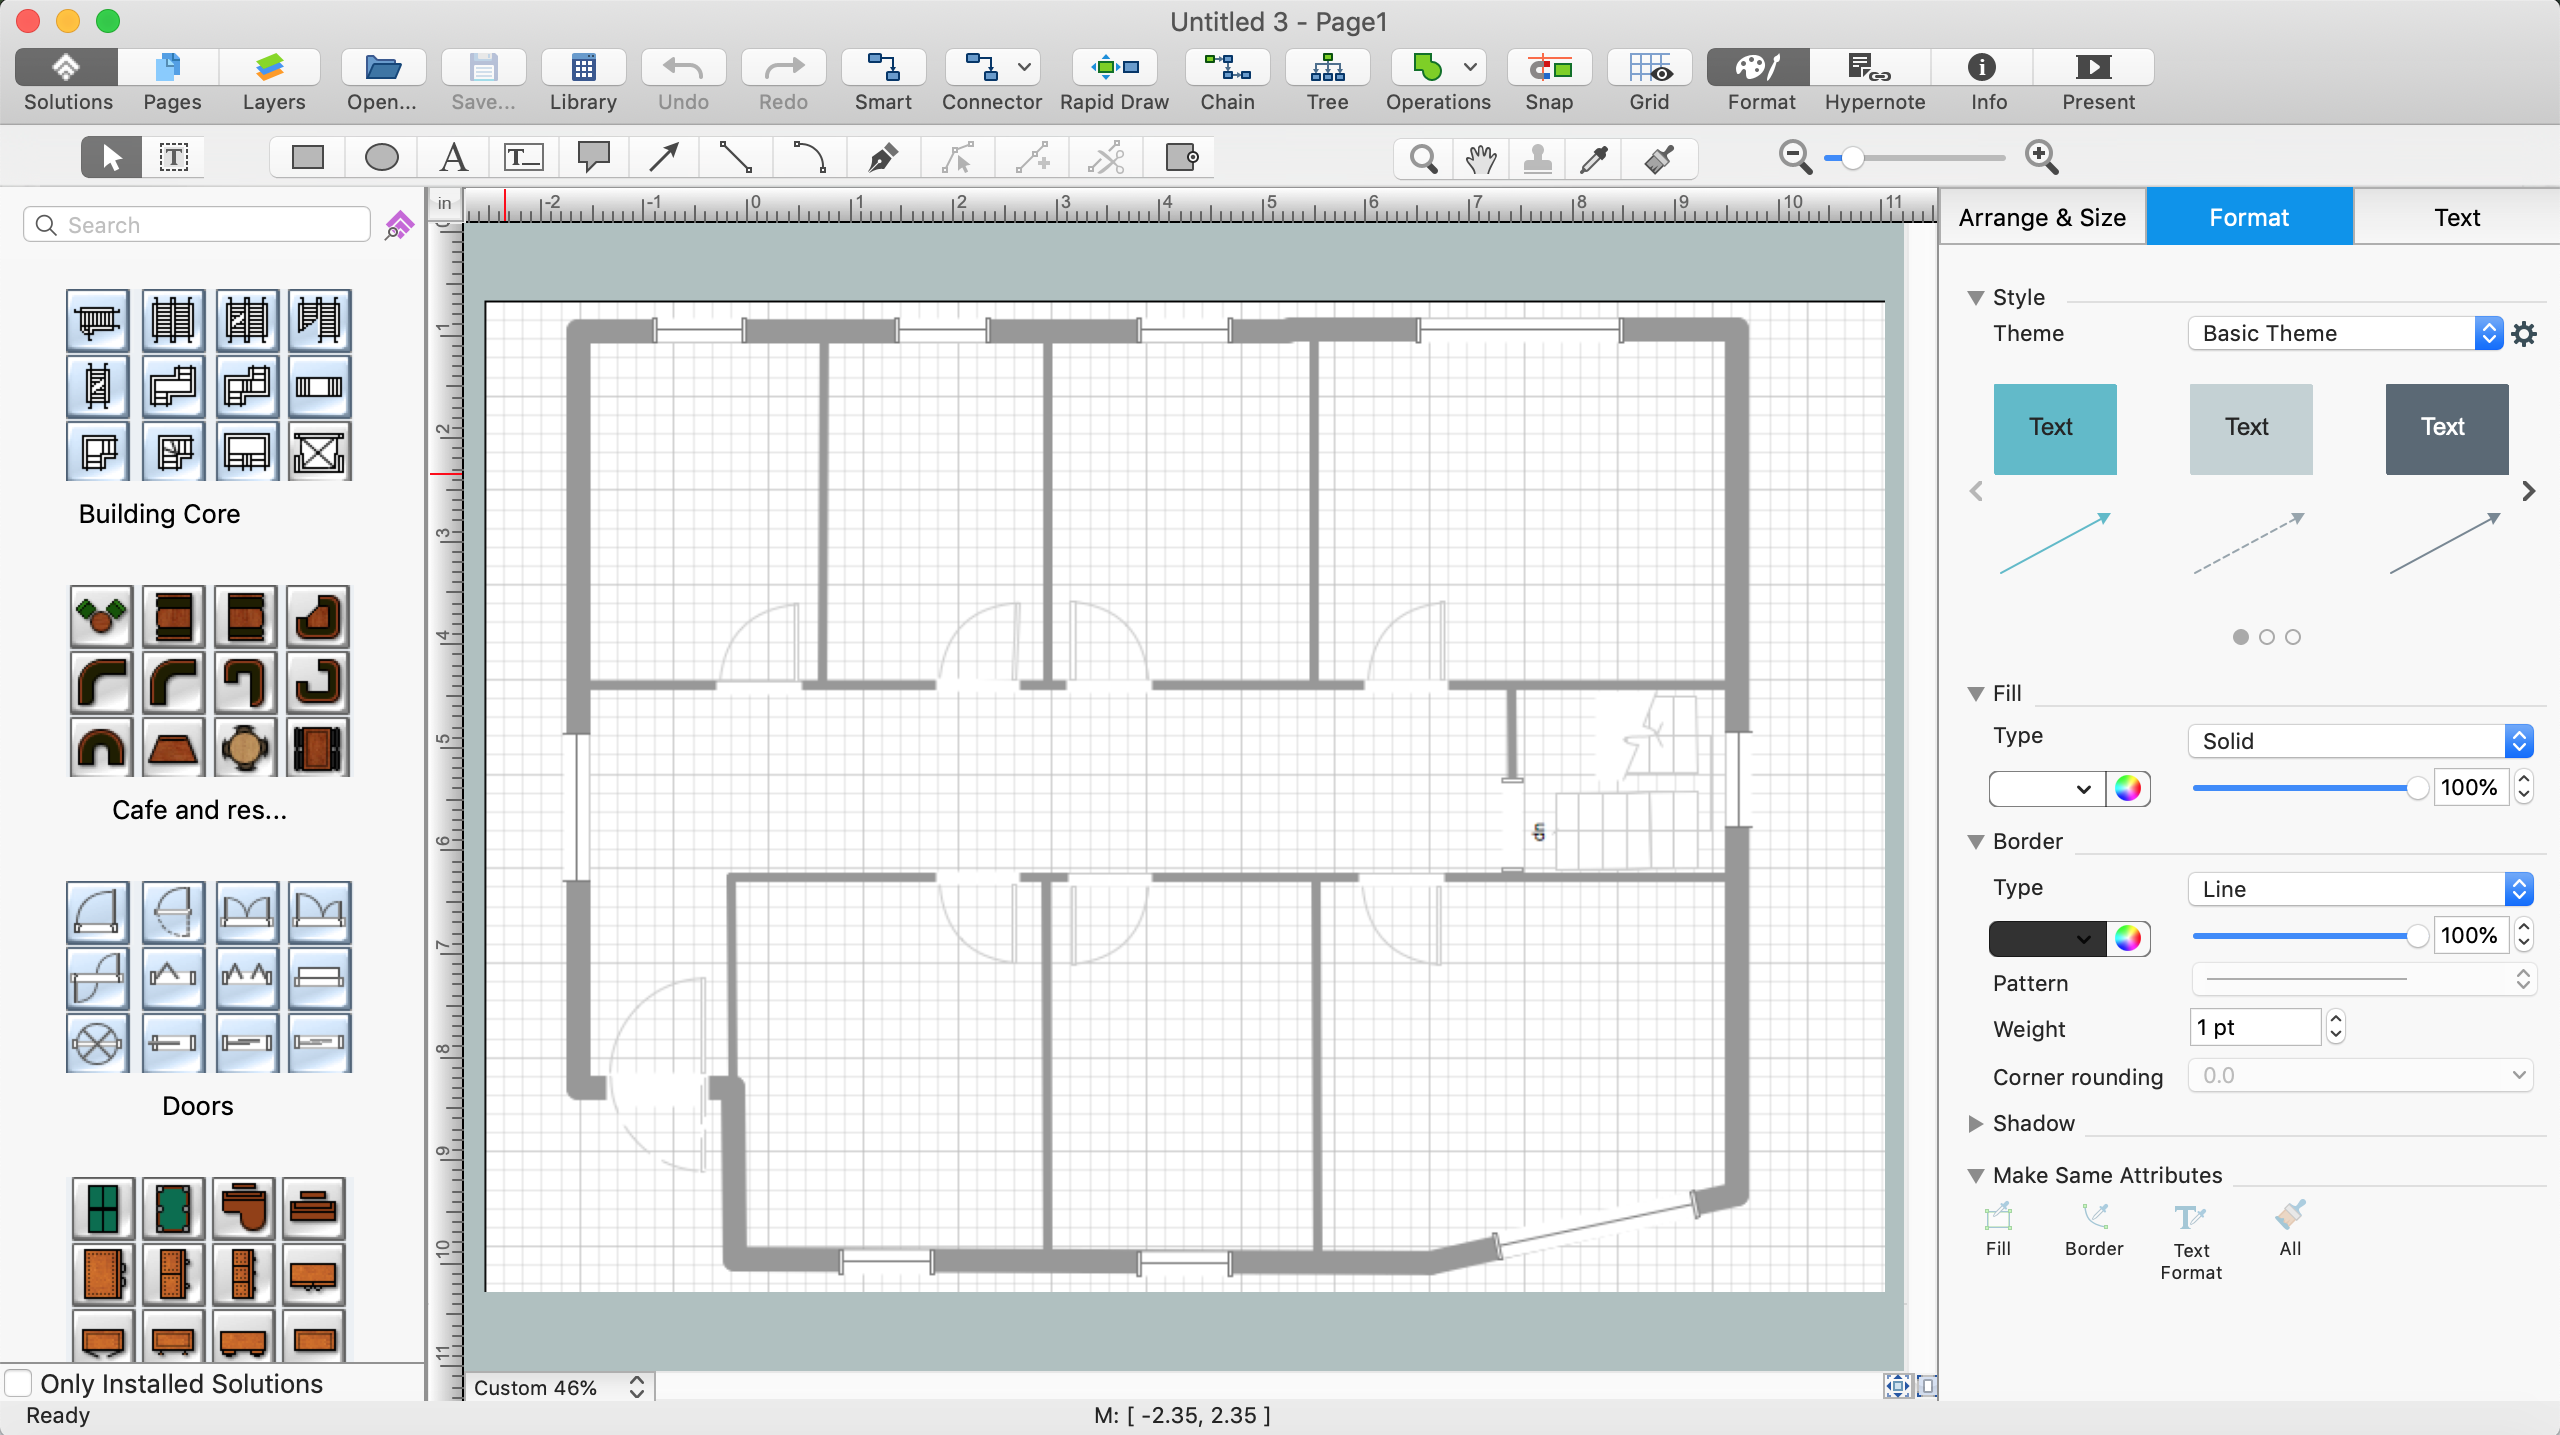
Use the libraries with a set of vector objects, templates and samples from the Floor Plans Solution from the Building Plans area of ConceptDraw Solution Park for designing your professional architectural designs.