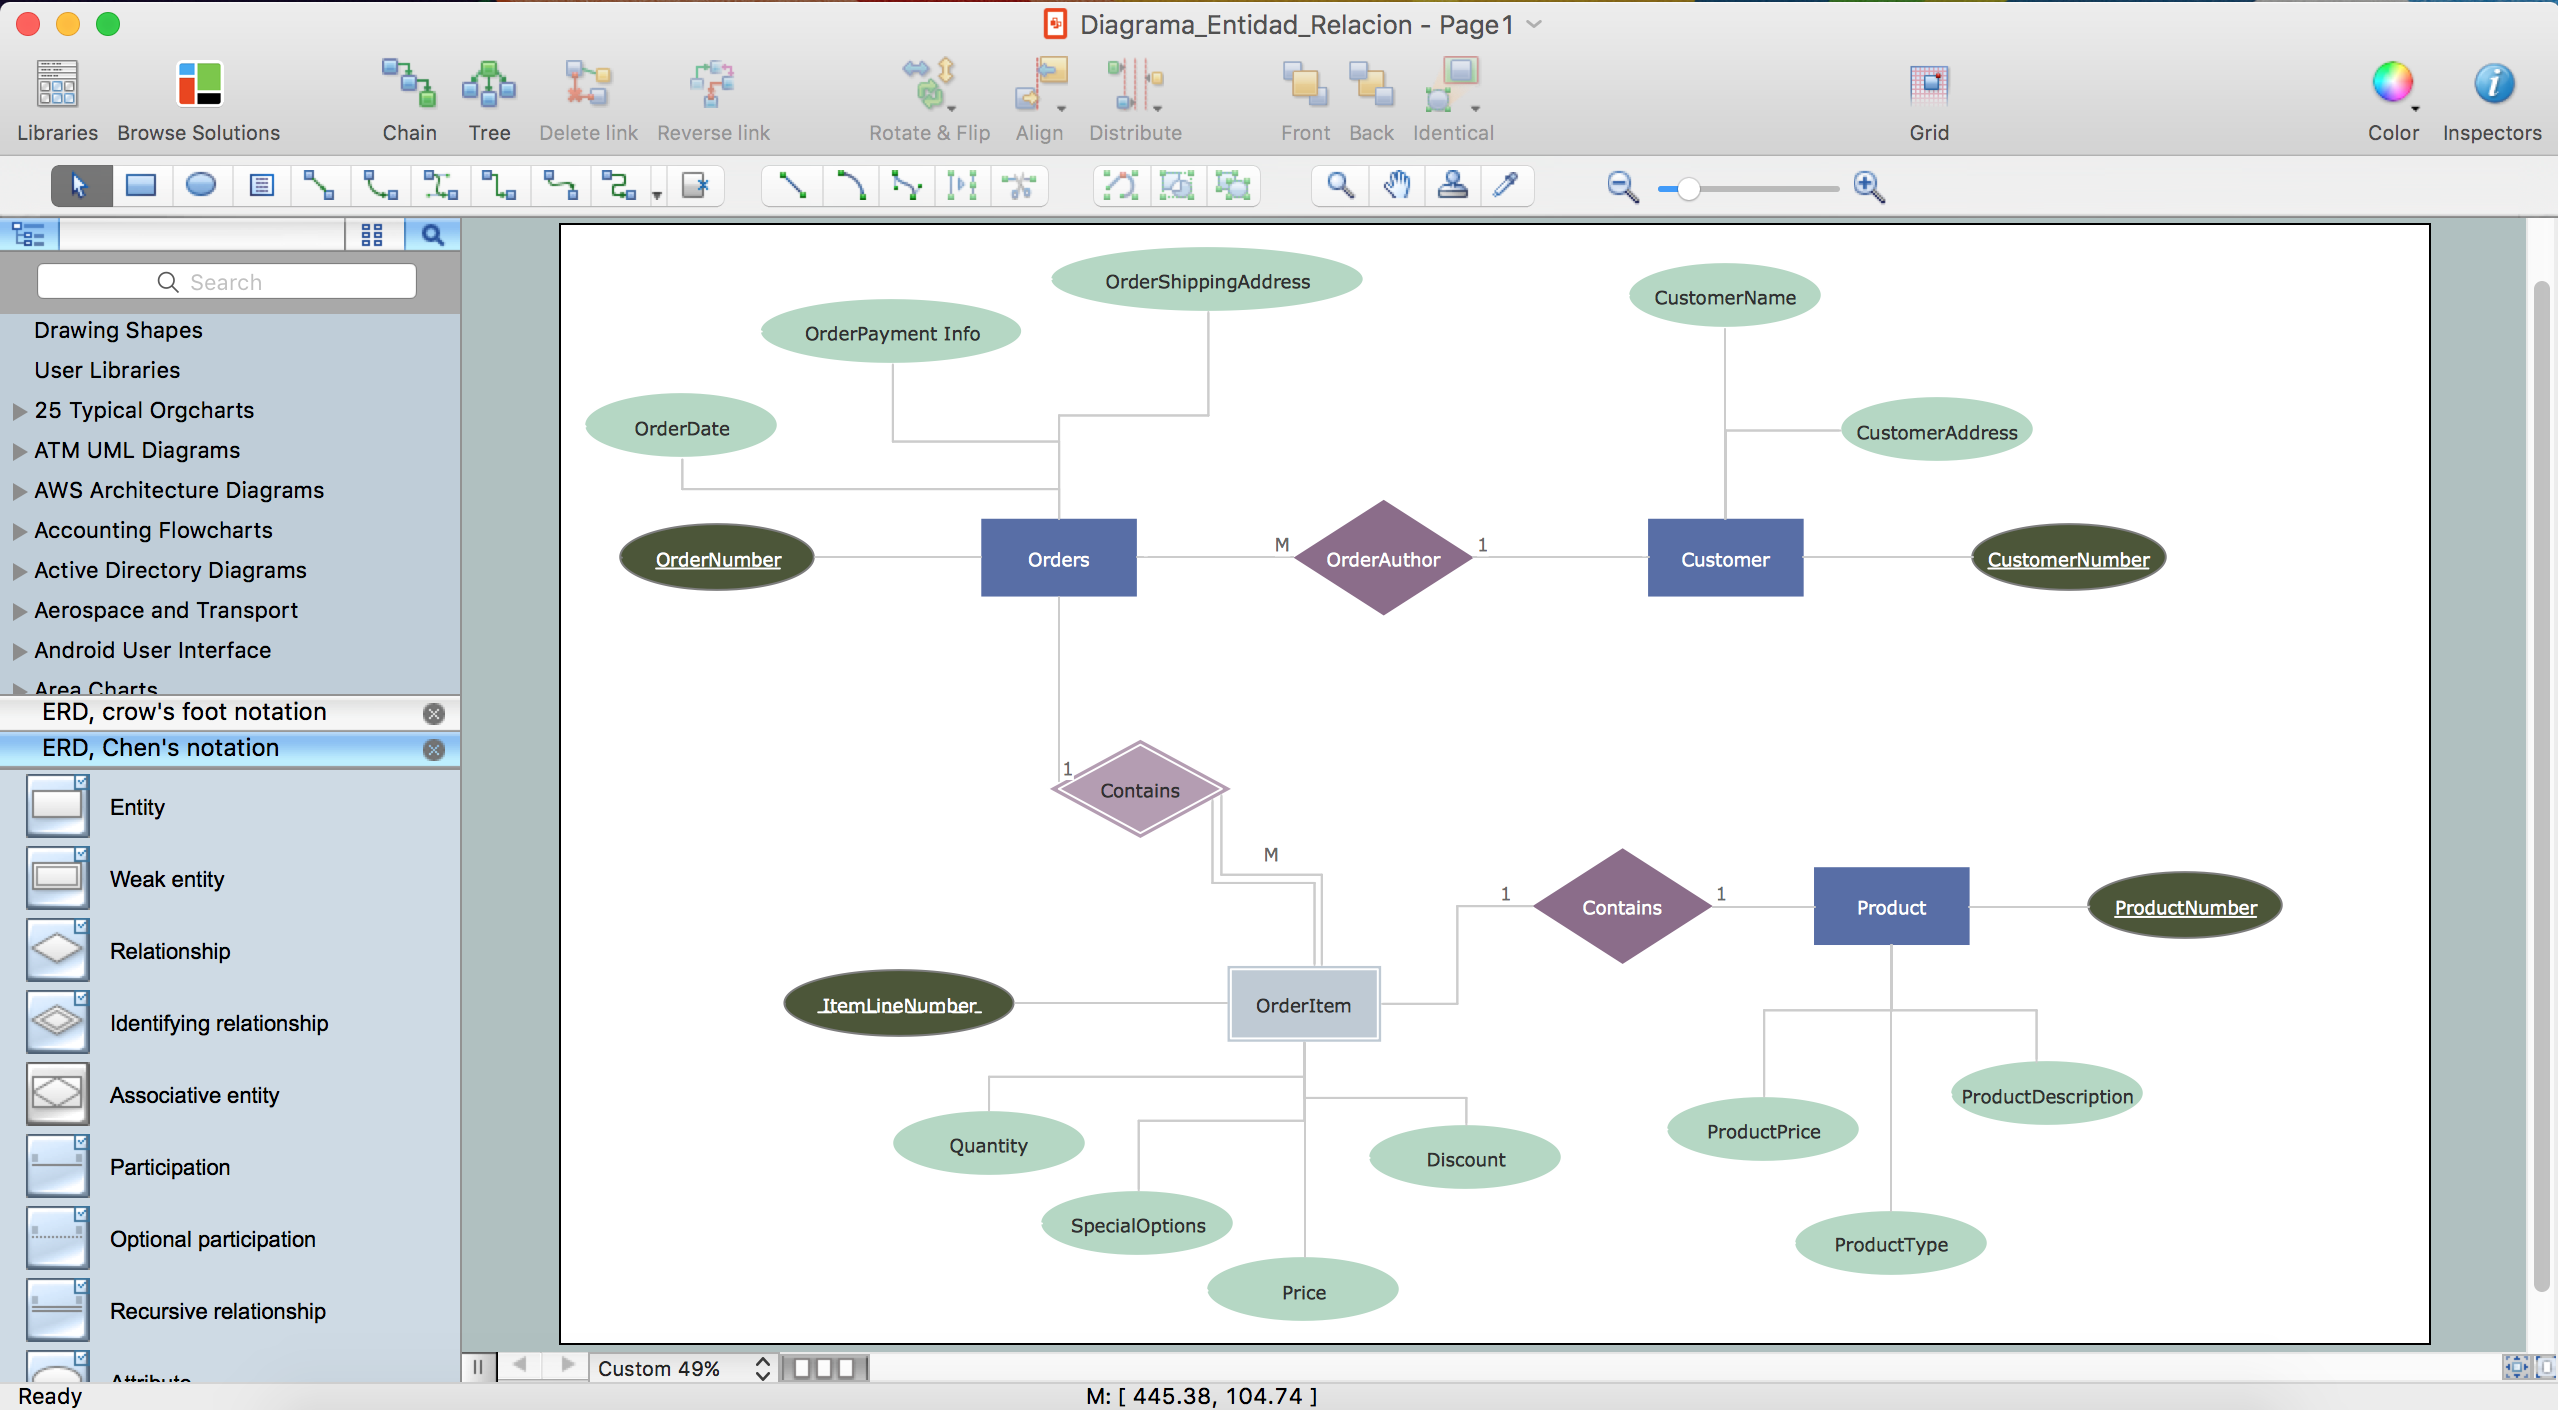
Example 1. ER diagram tool for OS X
ConceptDraw DIAGRAM software for Mac OS X gives the ability to draw ERDs using the icons from Crow’s Foot notation and Chen's notation for visual describing databases.

Example 2. Entity Relationship Diagram Symbols
All these 45 ERD vector symbols are offered by 2 libraries of Entity-Relationship Diagram (ERD) solution and are ready-to-use for designing your E-R Diagrams.
Turn also attention for the collection of professional-looking ERD templates, samples and examples offered at ConceptDraw STORE. This collection can become the perfect base for your own diagrams.

Example 3. Design ER Diagrams with ConceptDraw ER diagram tool for OS X
The samples you see on this page were created with ConceptDraw DIAGRAM ER diagram tool for OS X. These ER diagrams successfully demonstrate solution's capabilities and professional results you can achieve. An experienced user spent 10-15 minutes creating each of these samples.
Use the Entity-Relationship Diagram (ERD) Solution for ConceptDraw DIAGRAM software to design ER Diagrams fast, easy and effective.
All source documents are vector graphic documents. They are available for reviewing, modifying, or converting to a variety of formats (PDF file, MS PowerPoint, MS Visio, and many other graphic formats) from the ConceptDraw STORE. The Entity-Relationship Diagram (ERD) Solution is available for all ConceptDraw DIAGRAM or later users.
TEN RELATED HOW TO's:
ConceptDraw DIAGRAM is a world-class diagramming platform that lets you display, communicate, and present dynamically. It′s powerful enough to draw everything from basic flowcharts to complex engineering schematics.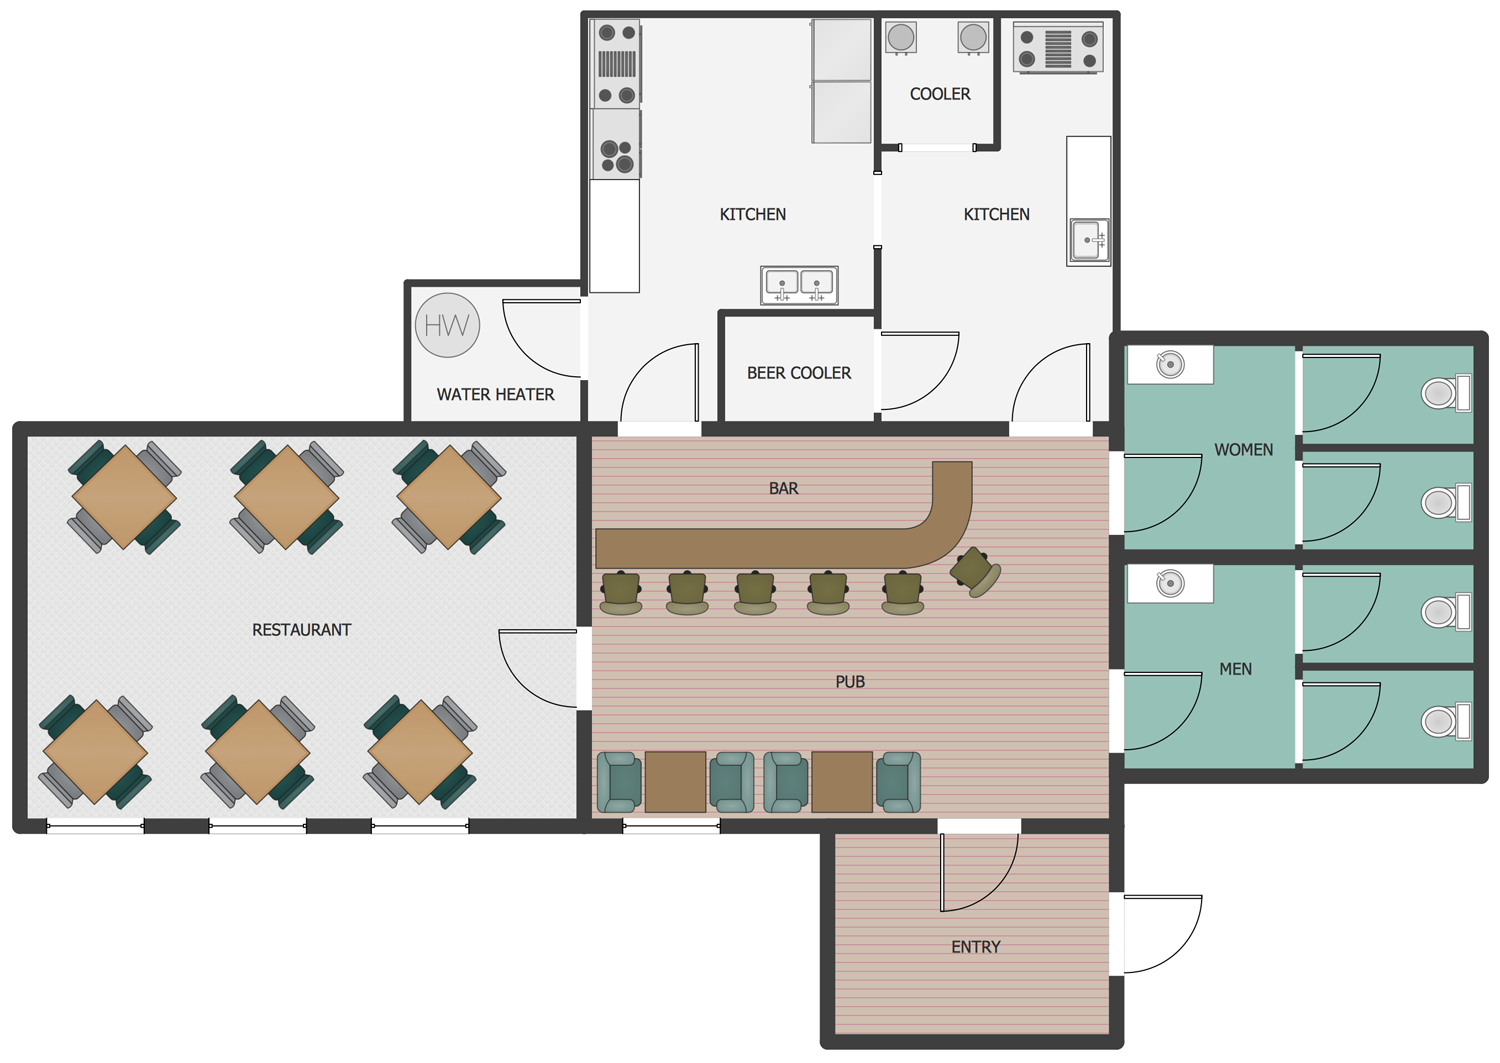
Picture: How to Draw a Building Plans
Related Solution:
Mathematical Drawing Software - Draw mathematical illustration diagrams easily from examples and templates!
Picture: Basic Diagramming
Related Solution:
The blueprints are the set of drawings used by architects and builders in the process of construction of the buildings. The blueprints represent the top views on the buildings (homes, offices, etc.). They are drawn in the scale and use the special blueprint symbols and blueprints codes. Earlier the blueprints wer printed on the special paper and was blue.
It's very easy, quick and convenient to draw the professional looking blueprints in ConceptDraw DIAGRAM diagramming and vector drawing software.
Picture: Blueprint Software
Related Solution:
The Wireless Network solution helps users to quickly transition from an idea to the implementation of a wireless computer network.
ConceptDraw DIAGRAM is well placed to provide experienced and comprehensive assistance in the workplace.
The vector stencils, examples, and templates included to solution is a strong toolset for network engineer.
Picture: Wireless Network Drawing
Related Solution:
Have you ever needed a flowchart, but did not have the time or tools to build one? Rapid Draw allows you to build a professional flowchart quickly and easily. You have the ability to add your own shapes to Rapid Draw’s built in shape library.
Picture: How To Create a FlowChart using ConceptDraw
Related Solution:
Looking for a professional flow chart creator? Learn what a flowchart creator is, see real examples, explore symbol libraries and templates, and follow a step-by-step guide to create flowcharts in ConceptDraw DIAGRAM with the Flowcharts Solution.
Picture: Flow Chart Creator
Related Solution:
Data modelling will help you to study and analyze business processes in your organization for optimization and increase of effectiveness and production.
Picture: Data modeling with ConceptDraw DIAGRAM
It’s very important that your basketball illustrations looked bright, beautiful, interesting and attracted the attention. For this you just need to add the illustrations! The Basketball solution delivers two libraries with predesigned vector clipart objects. Simply drag the needed clipart to your diagram to make it successful.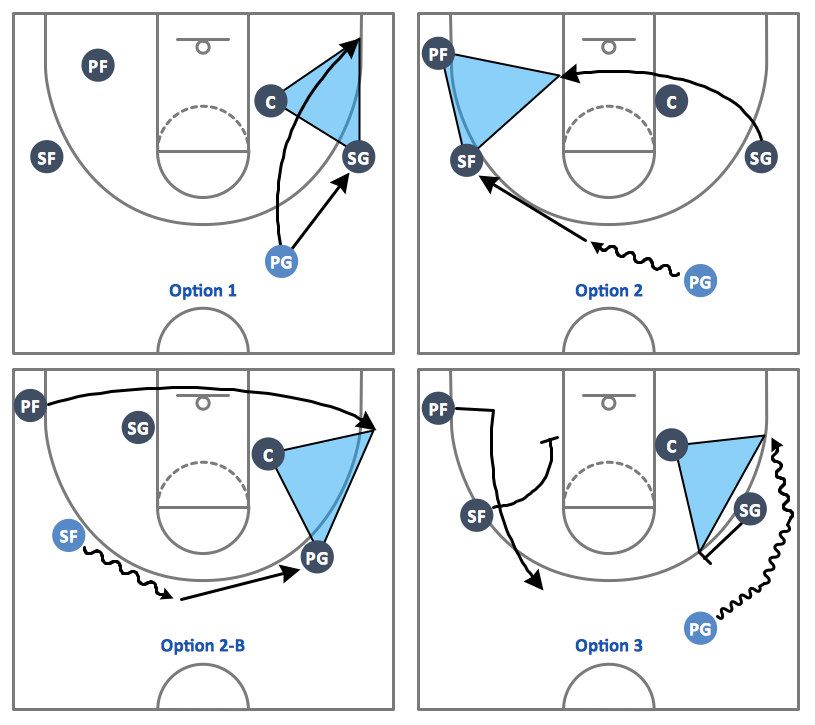
Picture: Basketball Illustrations
Related Solution:
ConceptDraw DIAGRAM diagramming and vector drawing software extended with Marketing Diagrams Solution from the Marketing Area of ConceptDraw Solution Park is the best software for quick and easy creating Marketing Flow Chart of any complexity and design.
Picture: Marketing Flow Chart
Related Solution:
The Entity-Relationship Diagram (ERD) Solution from the Software Development Area for ConceptDraw Solution Park extends ConceptDraw DIAGRAM vector graphics and diagramming software with the ability of drawing the Entity Relationship Diagrams for visually describing the databases with Crow’s Foot and Chen's notation icons.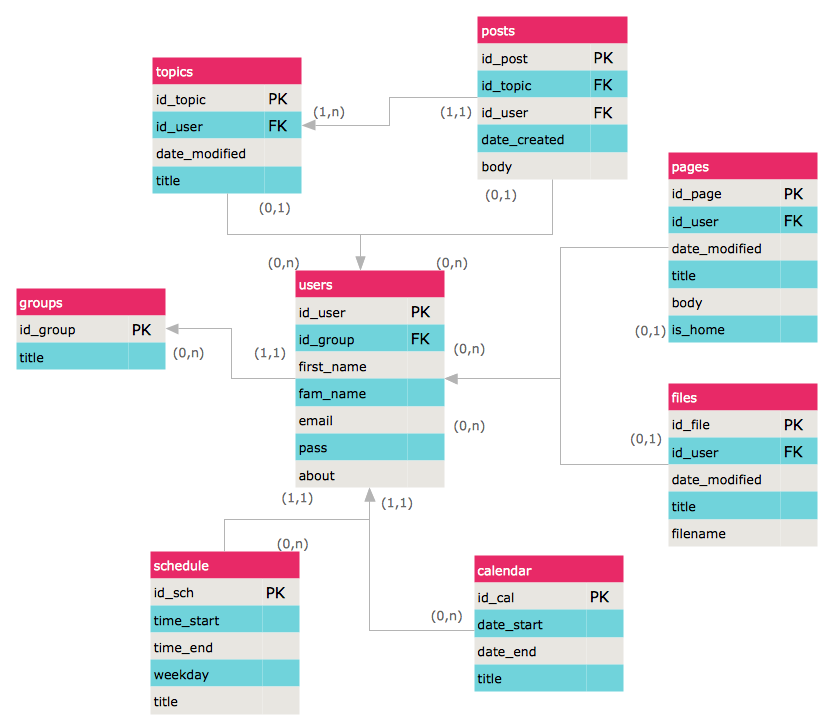
Picture: Entity Relationship Diagrams
Related Solution:

