Made with
ConceptDraw
DIAGRAM 18

Entity Relationship Diagram Software for Mac

Entity Relationship Model

One of the most popular semantic data models is the "entity-relationship" model (often called ER-model). Most of the modern approaches to the database (mainly relational) design are based on the usage of different versions of ER- model. The model was proposed by Peter Chen in 1976. Domain modeling is based on the use of graphic charts, including a small number of heterogeneous components. The simplicity and the presentation clarity of the conceptual basis of these ER-model schemes led to its widespread deployment in the CASE-systems that support automatic design of relational databases.

The basic concepts of ER-models are the entity, the relation and attribute. An entity is a real or abstract object, information about which should be kept and be available. The entity in an ER-model diagram is represented by a rectangle containing the name of the entity. In this case, the name of the entity is not a particular instance of this entity, but a label for the whole entity. Although it would be more correct to use such terms as ‘an entity type’ and ‘an instance of the entity type’ to avoid verbosity, in cases where it does not lead to ambiguity, the term “entity” is used in the meaning of the entity type. For instance, let’s think of an entity named “airport”. In this case, “airport” is the entity type, and “Heathrow” or “Charles de Gaulle” are the instances of this entity.

A relation is a graphically depicted association between two entities. As well as the entity, a relation is a typical concept, all instances of the linked entity types are subject to the rules established by the connecting. Therefore, it is more correct to speak about the relationship type made between types of entities and about the instances of relationship types made between instances of the entity type. In common ER-model this association is always binary and can exist between two different entity types or can be recursive.

Entity Relationship Diagram Software for Mac

Design elements Peter Chen and Crow's Foot notation

ConceptDraw DIAGRAM is a famous Entity Relationship Diagram software for MacOS which gives the ability to describe visually the databases using the Chen’s notation icons and Crow’s Foot notation icons for drawing ER diagram (ERD).

Entity Relationship Diagram Software for Mac *

Example 1. Entity Relationship Diagram Software for Mac

ConceptDraw DIAGRAM was developed especially for a reason of providing the convenience for macOS operating system, designed and created especially for Mac users. The difference between this application, comparing to the other Visio alternatives, which are also suitable for Mac, is that it offers to use the pre-made solutions, available both on this site and in another application, developed by the CS Odessa team of IT specialists — ConceptDraw STORE. Having ConceptDraw DIAGRAM drawing software means having an opportunity to create great looking as well as smart ERD diagrams, as this application provides all of the necessary tools to have the drawings done within only a couple of hours or even minutes, depending on how familiar you are already with this software.

Thus, once you have to create some ER-model, showing the entities, the relations between them as well as the attributes, then the best option for such drawings would be using ConceptDraw DIAGRAM which is very popular among software engineers being used for different purposes. Downloading this Entity Relationship Diagram software for Mac OSX allows you to describe any needed databases visually using the Chen’s notation icons as well as Crow’s Foot one’s icons in order to create the very professionally looking ER diagrams (ERDs) as this is a very good alternative of MS Visio for Mac.

ERD Symbols - Chen's Notation

Example 2. ERD Symbols — Chen's Notation

The Entity-Relationship Diagram (ERD) solution can be downloaded from this site or from ConceptDraw STORE application, enabling you to use both stencil libraries containing all together 45 vector graphic symbols, which will be useful in creating the needed ER diagram. Get it today to have the smart looking result already by tomorrow.

Entity Relationship Diagrams solution

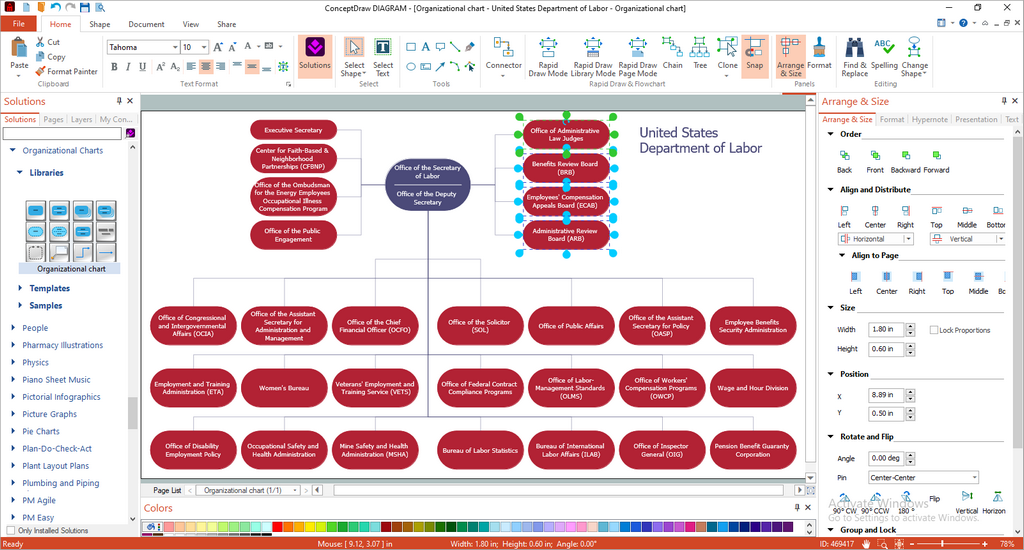
Example 3. Entity Relationship Diagrams solution

Use unique ConceptDraw DIAGRAM diagramming and vector drawing software enhanced with Entity-Relationship Diagram (ERD) solution to draw ER diagrams using Chen's or Crow's Foot notations on your Macintosh computers.

No other Entity Relationship Diagrams software gives you all this:

  • Design and document using a wide range of pre-drawn erd shapes and smart connectors.
  • Great value for the money, only $199 dollars.
  • Free technology support.
  • Free examples and built-in templates to help you draw entity relationship diagrams rapidly.


TEN RELATED HOW TO's:
Experience the main advantage of using ConceptDraw Ice Hockey solution with all tools you need to 🔸 create professional ice hockey diagrams as quickly as possible and visualize ✔️ ice hockey rinks, ✔️ roles, ✔️ positioning, ✔️ game situations, ✔️ tactics, and ✔️ strategies to succeed in tactical planningIce Hockey Rink Diagram
Picture: Ice Hockey Rink Diagram
Related Solution:
Pyramid diagrams help you visualize information as a triangle divided into horizontal slices. Labelled slices represent a hierarchy. Pyramids are used in marketing presentations to show and analyze hierarchy levels. 3D triangular diagram of DIKW pyramid has 6 levels: measurement, facts, data, information, knowledge, wisdom. The data component include different scattered signs or symbols which are merely useless until these random objective facts are somehow processed. Data is a resource which has to be manipulated or rearranged to get useful. Information can be extracted from a pile of data, it also can be mined from different data storages.Pyramid Diagram *
Picture: Pyramid Diagram
Related Solutions:
UML Component for Bank - This sample was created in ConceptDraw DIAGRAM diagramming and vector drawing software using the UML Component Diagram library of the Rapid UML Solution from the Software Development area of ConceptDraw Solution ParkUML Component for Bank *
Picture: UML Component for Bank
Related Solution:
ConceptDraw DIAGRAM is a powerful tool for business and technical diagramming. Software Development area of ConceptDraw Solution Park provides 5 solutions: Data Flow Diagrams, Entity-Relationship Diagram (ERD), Graphic User Interface, IDEFO Diagrams, Rapid UML.Software Diagram Examples and Templates *
Picture: Software Diagram Examples and Templates
Related Solution:
Data structure diagram (DSD) is intended for description of conceptual models of data (concepts and connections between them) in the graphic format for more obviousness. Data structure diagram includes entities description, connections between them and obligatory conditions and requirements which connect them. Create Data structure diagram with ConceptDraw DIAGRAM.Data structure diagram with ConceptDraw DIAGRAM
Picture: Data structure diagram with ConceptDraw DIAGRAM
Sometimes, when it is difficult to create a functional space plan or to rearrange existing one, the art of interior design comes in. It doesn't matter, if you need a cozy bedroom or an office layout plan, you should use appropriate tools to make your design great. While making a floor plan of a new office it could be useful to apply some design elements such as furniture and office equipment. This diagram presents an office furniture objects that can be used for office interior design planning, or making office furniture and equipment layouts. This vector stencils library is supplied with ConceptDraw Office Layout Plans solution. It contains more then 30 vector objects of office interior for making office floor plans including an office space layout plans and furniture arrangement.Office Layout Plan Design Element
Picture: Interior Design. Office Layout Plan Design Element
Related Solution:
When used in different areas, flowcharts use specific symbols to depict different elements. ConceptDraw DIAGRAM offers libraries of symbols for many areas. One of such libraries is flowchart symbols accounting, which provides symbols for accounting diagrams. Activity-based costing calculates the costs of all products and services based on activities in an organization. A type of accounting flowchart that shows how costs are assigned to products with resources and activities is called Activity-based costing (ABC) flowchart. It can be designed in a digital drawing software such as ConceptDraw DIAGRAM. Here is an accounting flowchart template and symbols. These flowchart symbols are applied for making accounting flow charts in ConceptDraw DIAGRAM and with its Accounting Flowcharts solution. An accounting flowchart is a specific type of a flow diagram. Practically a number of flowchart-type diagrams commonly utilized to clarify many parts of an accounting department working process. Accounting flowchart assists a process of preparing accounting documentation. It shows who responsible for implementation of each step in the workflow of accounting department.Flowchart Symbols Accounting. Activity-based costing (ABC) flowchart
Picture:
Flowchart Symbols Accounting
Activity-based costing (ABC) flowchart
Related Solution:
This sample shows the Influence Diagram. It was created in ConceptDraw DIAGRAM diagramming and vector drawing software using the Basic Diagramming Solution from the Universal Diagramming area of ConceptDraw Solution Park. Influence diagram represents the directed acyclic graph with three types of nodes and three types of arcs that connect the nodes. Decision node is drawn as a rectangle, Uncertainty node is drawn as an oval, Value node is drawn as an octagon.Influence Diagram *
Picture: Influence Diagram
Related Solution:
ConceptDraw DIAGRAM software enhanced with Organizational charts solution is an essential tool to ✔️ show the internal structure of an organization, ✔️ outline the hierarchy, ✔️ display key roles or job titles, ✔️ show relationships among employees or departments, ✔️ facilitate communication and cooperation, ✔️ visualize reporting relationshipsOrganization Chart Software
Picture: Organization Chart Software: A Comprehensive Guide
Related Solution:
You can design the Prioritization Matrix by hand on the paper, but we offer you the most easier way — to use the ConceptDraw DIAGRAM diagramming and vector drawing software extended with Seven Management and Planning Tools Solution from the Management Area.Prioritization Matrix *
Picture: Prioritization Matrix
Related Solution:
ConceptDraw
DIAGRAM 18