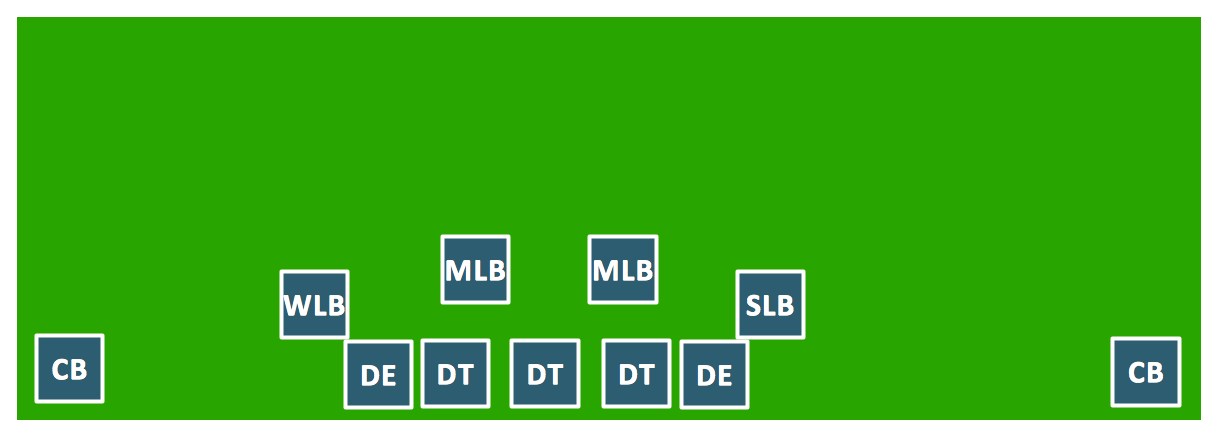
Goal Line Formation (Offense/Defense) Diagram
"The offensive and defensive versions of the goal line formation are basically the same: when the ball is within a few yards of the end zone, both teams will forget about the secondary and cram the box with as many bodies as possible. Offensively, this means 0 WRs with 3 TEs and 2 backs (plus the 5-man OL and the QB, making 11). Defensively, this means 0 safeties with a 5-man DL, 4 LBs and 2 CBs." [totalprosports.com]
ConceptDraw DIAGRAM extended with the Football solution provides access to libraries, templates and samples allows creating football diagrams and schemas. Fields objects are designed according to real fields dimensions. The most popular offense and defense schemas are available as ready-to-modify samples.
A combination of the "Football Fields" and "Football Positions" libraries gives you an ability to create a football-related drawing in seconds. Follow next steps to create you own football schema:
- From the "Football Fields" library drop a field object to your document
- From the "Football Positions" library drop all positions object you need to your document
- Place positions on the field according to your drawing idea
- Add arrows or text labels if needed.
All drawings, schemas and diagrams created in ConceptDraw DIAGRAM are scalable vector graphics that allows use it for any kind of presentation needs. As a perfect tool for explaining football plays and strategies you can present using two displays. The first display is for moving objects, the second one is full-screen presentation. This trick strengthens you explanation with dynamic visual range.
Sample 1. Football – Offensive Play – Double Wing Wedge.
This diagram was created in ConceptDraw DIAGRAM using the "Football Positions" library from the Football solution. An experienced user spent 30 minutes creating this sample.
The samples you see on this page were created in ConceptDraw DIAGRAM using the Football Solution; they demonstrate a portion of the solution's capabilities and the professional results you can achieve.
All source documents are vector graphic documents. They are available for reviewing, modifying, or converting to a variety of formats (PDF file, MS PowerPoint, MS Visio, and many other graphic formats) from the ConceptDraw STORE. The Football Solution is available for all ConceptDraw DIAGRAM or later users.
NINE RELATED HOW TO's:
Two types of diagrams are used in UML: Structure Diagrams and Behavior Diagrams. Behavior Diagrams represent the processes proceeding in a modeled environment. Structure Diagrams represent the elements that compose the system.
Picture: UML Diagram Types List
Related Solution:
It’s very convenient to explain the different tactics and positions using the visual drawings. ConceptDraw DIAGRAM software extended with the Soccer solution from the Sport area of ConceptDraw Solution Park provides libraries, templates and samples allowing specialists or soccer fans to draw the soccer-related diagrams and schemas of any complexity in a few minutes.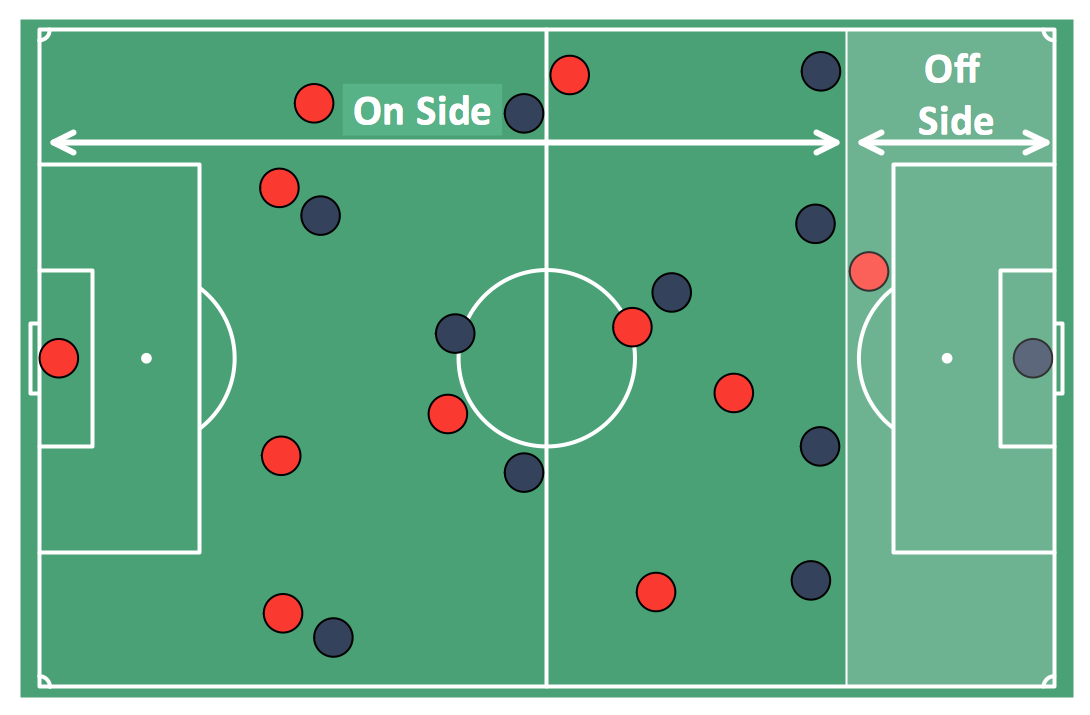
Picture: Soccer (Football) Offside
Related Solution:
Diagrams of Basketball courts arrangement serve as a helpful tool for coaches and players. They are helpful when trainer need to explain the coming game plan to players or when they discuss the game's result including all moves, positions and faults making useful conclusions. The ConceptDraw Basketball diagrams solution being used with ConceptDraw DIAGRAM delivers a kit of graphical tools for designing different diagrams related to a Basketball game. Basketball court diagram can be helpful to show basketball motion, positions and throws after the match, as well as to design a winning strategy and a clear visual plan for future game.
What would you say about active leisure? With our Basketball Court Diagram and Basketball Positions you can set a court even in your yard. Make your friends and family happy!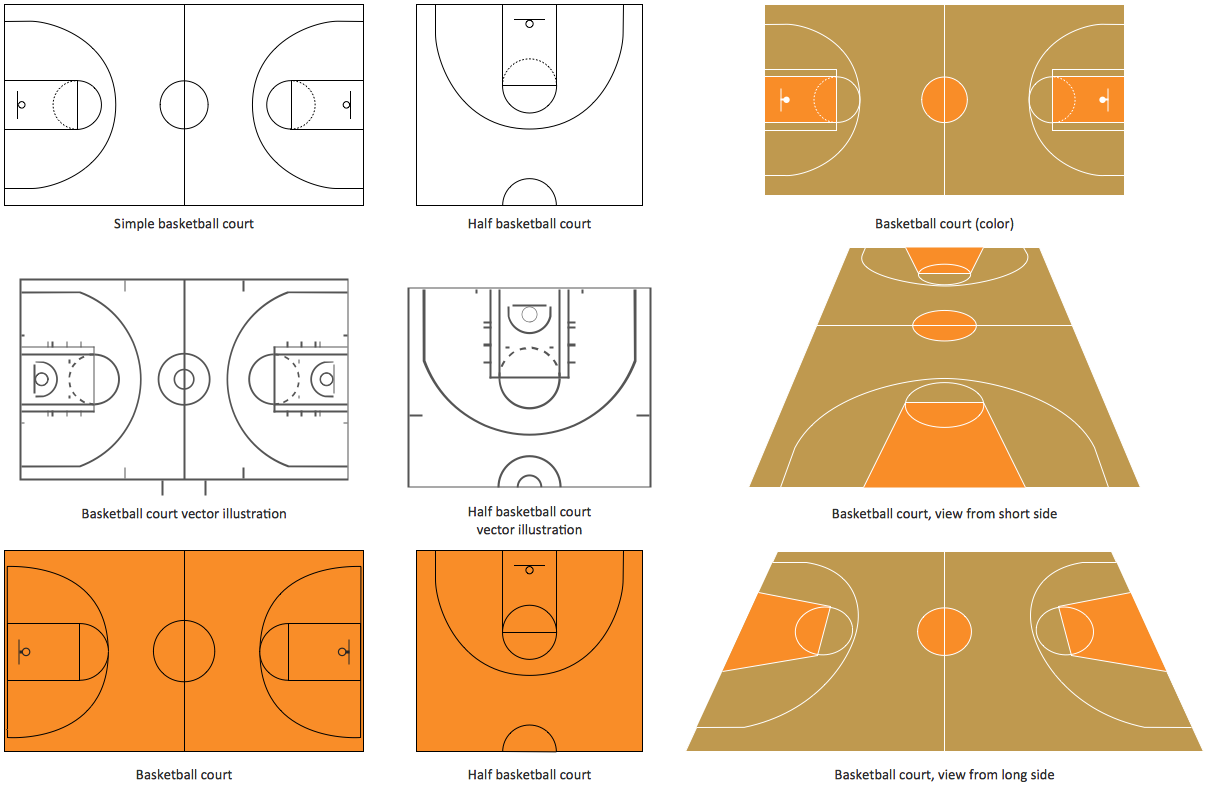
Picture: Basketball Court Diagram and Basketball Positions
Related Solution:
A set of predesigned fields and positions allows producing baseball diagrams without any drawing experience.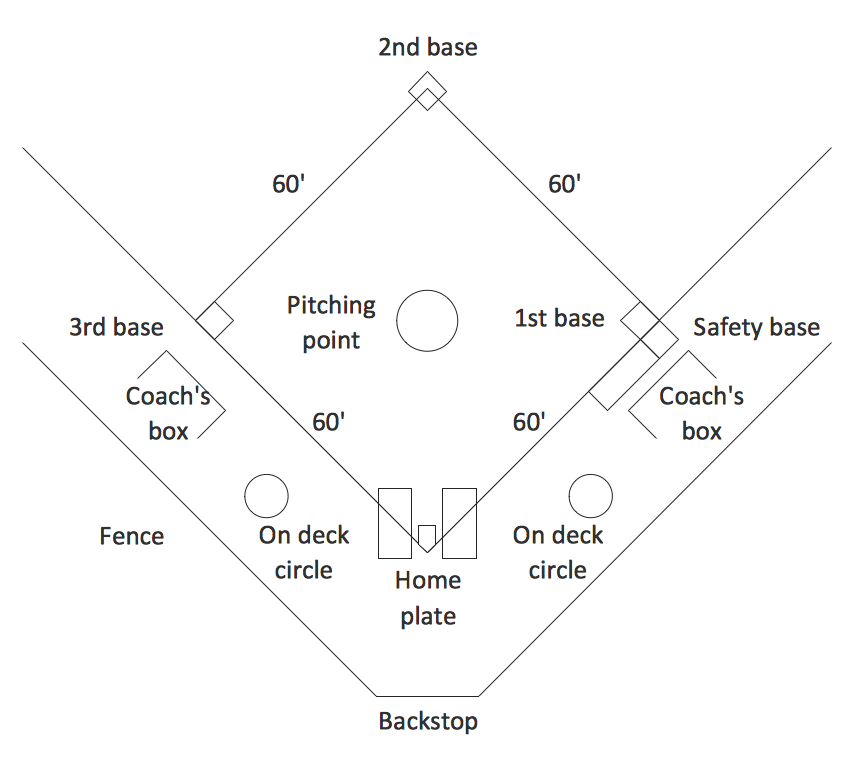
Picture: Simple Baseball Field — Sample
Related Solution:
Drawing baseball diagrams using ConceptDraw DIAGRAM software extended with the Baseball solution saves your time, and adds more value to your work.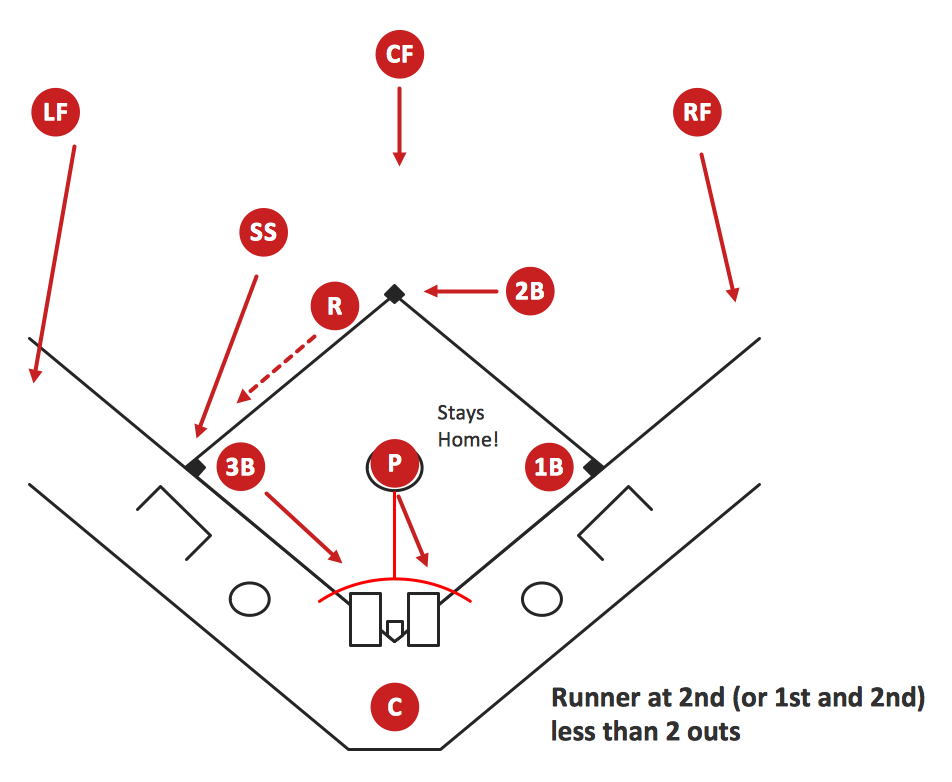
Picture:
Baseball Diagram
Basic Bunt Coverage – Runner at 2nd
Related Solution:
ConceptDraw DIAGRAM software extended with the Baseball solution delivers samples with diagrams of the most popular plays in baseball.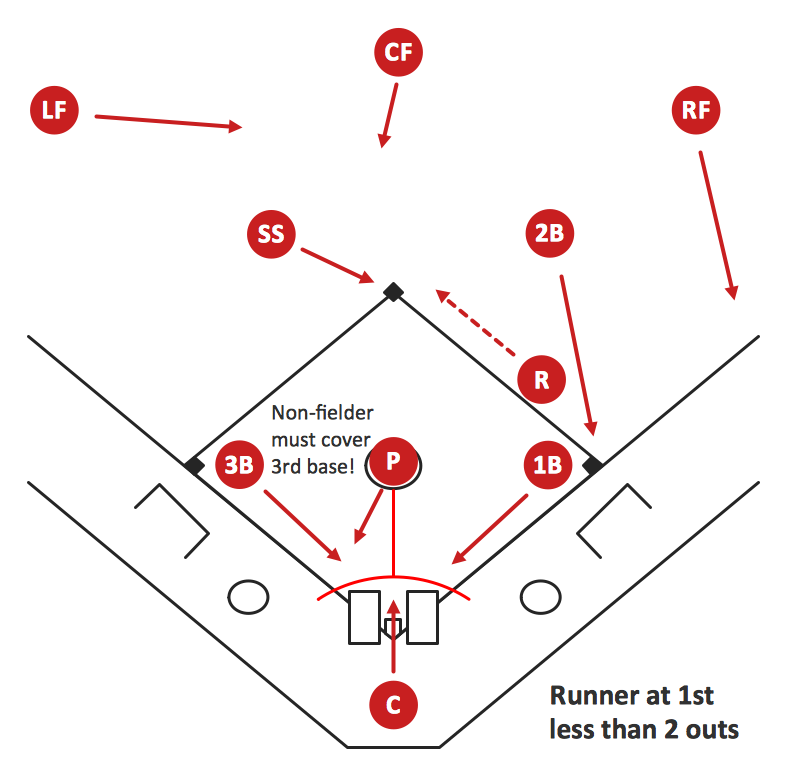
Picture: Baseball Diagram – Basic Bunt Coverage – Runner at 1st
Related Solution:
Thanks to Baseball solution all you need is just drag and drop ready-to-use positions objects to a template contains baseball field, and place positions on the field.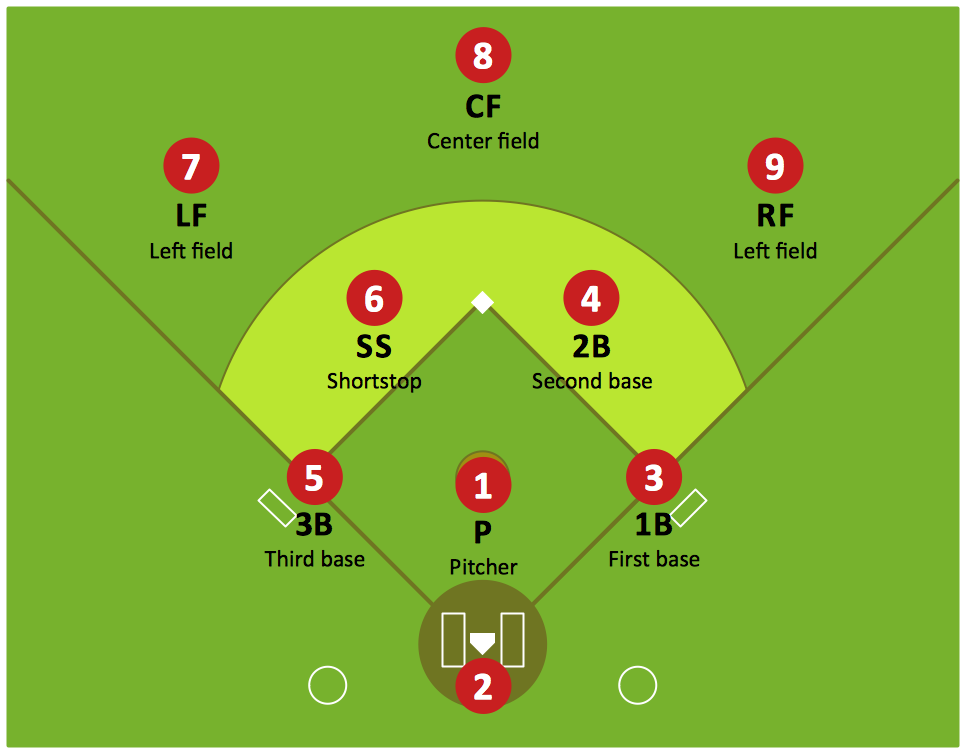
Picture: Baseball Diagram — Defence Positions
Related Solution:
Electrical plan is a document that is developed during the first stage of the building design. This scheme is composed of conventional images or symbols of components that operate by means of electric energy. To simplify the creation of these schemes you can use house electrical plan software, which will not require a long additional training to understand how to use it. You only need to install the necessary software ant it’s libraries and you’ll have one less problem during the building projection.
Any building contains a number of electrical systems, including switches, fixtures, outlets and other lightening equipment. All these should be depicted in a building electrical plans and included to general building documentation. This home electrical plan displays electrical and telecommunication devices placed to a home floor plan. On the plan, each electrical device is referenced with the proper symbol. Electrical symbols are used for universal recognition of the building plan by different persons who will be working on the construction. Not all possible electric symbols used on a certain plan, so the symbols used in the current home plan are included to a legend. The electrical home plan may be added as a separate document to a complete set of building plans.
Picture: How To use House Electrical Plan Software
Related Solution:
Extending ConceptDraw DIAGRAM software with the Baseball solution you receive a complete set of libraries, templates and samples allowing to draw baseball diagrams in seconds. You can start from a template, change positions and get ready diagram in some clicks.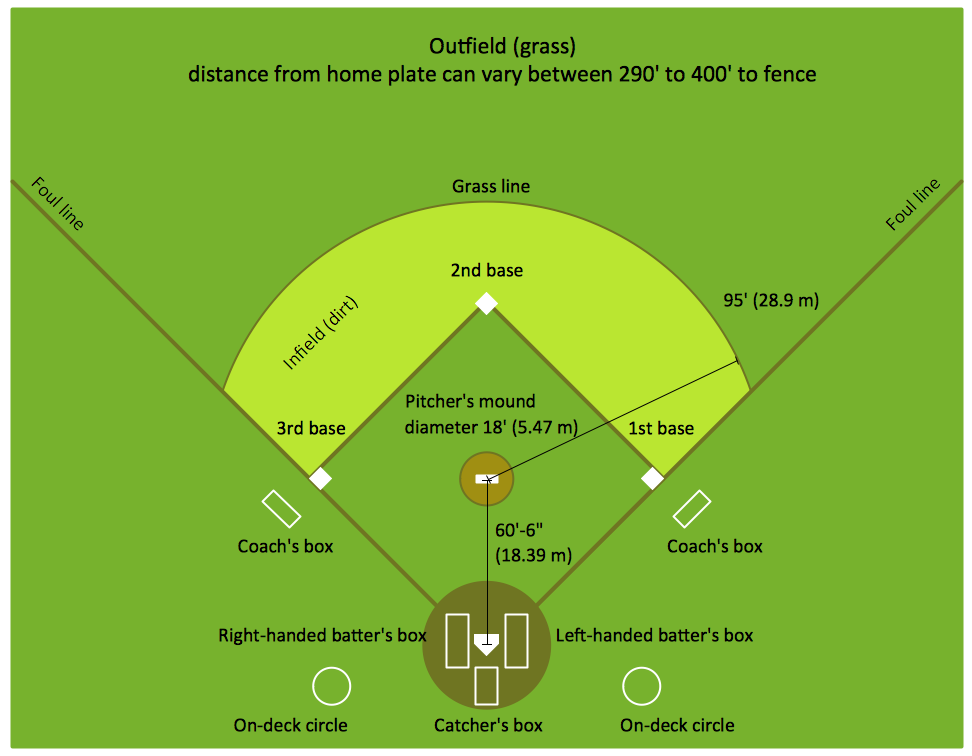
Picture: Baseball Diagram – Colored Baseball Field
Related Solution: