Pro Set Formation (Offense) Diagram
"The pro set formation is another “traditional” modern offensive formation. Like the I formation, the pro set is a balanced formation that usually features 2 backs, 2 WRs, and a TE. The main difference between the pro set and the I is simply that the two backs are on either side of the quarterback. Thus there is a bit of a tradeoff when using the pro set: you lose the blocking of the FB in the I formation, but you gain some uncertainty, as the defense doesn’t know which side of center the ball will go to." [totalprosports.com]
ConceptDraw DIAGRAM software extended with the Football solution delivers a set of samples depict the most popular offenses, and libraries and templates allowing you complete this set with all offenses you know, or maybe invent a new one.A complete set of predesigned fields and positions make drawing offense diagram as quickly as with pen and paper.
A combination of the "Football Fields" and "Football Positions" libraries gives you an ability to create a football-related drawing in seconds. Follow next steps to create you own football schema:
- From the "Football Fields" library drop a field object to your document
- From the "Football Positions" library drop all positions object you need to your document
- Place positions on the field according to your drawing idea
- Add arrows or text labels if needed.
When your football diagram is ready you may want to share it with the world. ConceptDraw DIAGRAM have an Export to HTML feature that may help with this. The nice looking HTML page generated in some clicks may be used as is, or become a good start for a page of any complexity you want to produce.

Sample 1. Football – Pro Set Formation (Offense).
This diagram was created in ConceptDraw DIAGRAM using the "Football Positions" library from the Football solution. An experienced user spent 2 minutes creating this sample.
The samples you see on this page were created in ConceptDraw DIAGRAM using the Football Solution; they demonstrate a portion of the solution's capabilities and the professional results you can achieve.
All source documents are vector graphic documents. They are available for reviewing, modifying, or converting to a variety of formats (PDF file, MS PowerPoint, MS Visio, and many other graphic formats) from the ConceptDraw STORE. The Football Solution is available for all ConceptDraw DIAGRAM or later users.
NINE RELATED HOW TO's:
Using diagrams is the easiest way to explain the soccer formations. The Soccer solution from the Sport area of ConceptDraw Solution Park is designed as a tool that helps you produce the soccer diagrams in a few minutes. The predesigned samples of the Soccer solution for ConceptDraw DIAGRAM depict the most popular formation diagrams.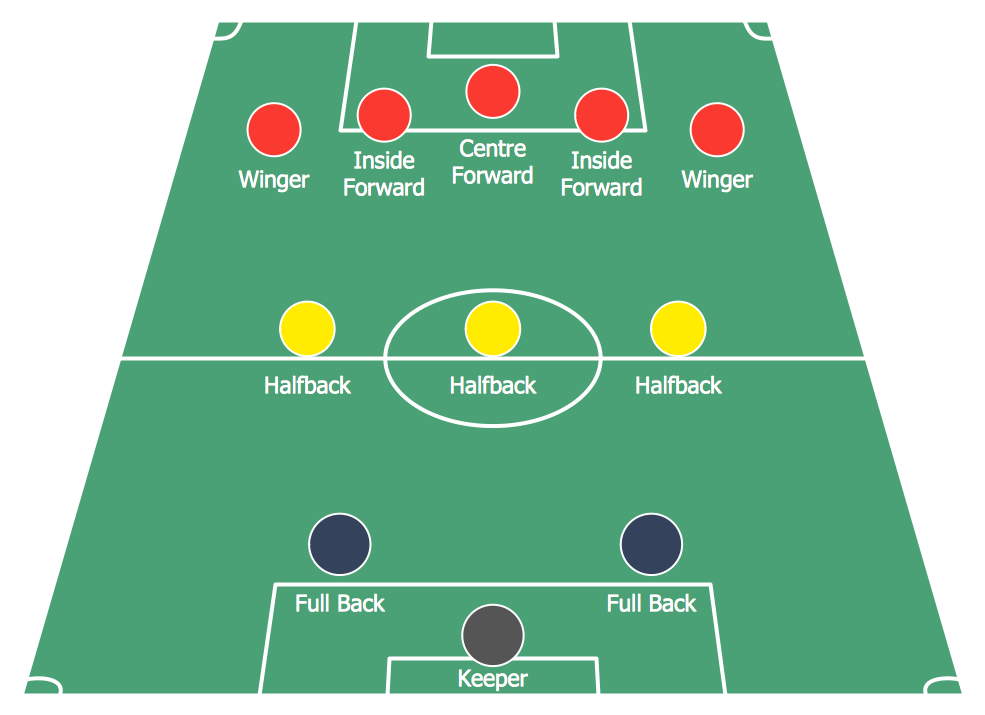
Picture: Soccer (Football) Formation
Related Solution:
Any business process consists from a number of tasks carrying out the certain business goal. It is useful to diagram business processes to ensure that they are as foolproof, logical and sequential as possible. This business process diagram describes a typical booking process flow by the example of a cab booking process. It can be used as a roadmap for any booking system implementation. Diagramming a business process allows you to look at the entire project and take into account all types of possible scenarios. Business process diagram helps you investigate and clarify the process thoroughly so that you can find out how it can be improved. Business process diagram supports team communications by ensuring that each process element is clear and everyone in the team is on the same page.
Sometimes your company brings you less profit than you expect it to be, and it’s difficult to reveal the causes. Maybe it’s time to learn new technologies, because business diagram are easily developed by means of special software, so you won’t make any extra effort. In return, you will increase your productivity and get more done in a less time.
Picture: Business Diagram Software
Related Solutions:
This sample shows the Spider Chart that represents the budget and spending for one organization and allows to compare them. The multivariate data are represented on the Spider Chart as a two-dimensional chart with four or more variables displayed on the axes that start in one point. The Spider Charts are used in the management, business and sport.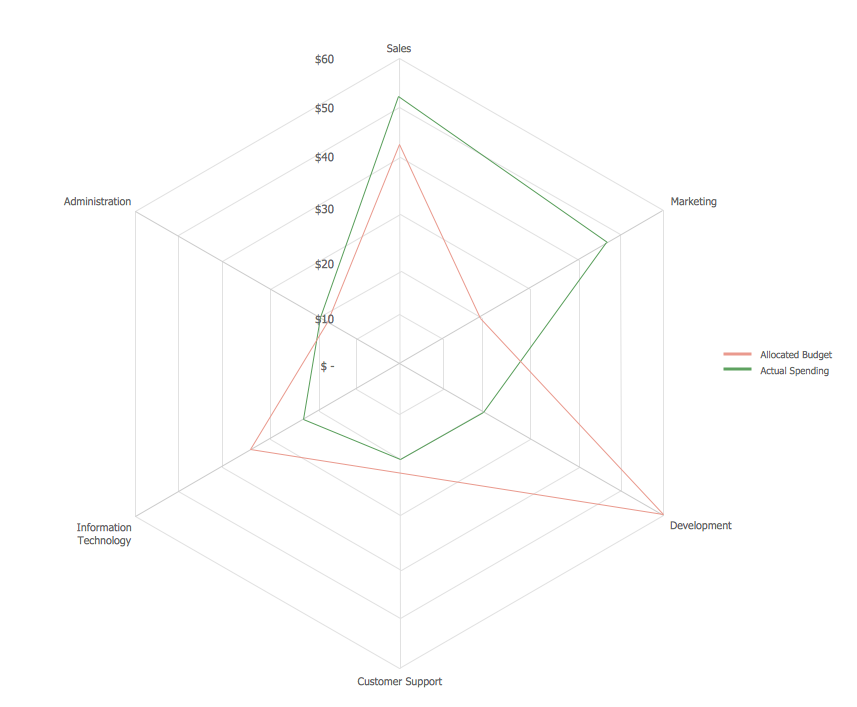
Picture: Spider Chart Template
There are many ways to describe a database structure. One of the most usual is to draw an entity relationship diagram (ERD) using a Crow’s Foot notation to represent database elements. If you don’t want to draw it on paper, you should use an appropriate software.
An entity-relationship (ER) diagram is used to show the structure of a business database. ERD represents data as objects (entities) that are connected with standard relationships symbols which Illustrate an association between entities. ERD, there is a wide range of ERD notations used by data bases architects for reflecting the relationships between the data entities. According to the crow’s foot notation relationships are drawn as single labeled lines designating a certain kinds of relationship. Crow foot notation is a most frequently used ERD standard, because of improved readability of diagrams, with a more accurate use of space on the page.
Picture: Entity Relationship Diagram - ERD - Software for Design Crows Foot ER Diagrams
Related Solution:
ConceptDraw DIAGRAM software extended with the Football solution delivers libraries, templates and samples allowing football fans or specialists to draw football-related schemas in minutes. A complete set of predesigned fields and positions make drawing schemas as quickly as possible.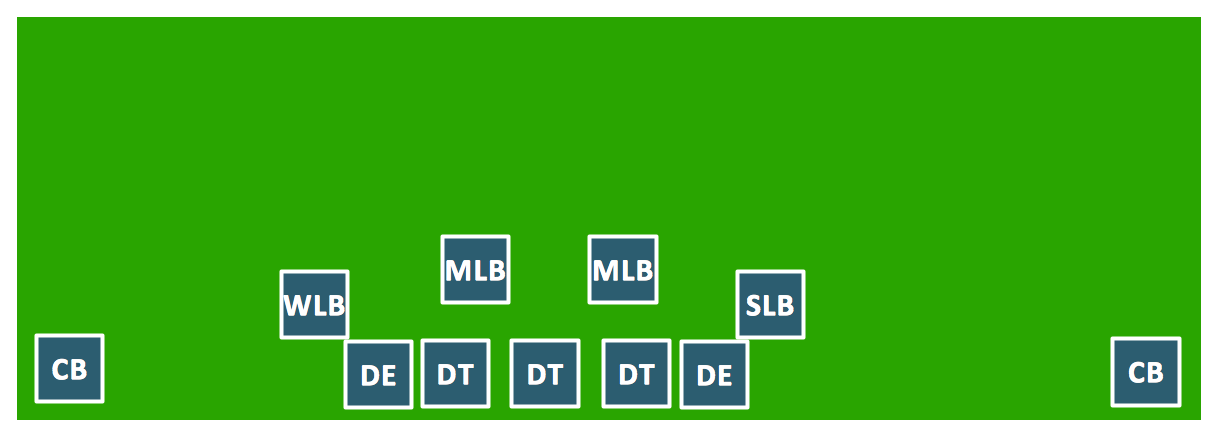
Picture: Goal Line Formation (Offense/Defense) Diagram
Related Solution:
It’s very convenient to explain the different tactics and positions using the visual drawings. ConceptDraw DIAGRAM software extended with the Soccer solution from the Sport area of ConceptDraw Solution Park provides libraries, templates and samples allowing specialists or soccer fans to draw the soccer-related diagrams and schemas of any complexity in a few minutes.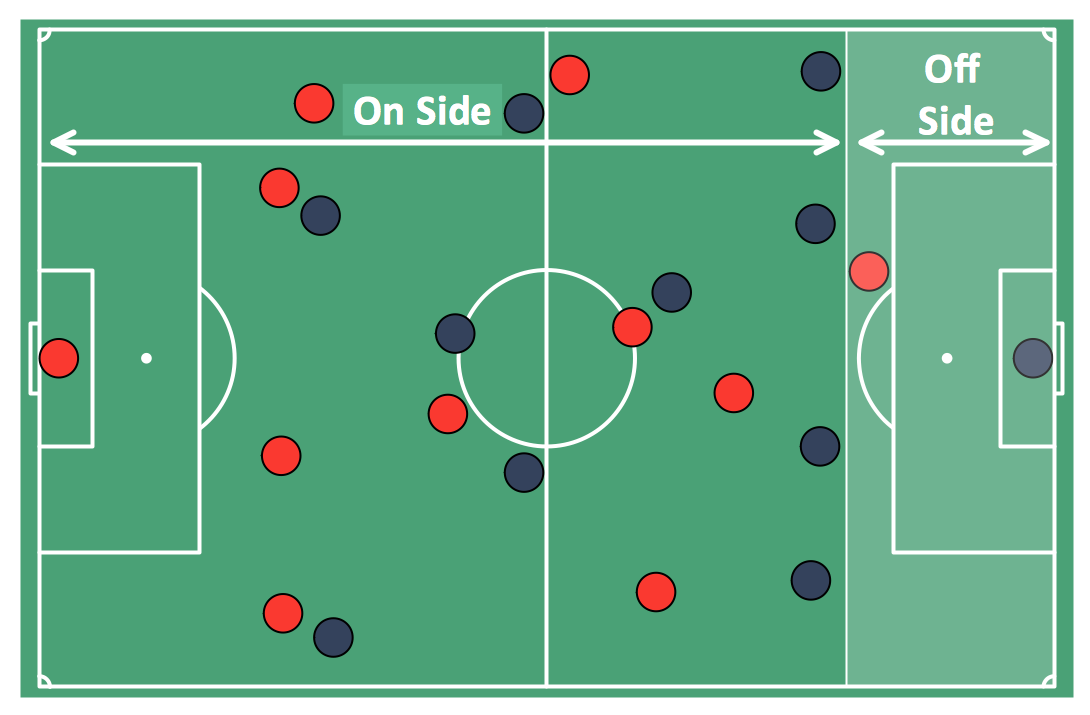
Picture: Soccer (Football) Offside
Related Solution:
Basketball is a popular sport played by two teams of five players with a ball. The game takes place on a rectangular court. The team goal is to score a ball into the basket of the opponent team. The team with the most points wins the game.
ConceptDraw DIAGRAM diagramming and vector drawing software extended with Basketball solution from the Sport area of ConceptDraw Solution Park is a very useful tool for designing the basketball-related diagrams of any complexity.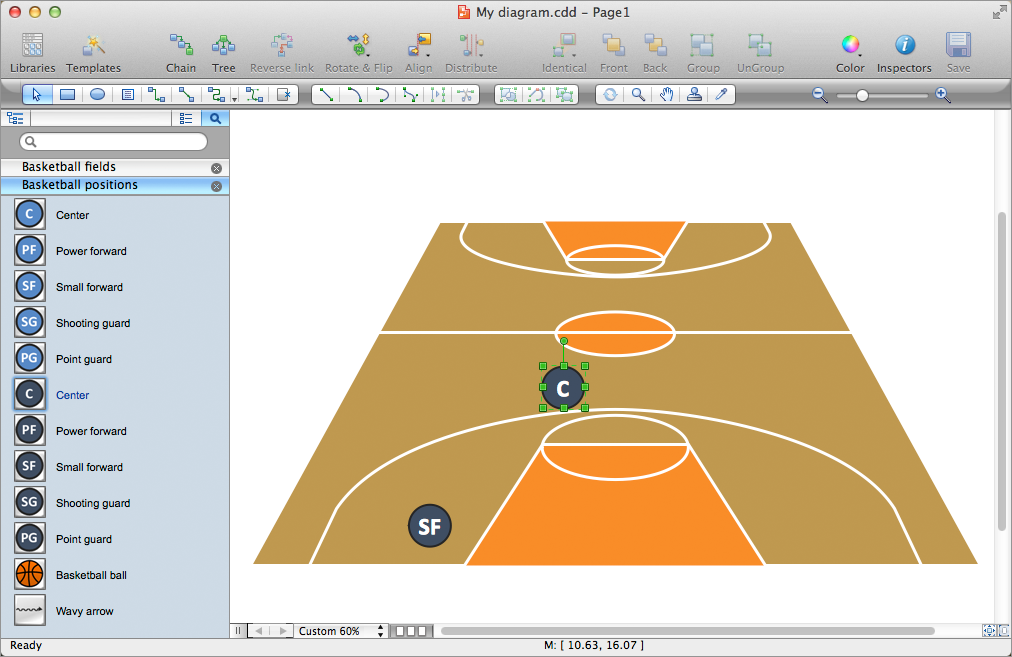
Picture: Basketball Plays Software
Related Solution:
Using diagrams is the easiest way to explain American Football defensive formations. The Football solution for ConceptDraw DIAGRAM contains a set of samples depicts the most popular defensive formations diagrams. Using embedded presentation tools you are able to share your football knowledge with wide audience.
Picture: Defensive Formation – 4-3 Defense Diagram
Related Solution:
ConceptDraw DIAGRAM software extended with the Football solution delivers samples with diagrams of the most popular offenses in American Football. You can complete this set modifying any sample. All you need is to drag and drop objects to depict another offense and then save with the different name. Feel free to add text label with the offense name directly to your document.
Picture: I Formation (Offense) Diagram
Related Solution: