
Example 3. Data Flow Diagram Examples
All Data Flow Diagram examples, templates and samples are available from ConceptDraw STORE. They can help you in your work - you can use them as examples for your own DFD diagrams, or even as the base. In this case all that you need - simply change the details of desired sample, or fill template for your needs.

Example 4. Data Flow Diagram Examples - DFD Model of Small Traditional Production Enterprise
The Data Flow Diagrams Solution contains also collection of libraries with wide variety of predesigned vector objects that will be useful in the process of Data Flow Diagrams creating.

Example 5. Data Flow Diagram Examples - DFD Coad and Yourdon Object Oriented Analysis Model
The Data Flow Diagram Examples you see on this page were created in ConceptDraw DIAGRAM using the objects from the libraries of Data Flow Diagrams Solution. These samples demonstrate the solution's capabilities and the professional results you can achieve. An experienced user spent 5 minutes creating every of them.
Use Data Flow Diagrams solution for designing your own Data Flow Diagrams quick, easy and effective.
All source documents are vector graphic documents. They are available for reviewing, modifying, or converting to a variety of formats (PDF file, MS PowerPoint, MS Visio, and many other graphic formats) from the ConceptDraw STORE. The Data Flow Diagrams Solution is available for all ConceptDraw DIAGRAM or later users.
TEN RELATED HOW TO's:
The Entity-Relationship Diagram (ERD) solution from ConceptDraw Solution Park extends ConceptDraw DIAGRAM vector graphics and diagramming software with the ability to describe a database using the Entity-Relationship (Chen) model. Use it for design your ERDs and verify that ConceptDraw DIAGRAM offers the best ERD diagrams software tools for design element Chen notation._Win_Mac.png)
Picture: Entity Relationship Diagram - ERD - Software for Design Chen ER Diagrams
Related Solution:
A wireframe is a scheme of a future web page. Wireframe illustrates the web page structure, location and size of the main elements, as well as their interaction with the user. With such scheme designer defines the functionality of the page, not its appearance.
Picture: Wireframe Tools
Related Solution:
An abstract representation is usually the first thing you will need while developing a database. To understand the ways that databases are structured, you should look through entity-relationship diagram examples and see the notations features and attributes. With an entity-relationship model you can describe a database of any complexity.
This Entity-relationship diagram is a tool for software developers. It enables every element of database to be managed, communicated and tested before release. This ERD was created using symbols advocated by Chen's notation. Because of a linguistic origin of the Chen’s notation, the boxes representing entities could be interpreted as nouns, and the relationships between them are in verb form, shown on a diagram as a diamond.
Picture: Entity Relationship Diagram Examples
Related Solution:
If you need to describe some process, diagramming is a perfect tool for almost any imaginable purpose. The set of the most commonly used flow charts symbols is quite wide and includes symbols for operations, processes, data inputs and outputs. You can see the full list of all the symbols used for flowcharting in Flowcharts solution from Diagrams area in ConceptDraw Solution Park.
A flow chart is often used for visual representation of a sequential process flow. The flowchart approach to any process is to divide it into some sequential actions. What makes a flow chart so popular and clear to make out is the set of standard flowchart symbols that has the same reading independently from processes described with their applying. The current drawing represents the vector library containing the pack of standard flowchart symbols. This library is supplied with ConceptDraw Flowcharts solution.
Picture: Flow Chart Symbols
Related Solution:
Take a look on an example of Cross-Functional-Flowchart, showing the software service cross-function process flowcharts among the different departments. It presents a simple flowchart among the customer, sales, technical support, tester and development.
Try now Flowchart Software and Cross-Functional library with 2 libraries and 45 vector shapes of the Cross-Functional Flowcharts solution. Then you can use built-in templates to create and present your software service cross-function process flowcharts.
Picture: Cross Functional Flowchart Examples
Data Flow Diagram (DFD) is a way of representing a flow of data through a process or a system, which indicates the outputs and inputs of the process, and interactions between the system and external entities. Two types of notations are used in common: Yourdon & Coad and Gane & Sarson. ConceptDraw DIAGRAM software extended with Data Flow Diagrams (DFD) solution provides powerful drawing tools to create Data Flow Diagram of any complexity. Provide the required clarity to the system or process, show the logic and functions, and explain complex concepts and business operations in a visual way using the DFD format.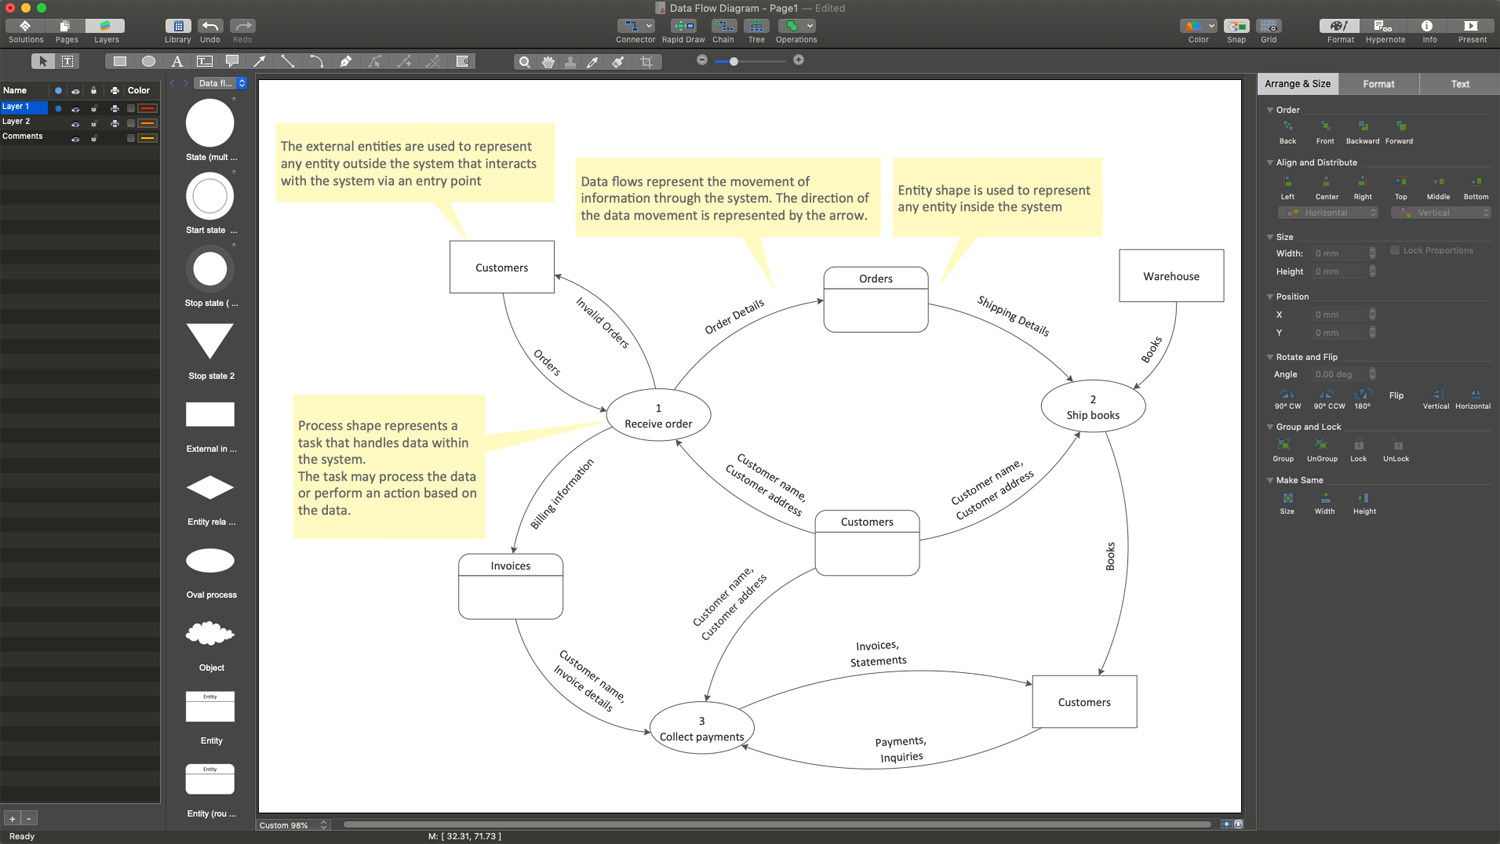
Picture: Tools to Create Data Flow Diagram
Related Solution:
ConceptDraw is rapid and powerful network diagram drawing software with rich examples, templates, design objects and stencils.
Picture: Draw Network Diagram based on Templates and Examples
Fishbone Diagram, also referred as Cause and Effect diagram or Ishikawa diagram, is a fault finding and problem solving tool. Construction of Ishikawa diagrams is quite complicated process and has a number of features.
Fishbone Diagrams solution included to ConceptDraw Solution Park contains powerful drawing tools and a lot of examples, samples and templates. Each Fishbone diagram example is carefully thought-out by experts and is perfect source of inspiration for you.
Picture: Fishbone Diagram Example
Related Solution:
To create an Audit Process FlowChart you only need Conceptdaw Software.
Picture: Basic Audit Flowchart. Flowchart Examples
Related Solution:
The Social Media Response solution provides the means to respond to social media mentions quickly and professionally. This tool keeps the entire team on the same page allowing you to realize your social media strategy, improve the quality of your answers, and minimize the time it takes to respond.
Picture: Manage Social Media Response Plan DFD
Related Solution:


