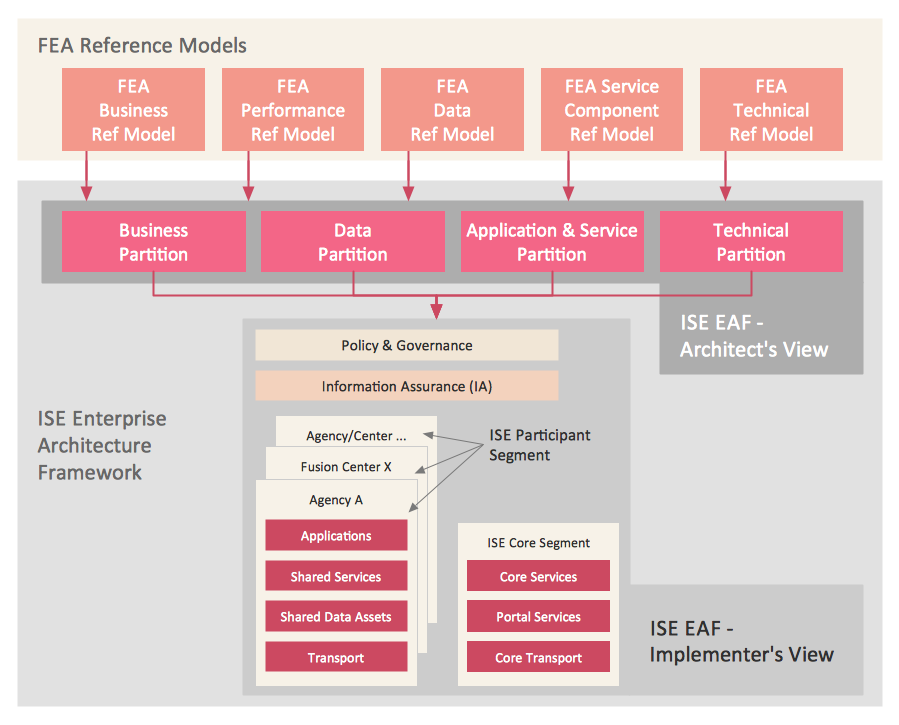
Example 1. What Is Information Architecture?
What Is Information Architecture? Don't miss the chance to use templates and samples included in the Enterprise Architecture Diagrams Solution to explain this term to the colleagues, students or interlocutors.

Example 2. Enterprise Architecture Diagrams Solution in ConceptDraw STORE
All templates and samples are available for viewing and editing from ConceptDraw STORE, and also can became the good start and source of inspiration for you.

Example 3. Enterprise Architecture Diagram Template
This Enterprise Architecture Diagram template was created in ConceptDraw DIAGRAM using the Enterprise Architecture Diagrams Solution and is included to this solution. It is available from ConceptDraw STORE and can be used to quick and easy design the diagrams explaining what is information architecture.
All source documents are vector graphic documents. They are available for reviewing, modifying, or converting to a variety of formats (PDF file, MS PowerPoint, MS Visio, and many other graphic formats) from the ConceptDraw STORE. The Enterprise Architecture Diagrams Solution is available for all ConceptDraw DIAGRAM or later users.
TEN RELATED HOW TO's:
Lean Six Sigma (LSS) is a well-known in all over the world methodology of quality improvement and business perfection. ConceptDraw DIAGRAM diagramming and vector drawing software is a powerful Lean Six Sigma Diagram Software thanks to the included Value Stream Mapping solution from the Quality Management Area of ConceptDraw Solution Park.
Picture: Lean Six Sigma Diagram Software
Related Solution:
Every day designers of the whole world create, develop and depict their ideas in landscape design drawings for further implementing them to the life. ConceptDraw DIAGRAM software provides the Site Plans Solution from the Building Plans Area for quick and easy creating detailed site plans, landscape design drawings, plant maps, etc.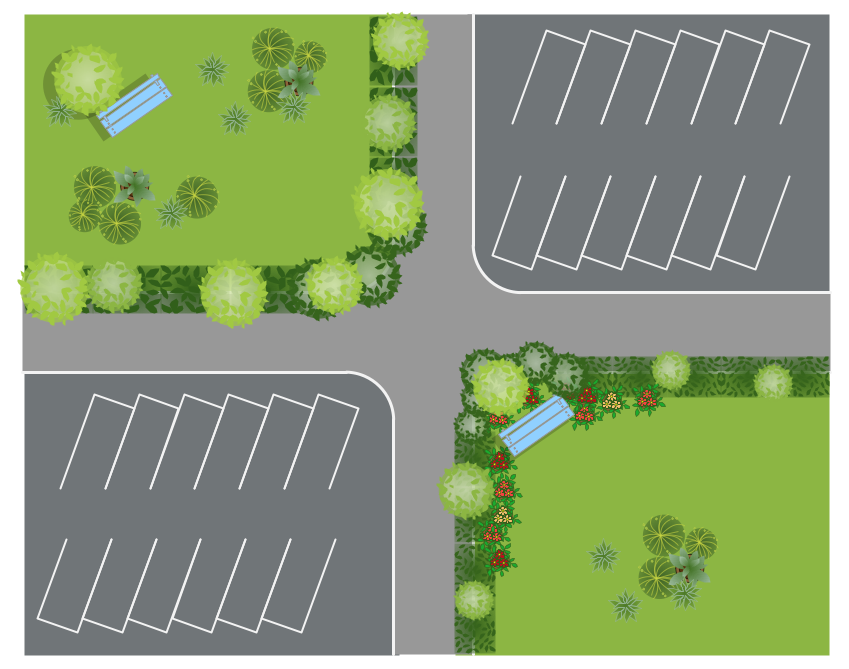
Picture: Landscape Design Drawings
Related Solution:
This sample shows the Flowchart that displays the process of the achievement the consensus, in other words solving for the acceptable solution.
This Flowchart has start point. The rectangles on it represent the steps of the process and are connected with arrows that show the sequence of the actions. The diamonds with yes/no shows the decisions. The Flowcharts are widely used in marketing, business, analytics, government, politics, engineering, architecture, science, manufacturing, administration, etc.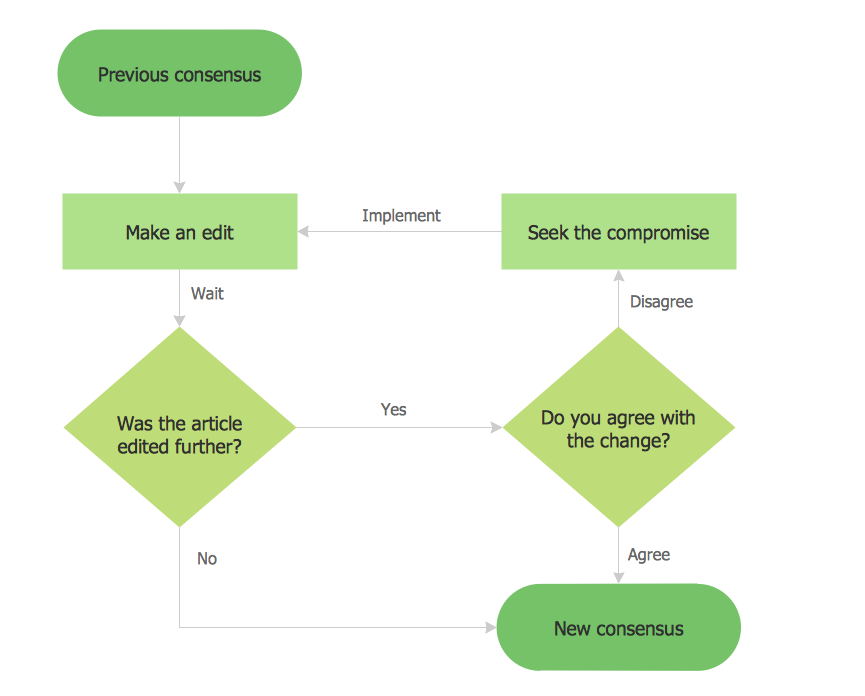
Picture: Example Basic Flowchart. Flowchart Examples
Related Solution:
You need design a Bank UML Diagram? Now, thanks to the ConceptDraw DIAGRAM diagramming and vector drawing software extended with ATM UML Diagrams Solution from the Software Development Area, you can design without efforts any type of Bank UML Diagram you want - Class, Activity, Communication, Component, Composite structure, Deployment, Interaction overview, Object, Package, Profile, Sequence, State machine, Timing, Use case.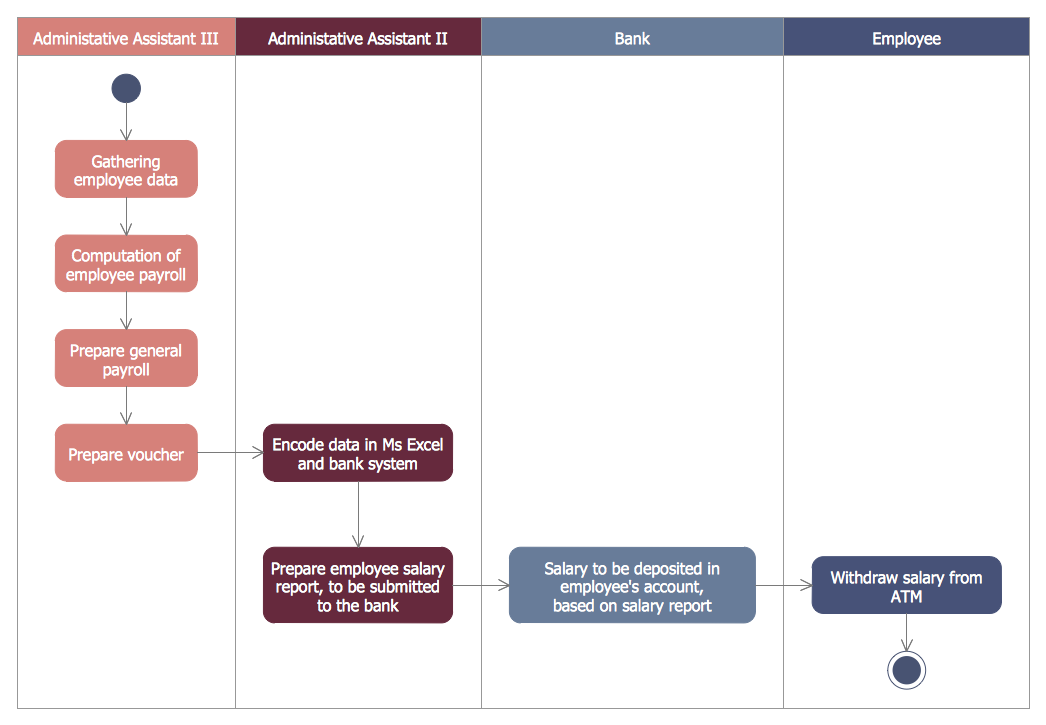
Picture: Bank UML Diagram
Related Solution:
Architect Software — Create electrical diagrams, architectural designs using ConceptDraw.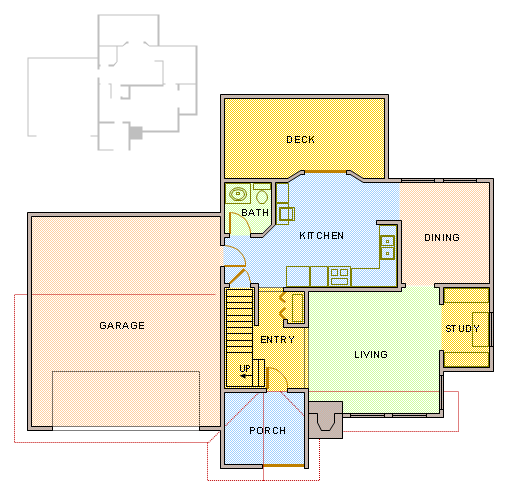
Picture: How To use Architect Software
Related Solution:
The network architecture and design specialization will help you gain the technical leadership skills you need to design and implement high-quality networks that support business needs.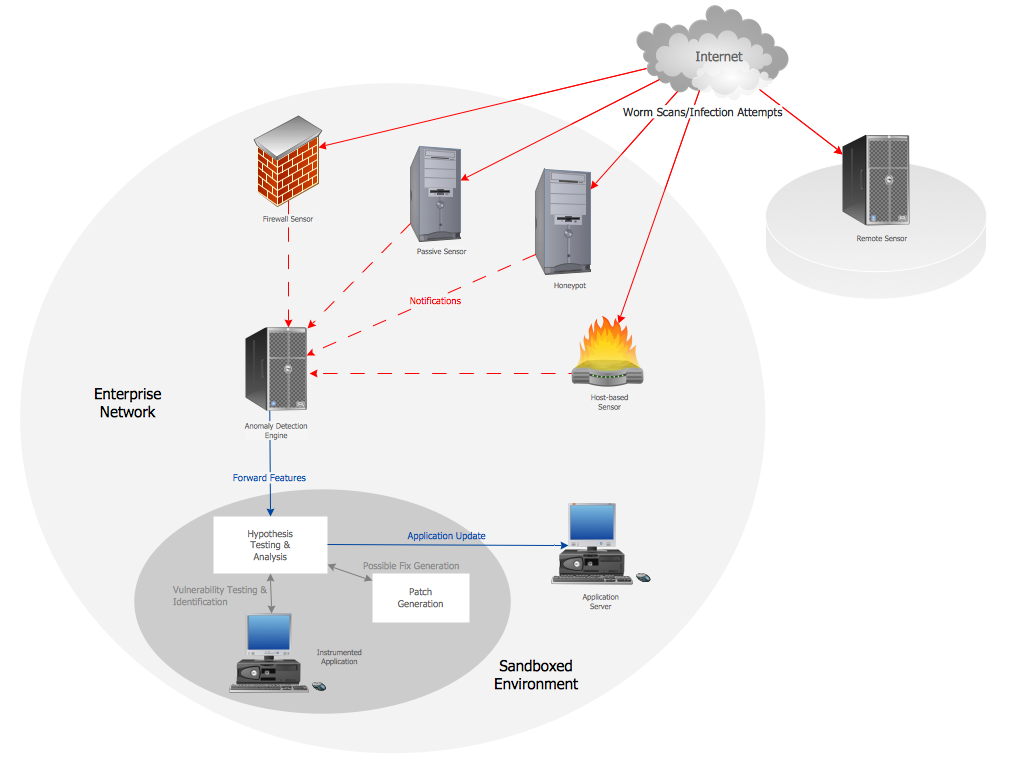
Picture: Computer Network Architecture. Computer and Network Examples
There are many ways to define the flow of information within a system. Structured-systems analysis method often uses data flow diagrams to show data flow, data storages and data processing visualization. These diagrams are easy to develop and quite useful.
Here is a dataflow diagram presenting an example of the manufacturing process flow. The oval process shapes represent a process that controls data within the current system. The process may produce data or make some action based on data. Data flows are represented by lines. They show the movement of information through the system. The direction of the data flow is depicted by the arrow. The external entities are shown by rectangles. They represent the external entities interacting with the system. The data store objects (unclosed rectangles) are used to show data bases participating in a process flow.
Picture: Data Flow Diagram
Related Solution:
Our DFD software ConceptDraw DIAGRAM allows you to quickly create DFD with data storages, external entities, functional transforms, data flows, as well as control transforms and signals. DFD program ConceptDraw DIAGRAM has hundreds of templates, and a wide range of libraries with all nesassary ready-made drag-and-drop.
Picture: ConceptDraw DIAGRAM DFD Software
The Accounting flowchart shows how information flows from source documents through the accounting records. The are based on the accounting procedures or processes.
Flowcharts are used to represent accounting information in a system. There are special symbols which are used to create accounting flowcharts. Try conceptdraw flowcharting set of symbols to draw a professional charts.
Picture: Why Flowchart Important to Accounting Information System?
Related Solution:
Do you like the professional schemes that you can find on the Internet? Take into account that the most part of them is made using the Best Flowchart Software and Flowchart Symbols. Try you own powers in creating such diagrams!
Flowcharts are the most business diagramming tool. If you are a business manager, you can use flow chart to depict work flow in your organization, develop the effective organizational structure and present the information to investors or other stakeholders. Combining the smart management solutions with ConceptDraw DIAGRAM diagramming engine delivers the set of comprehensive flowchart tools necessary to support professionals in their creativeness and business activity.
Picture: Best Flowchart Software and Flowchart Symbols
Related Solution:

