Made with
ConceptDraw
DIAGRAM 18

What is Cloud Computing

What is Cloud Computing? The Cloud Computing is a type of internet-based computing that provides the ubiquitous and convenient access on-demand to the data and shared configurable computing resources (as for example, networks, storage, servers, applications, services) for computers and other devices.

The Cloud computing is a widely used and highly demanded utility in the modern world thanks to its high computing power, performance, scalability and accessibility, and at the same time low cost of services. This service allows the enterprises effectively store and process their data in third-party data centers, that allows companies to run faster with minimal management efforts.

As for the origin of the "cloud computing" term, the "cloud" was initially used to denote a network on telephony schematics and later to depict the Internet on the computer network diagrams.

The ConceptDraw DIAGRAM diagramming and vector drawing software provides an easy and effective Cloud Computing Diagrams solution from the Computers and Network area of ConceptDraw Solution Park for making professional looking Cloud Computing and Cloud Computing Architecture Diagrams.

What is Cloud Computing *

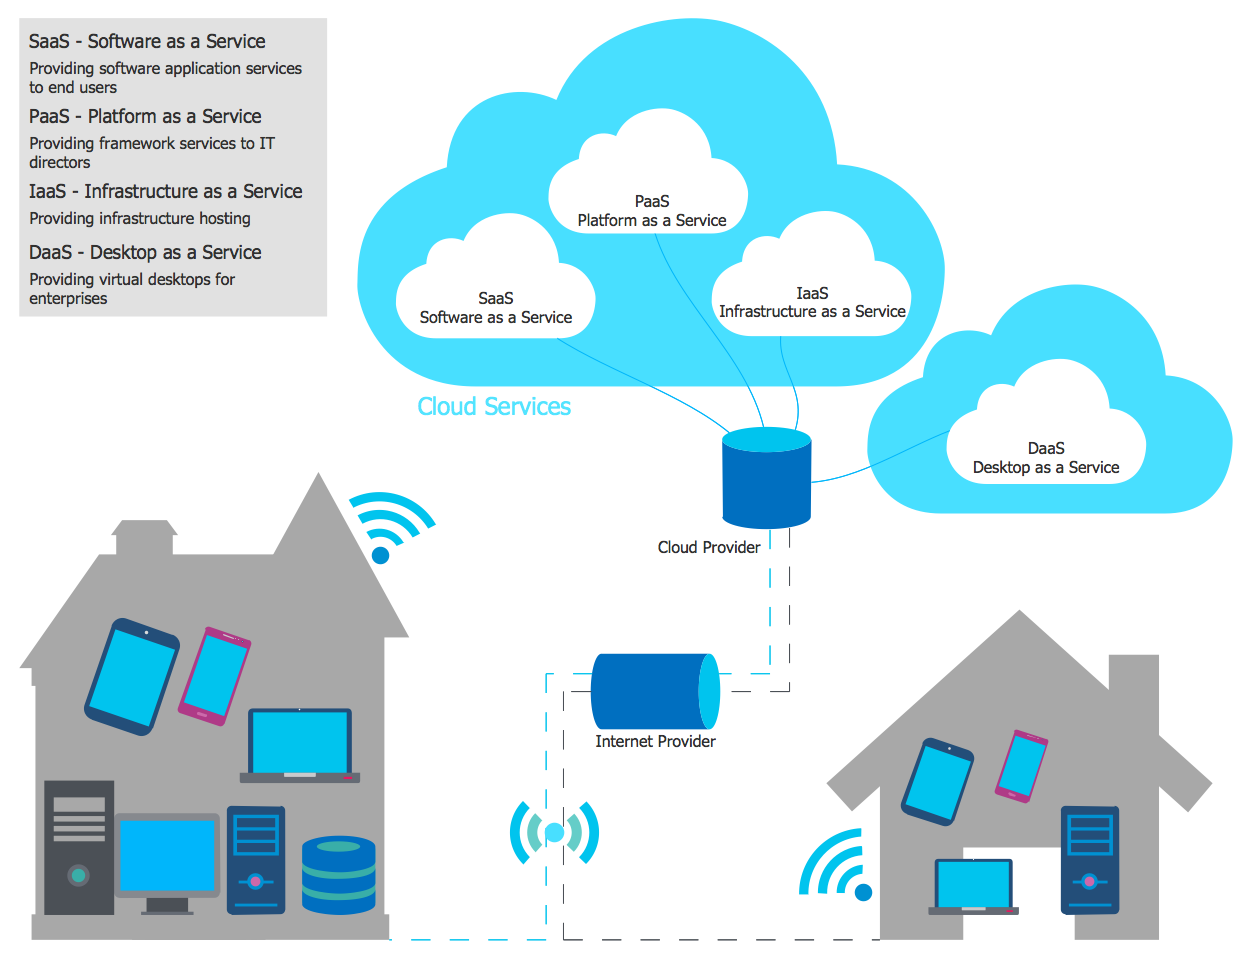
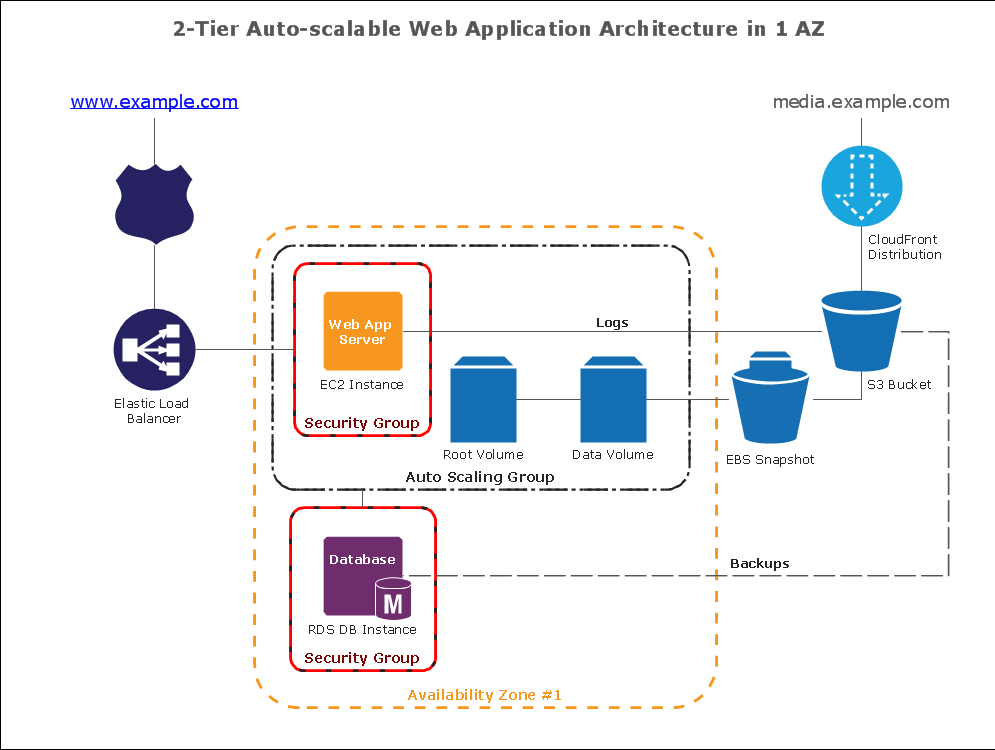
Example 1. What is Cloud Computing

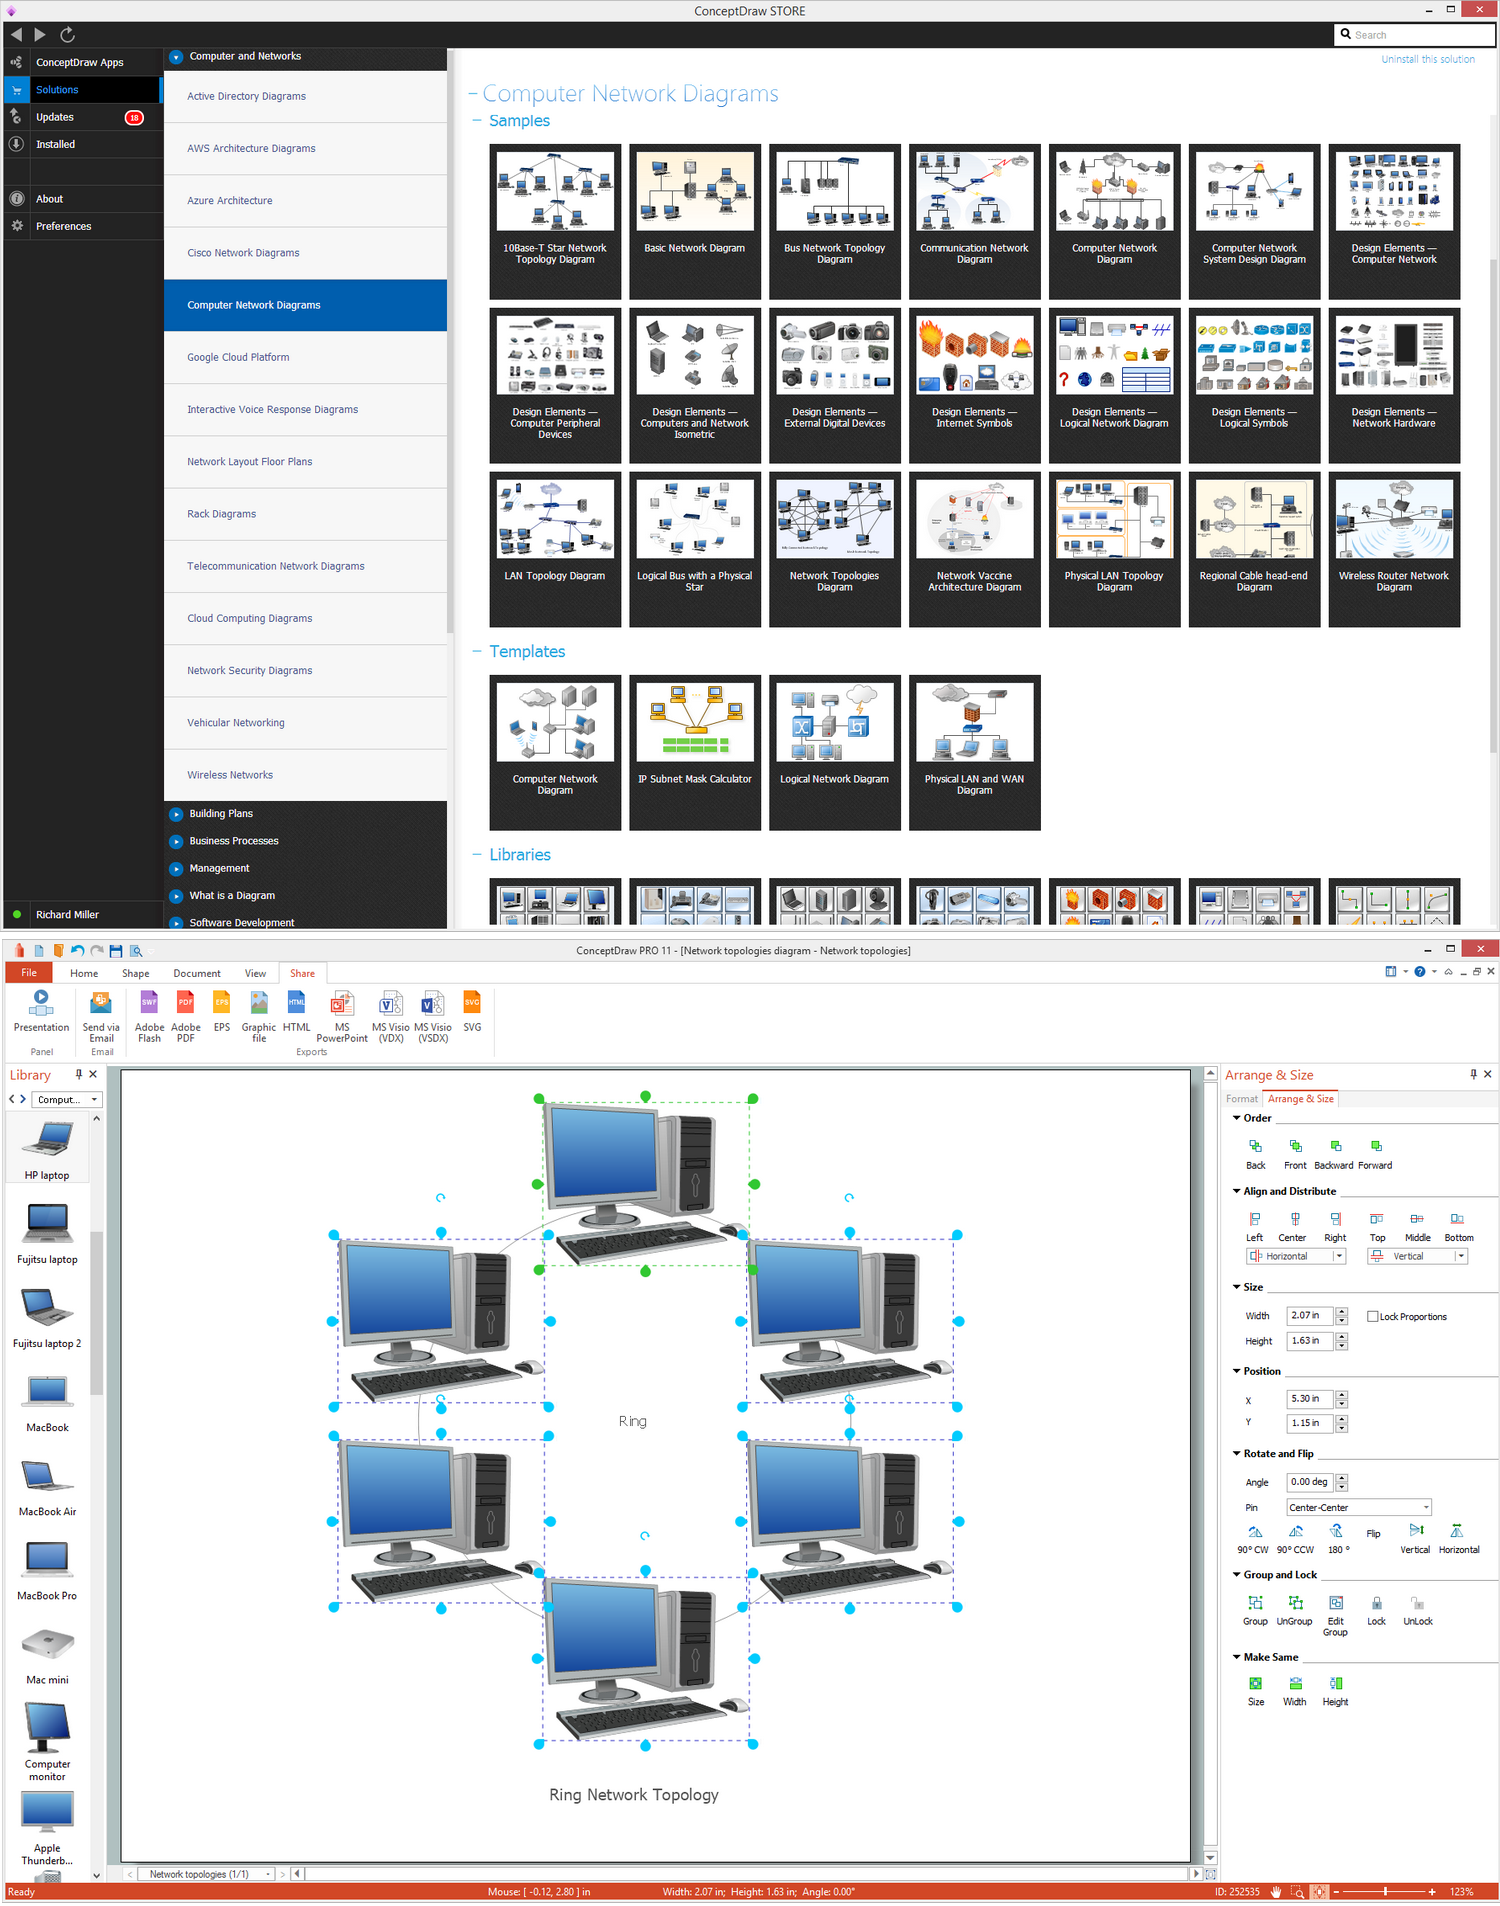
With Cloud Computing Diagrams Solution you don't need to be an artist! This solution provides large amount of predesigned samples which are offered for ConceptDraw DIAGRAM users in ConceptDraw STORE. You can use any of them as the source of inspiration or as the base for your own diagram.

Cloud Computing Diagrams Solution in ConceptDraw STORE

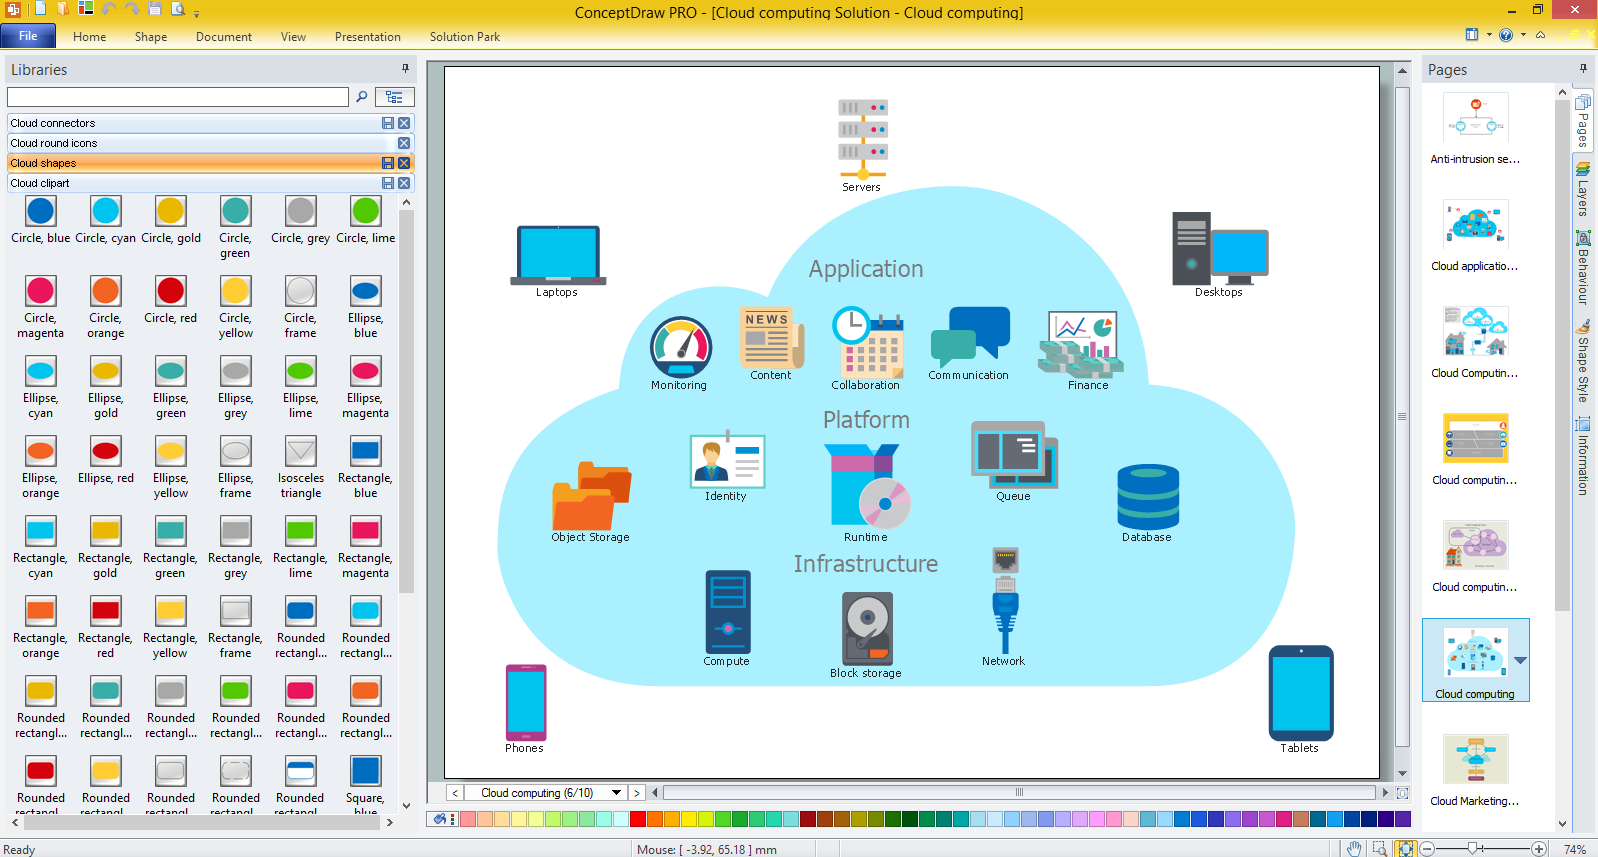
Example 2. Cloud Computing Diagrams Solution in ConceptDraw STORE

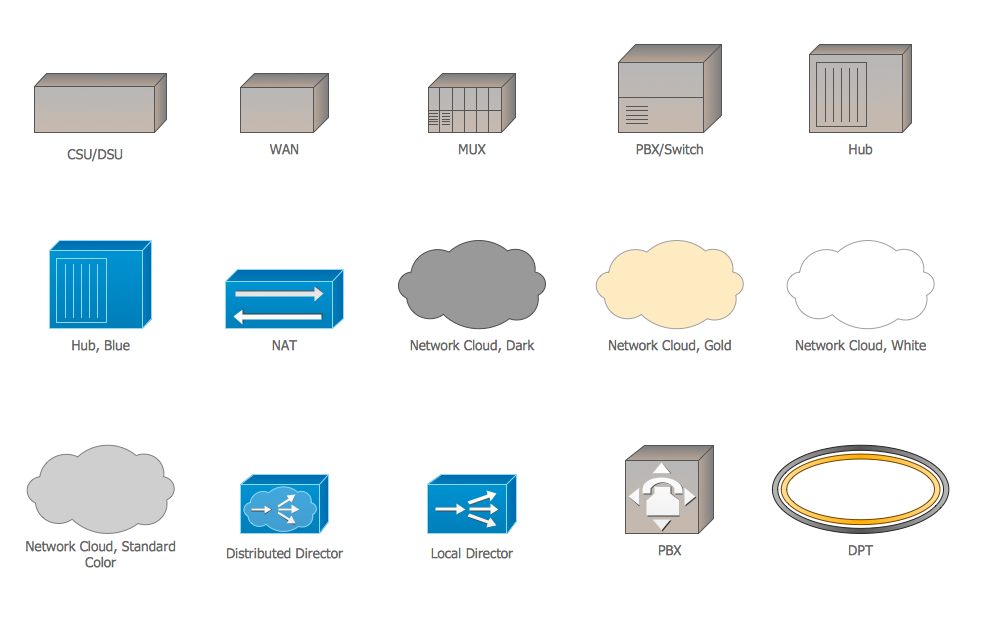
The Cloud Computing Diagrams Solution is also rich for the libraries of ready-to-use objects, clipart and connectors which will help you to get excellent results in mere minutes.

All these objects are vector, you can resize them without loss of quality, change their color to make your diagrams more interesting, bright and attractive.

Cloud Computing Types

Example 3. Cloud Computing Types

The diagrams representing what is Cloud computing you see on this page were created in ConceptDraw DIAGRAM software using the extensive tools of Cloud Computing Diagrams Solution for ConceptDraw Solution Park. An experienced user spent 5 minutes creating each of these samples.

Use the Cloud Computing Diagrams Solution for ConceptDraw DIAGRAM to design your own professional looking Cloud Computing diagrams fast, easy and effective.

All source documents are vector graphic documents. They are available for reviewing, modifying, or converting to a variety of formats (PDF file, MS PowerPoint, MS Visio, and many other graphic formats) from the ConceptDraw STORE. The Cloud Computing Diagrams Solution is available for all ConceptDraw DIAGRAM users.


NINE RELATED HOW TO's:
The Ring Network Topology Diagram examples was created using ConceptDraw DIAGRAM software with Computer and Networks solution.Ring Network Topology *
Picture: Ring Network Topology
Related Solution:
Want to create Diagrams for Amazon Web Services architecture? ConceptDraw Solution Park with AWS architecture Solution will help you!How To create Diagrams for Amazon Web Services architecture *
Picture: How To create Diagrams for Amazon Web Services architecture
The Nature Solution addition to ConceptDraw Solution Park for ConceptDraw DIAGRAM includes new libraries that provide a wide range nature objects and it can be used in many areas.Drawing Illustration‎ *
Picture: Drawing Illustration‎
The ConceptDraw vector stencils library Cisco WAN contains equipment symbols for drawing the computer wide area network diagrams.Cisco WAN. <br>Cisco icons, shapes, stencils and symbols *
Picture: Cisco WAN. Cisco icons, shapes, stencils and symbols
Related Solution:
A list of parameters on which networks differ is very long. A large network with a range up to 50 kilometers is called metropolitan area network (MAN), and this type of network can include several local area networks. Metropolitan networks in their turn connect into global area networks. Here you will see a Metropolitan Area Network (MAN). This is an extensive network which occupies a large territory including a few buildings or even the whole city. The space of the MAN is bigger than LAN, but lower than WAN. MAN comprise a lot of communication equipment and delivers the Internet connection to the LANs in the city area. Computer and Networks solution for ConceptDraw DIAGRAM provides a set of libraries with ready-to-use vector objects to design various kinds of computer networks.Metropolitan area networks (MAN). Computer and Network Examples
Picture: Metropolitan area networks (MAN). Computer and Network Examples
Related Solution:
AWS platform is great to develop reliable applications. If you are already aware of all the benefits that Amazon Web Services diagrams bring, then you'll need also a diagramming tool for architecture to share your vision. Luckily, ConceptDraw DIAGRAM has a special AWS Diagrams solution with vector icons and templates that are easy to edit. The AWS architecture diagram, you see on this drawing, was designed using ConceptDraw Amazon Web Services Architecture Diagrams (AWS) solution. The 14 libraries, delivered with this solution introduces near 250 vector graphic images used to draw AWS Diagrams. The AWS Architecture Diagrams solution is a valuable tool for programmers, software architects and other IT professionals. It enables them to develop reliable applications with a high stage of interaction with AWS cloud.Amazon Web Services Diagrams <br>diagramming tool for architecture *
Picture: Amazon Web Services Diagrams diagramming tool for architecture
Mind map of a physical activity sample plan detailing a proposal to incorporate more physical activity into a college community.Physical Activity Plan *
Picture: Physical Activity Plan
Related Solution:
While creating flowcharts and process flow diagrams, you should use special objects to define different statements, so anyone aware of flowcharts can get your scheme right. There is a short and an extended list of basic flowchart symbols and their meaning. Basic flowchart symbols include terminator objects, rectangles for describing steps of a process, diamonds representing appearing conditions and questions and parallelograms to show incoming data. This diagram gives a general review of the standard symbols that are used when creating flowcharts and process flow diagrams. The practice of using a set of standard flowchart symbols was admitted in order to make flowcharts and other process flow diagrams created by any person properly understandable by other people. The flowchart symbols depict different kinds of actions and phases in a process. The sequence of the actions, and the relationships between them are shown by special lines and arrows. There are a large number of flowchart symbols. Which of them can be used in the particular diagram depends on its type. For instance, some symbols used in data flow diagrams usually are not used in the process flowcharts. Business process system use exactly these flowchart symbols.Basic Flowchart Symbols Meaning
Picture: Flowchart Symbols: Meaning and Examples
Related Solution:
A flowchart is a simple but very functional tool when it comes to understanding a workflow or to removing unnecessary stages from a process. When drawing flowcharts, keep in mind that there are four common types of flowcharts, like document flowcharts and data flowcharts that show control over a data or document flow over a system. To show controls on a physical level, use system flowcharts. In addition, to show controls in a program, you can draw a program flowchart. This flowchart diagram represents the piece of an article editing process, that involves the author and editor. It was created using the Basic Flowchart notation that consists from the basic flowchart symbols. The start and the end of the process are indicated with "Terminator" symbols. The "Process" symbols show the action steps consisting from making edits and searching for a compromise, when the author does not agree with the suggestions of the editor. The "Process" symbol is the general symbol in process flowcharts. The "Decision" symbol indicates a branching in the process flow. There are two branches indicated by a Decision shape in the current flowchart (Yes/No, Disagree/Agree). This basic flowchart can be used as a repeating unit in the workflow diagram describing the working process of some editorial office.Types of Flowcharts *
Picture: Types of Flowcharts
Related Solution:
ConceptDraw
DIAGRAM 18