Cyber Security Degrees
Cyber security is the defense of information and computer systems from various attacks and threats, from the damage the hardware and software, from the theft of the information stored on them, and from the disruption and misdirection of services which they provide. The reliance on various computer and networked systems increases day by day, but all them are sufficiently vulnerable and so the need for cyber security acquires more and more importance, it includes protection from the damages due to the network access, the control of physical access to the hardware, the control of intentional and accidental malpractice by operators.
Increase of variety and quantity of cyber threats is lead to the active development of cyber security field today. For protection various cyber environments are developed and applied large variety of cyber security standards, techniques, security concepts and approaches with different cyber security degrees. But the main common objective of all them is reduce the risks, increase privacy and security, provide a reliable protection of computers, programs, networks and data from damages and unauthorized access, and effectively prevent the cyber attacks and cyber threats.
The ConceptDraw DIAGRAM diagramming and vector drawing software extended with Network Security Diagrams Solution from the Computer and Networks Area of ConceptDraw Solution Park offers the number of useful tools which will help network security engineers, cyber security specialists, network and computer analysts easily and visually depict the knowledge and skills for research and prevention of intrusions, about maintenance of security protocols on computer networks of various sizes, about protection critical information and analysis of cyber incidents, and for how to assess threats and vulnerabilities.
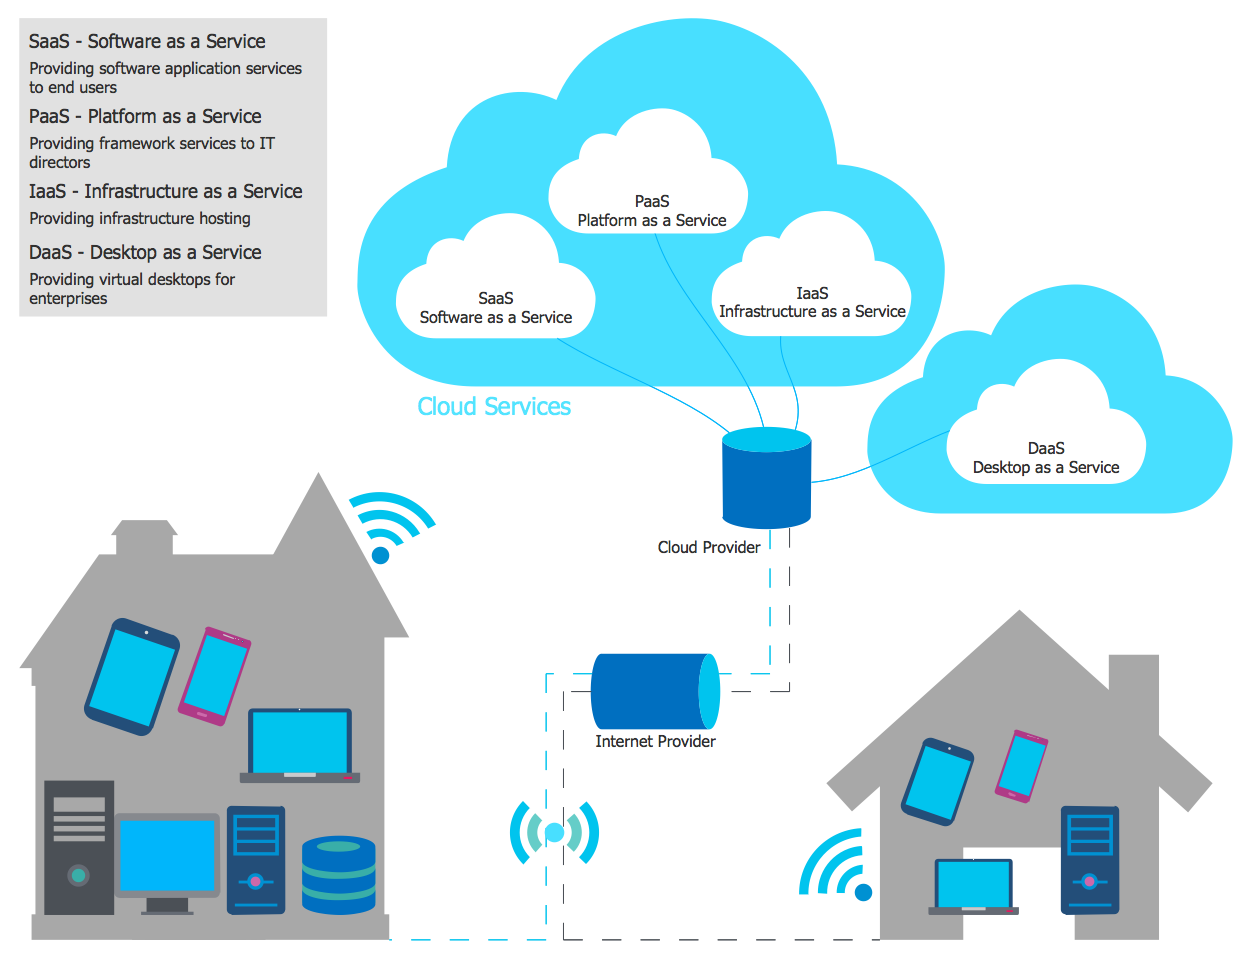
Example 1. Cyber Security Degrees
Network Security Diagrams Solution for ConceptDraw DIAGRAM is incredibly useful for effective network security schemes design with different cyber security degrees thanks primarily to 4 libraries with numerous quantity of predesigned vector objects:
- Cybersecurity Clipart
- Cybersecurity Round Icons
- Cybersecurity Shapes
- Cybersecurity Connectors
Start create your diagram by dragging the objects from these libraries to your ConceptDraw document and evaluate the usability of using fully ready-to-use objects.

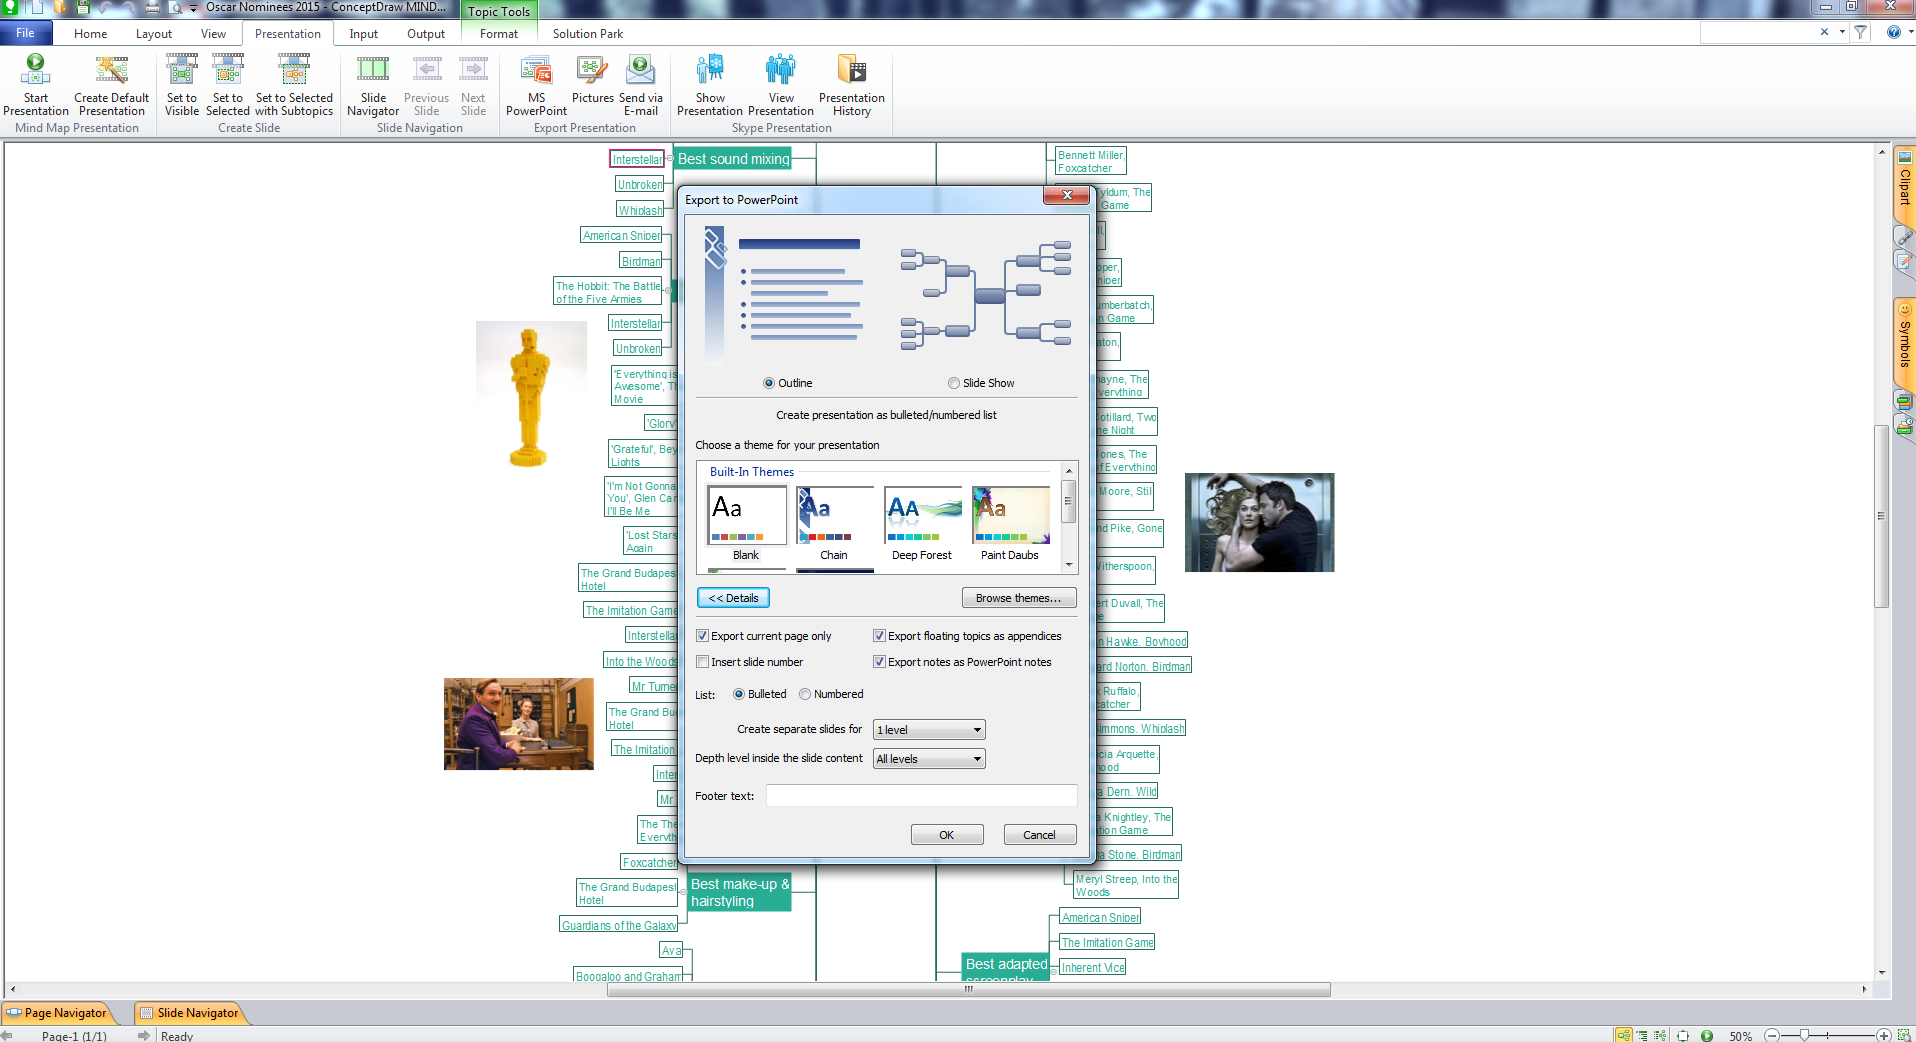
Example 2. Network Security Diagrams Solution in ConceptDraw STORE
Network Security Diagrams solution provides also wide collection of predesigned network security samples which are available from ConceptDraw STORE. Each of offered samples is carefully thought-out by experts and can be used as easy start for your own diagrams. Pay attention for them and get excellent result in a few minutes!

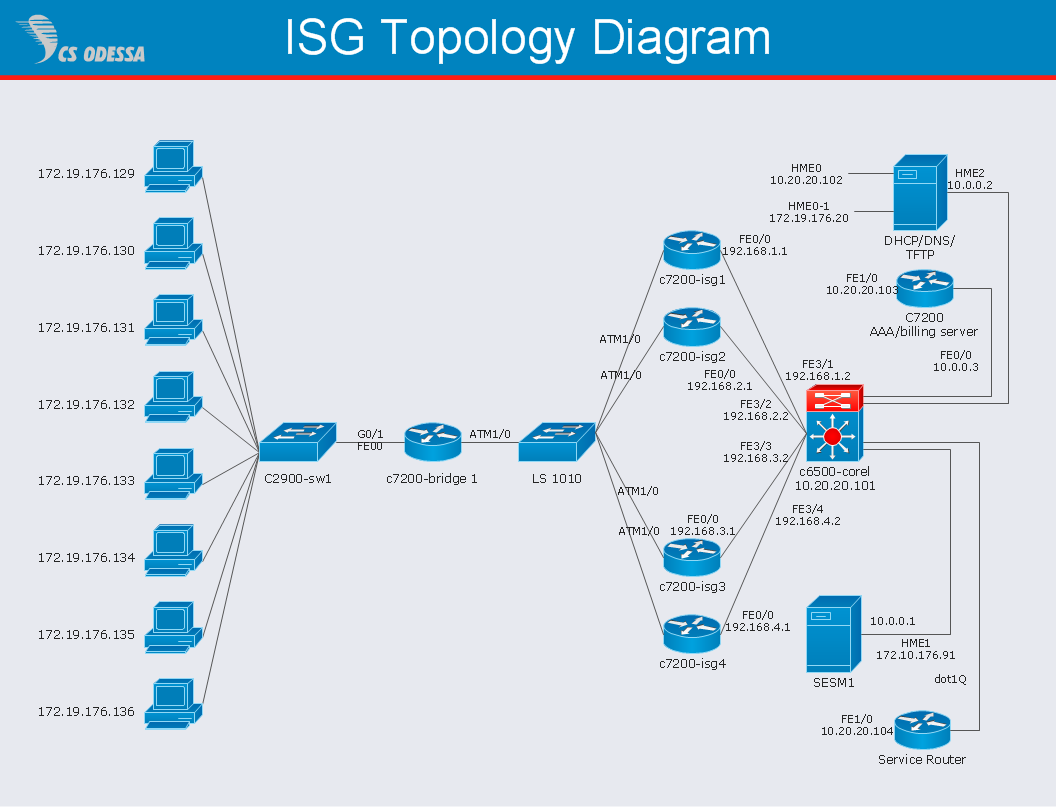
Example 3. Network Security Diagram - Recommended Network Architecture
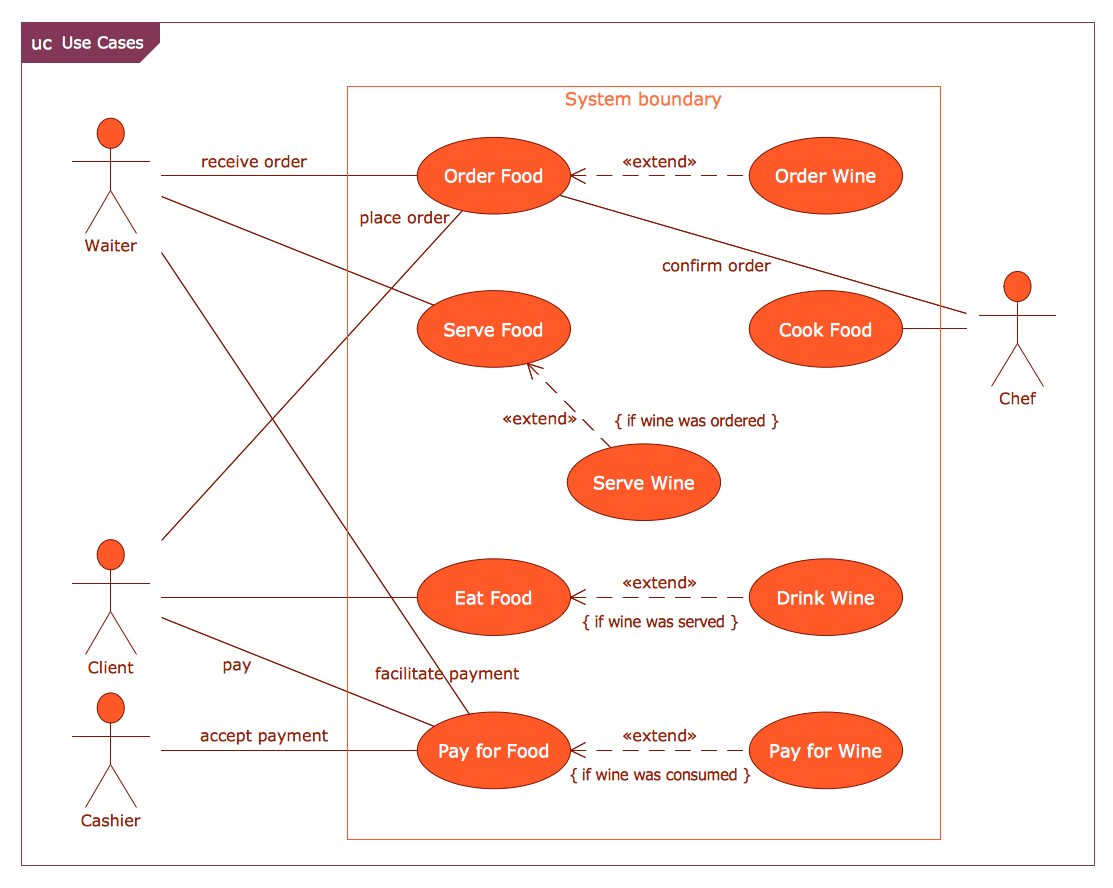
The samples you see on this page were created in ConceptDraw DIAGRAM using the predesigned vector objects from the libraries of Network Security Diagrams Solution. An experienced user spent 10-15 minutes creating each of these samples.
Use the Network Security Diagrams Solution for ConceptDraw DIAGRAM to create your own Network Security Diagrams of any cyber security degrees fast, easy and effective.
All source documents are vector graphic documents. They are available for reviewing, modifying, or converting to a variety of formats (PDF file, MS PowerPoint, MS Visio, and many other graphic formats) from the ConceptDraw STORE. The Network Security Diagrams Solution is available for all ConceptDraw DIAGRAM users.
EIGHT RELATED HOW TO's:
ConceptDraw DIAGRAM extended with Block Diagrams solution is a powerful software to draw Block Diagrams. Being supplied with a large set of pre-made vector shapes and connectors, a lot of professionally designed samples and templates, it allows all its users to design effortlessly even the most complex Block Diagrams.
Picture: Software to Draw Block Diagrams
Related Solution:
An onion diagram is a kind of chart that shows the dependencies among parts of an organization or process. The chart displays items in concentric circles, where the items in each ring depend on the items in the smaller rings. The Onion Diagram is able to show layers of a complete system in a few circles.
But how to create Onion Diagram? Now, it's very easy thanks to the ConceptDraw DIAGRAM diagramming and vector drawing software extended with Stakeholder Onion Diagrams Solution from the Management Area of ConceptDraw Solution Park.
Picture: How To Create Onion Diagram
Related Solution:
Dynamic of development computer and network technologies increases the need in modern cyber security strategies and IT security solutions to support security of your data, to ensure data privacy, and to protect your operations from the cyber threats. Thanks to the Network Security Diagrams Solution from the Computer and Networks Area of ConceptDraw Solution Park, the ConceptDraw DIAGRAM diagramming and vector drawing software is one of the unique IT security solutions for professional designing Network Security Diagrams.
Picture: IT Security Solutions
Related Solution:
A concept map is a way of representing relationships between ideas, images, or words.
How to draw a Concept Map quick, easy and effective? ConceptDraw DIAGRAM offers the unique Concept Maps Solution from the Diagrams Area that will help you!
Picture: Concept Map
Related Solution:
Use the ConceptDraw DIAGRAM diagramming and vector drawing software enhanced with powerful tools of Network Security Diagrams Solution from the Computer and Networks Area of ConceptDraw Solution Park to effectively visualize the importance of network security and wireless network security, and ways to ensure them, to easily design Network Security Diagrams and Maps, Network Security Model, Secure Wireless Network and Network Security Architecture diagrams.
Picture: Secure Wireless Network
Related Solution:
This sample shows the Perceptual map. It was created in ConceptDraw DIAGRAM diagramming and vector drawing software using the Matrices Solution from the Marketing area of ConceptDraw Solution Park.
Perception Mapping helps organizations measure and transform all aspects of their business, people and culture. Perception Mapping allows to represent the complex relationships graphically, helps identify potential problems of the organization and make the best decisions.
Picture: Business Tools Perceptual Mapping
Related Solution:
The entity–relationship (ER) model is a data model that lets graphically represent the information system and depict the relationships between people, objects, concepts, places, and events within a given system. It is also convenient to use the ER Diagram for Cloud computing representation and description the Cloud computing architecture, design them with pleasure using the extensive tools of the Cloud Computing Diagrams solution from the Computers and Network area of ConceptDraw Solution Park.
Picture: ER Diagram for Cloud Computing
Related Solution:
Network infrastructure planning is a very important process in the network construction, and the share of time allocated to this within the scope of the entire project may reach 60-80%. A competent and thorough approach to planning contributes to the quick investment return, and also increases the reliability and flexibility of the final system, reducing the probability of additional costs related to the incorrect implementation.
Any planning begins with an analysis of the business requirements to the final system. Basic network parameters, which should be assessed are the scalability, accessibility, cost, speed and safety.
Speed and cost are often mistaken for the most important parameters, and the rest of the parameters aren't even remembered. This is not entirely correct. Initially, it is necessary to assess the business plans for the future, because sometimes it is more profitable to invest more money in the beginning. If the business is to develop, then, consequently, demands on
Picture: Cisco Routers. Cisco icons, shapes, stencils and symbols
Related Solution: