
Example 1. Cause and Effect Diagram - Production Process
Fishbone Diagrams Solution from ConceptDraw Solution Park extends ConceptDraw DIAGRAM ector graphics and diagramming software with the ability to draw professional looking Cause and Effect Diagram without efforts.

Example 2. Fishbone Diagrams Library Design Elements
It offers you the Fishbone Diagrams library with numerous collection of ready-to-use vector objects, and also set of predesigned Fishbone, Ishikawa, and Cause and Effect Diagrams.

Example 3. Cause and Effect Diagram - Increase in Productivity
The Cause and Effect Diagram samples you see on this page were created in ConceptDraw DIAGRAM software using the tools of the Fishbone Diagrams Solution. An experienced user spent 10 minutes creating each of these Cause and Effect Diagrams.
Use the Fishbone Diagrams Solution for ConceptDraw DIAGRAM Solution Park for quick, easy and effective Cause and Effect Diagram creating.
All source documents are vector graphic documents. They are available for reviewing, modifying, or converting to a variety of formats (PDF file, MS PowerPoint, MS Visio, and many other graphic formats) from the ConceptDraw STORE. The Fishbone Diagrams Solution is available for all ConceptDraw DIAGRAM or later users.
TEN RELATED HOW TO's:
Semiconductors are crystalline or amorphous solids with distinct electrical characteristics. They are of high resistance — higher than typical resistance materials, but still of much lower resistance than insulators. Their resistance decreases as their temperature increases, which is behavior opposite to that of a metal. Finally, their conducting properties may be altered in useful ways by the deliberate, controlled introduction of impurities into the crystal structure, which lowers its resistance but also permits the creation of semiconductor junctions between differently-doped regions of the extrinsic semiconductor crystal. The behavior of charge carriers which include electrons, ions and electron holes at these junctions is the basis of diodes, transistors and all modern electronics.
26 libraries of the Electrical Engineering Solution of ConceptDraw DIAGRAM make your electrical diagramming simple, efficient, and effective. You can simply and quickly drop the ready-to-use objects from libraries into your document to create the electrical diagram.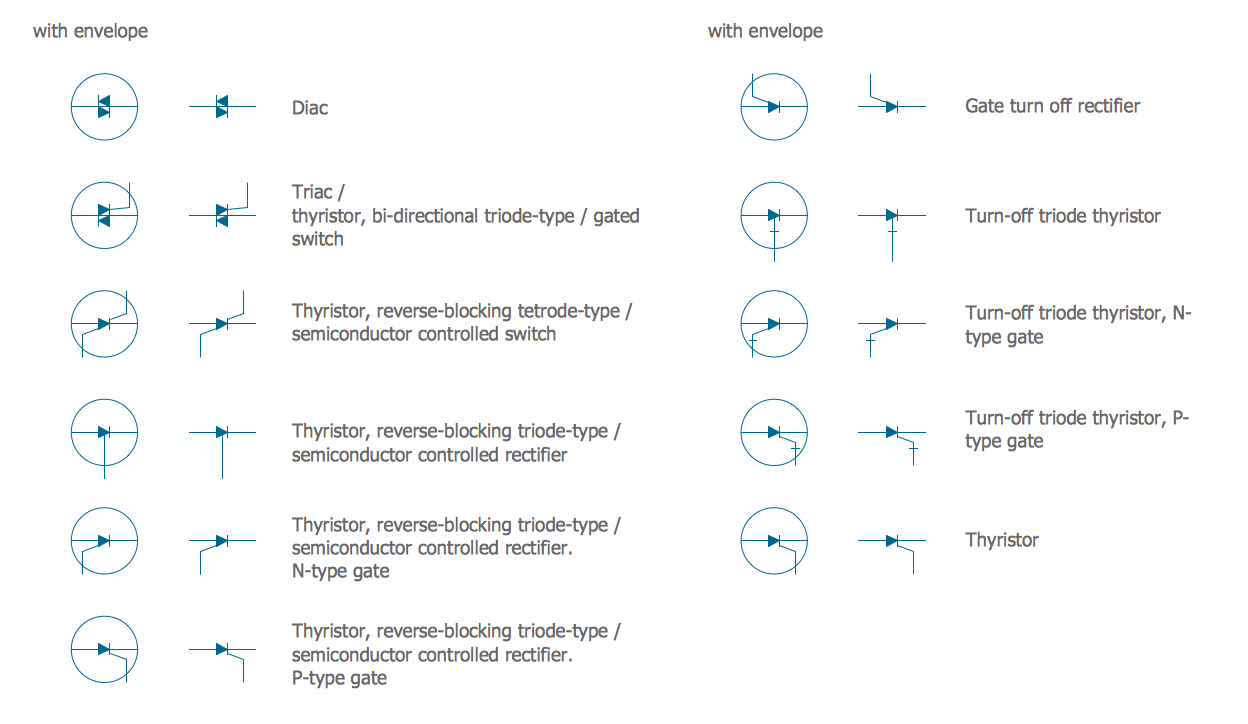
Picture: Electrical Symbols — Semiconductor
Related Solution:
ConceptDraw DIAGRAM software extended with Workflow Diagrams solution ideally suits for effective business process optimization, for determination the opportunities for improvements and enhancements the processes, cost reduction and cost savings.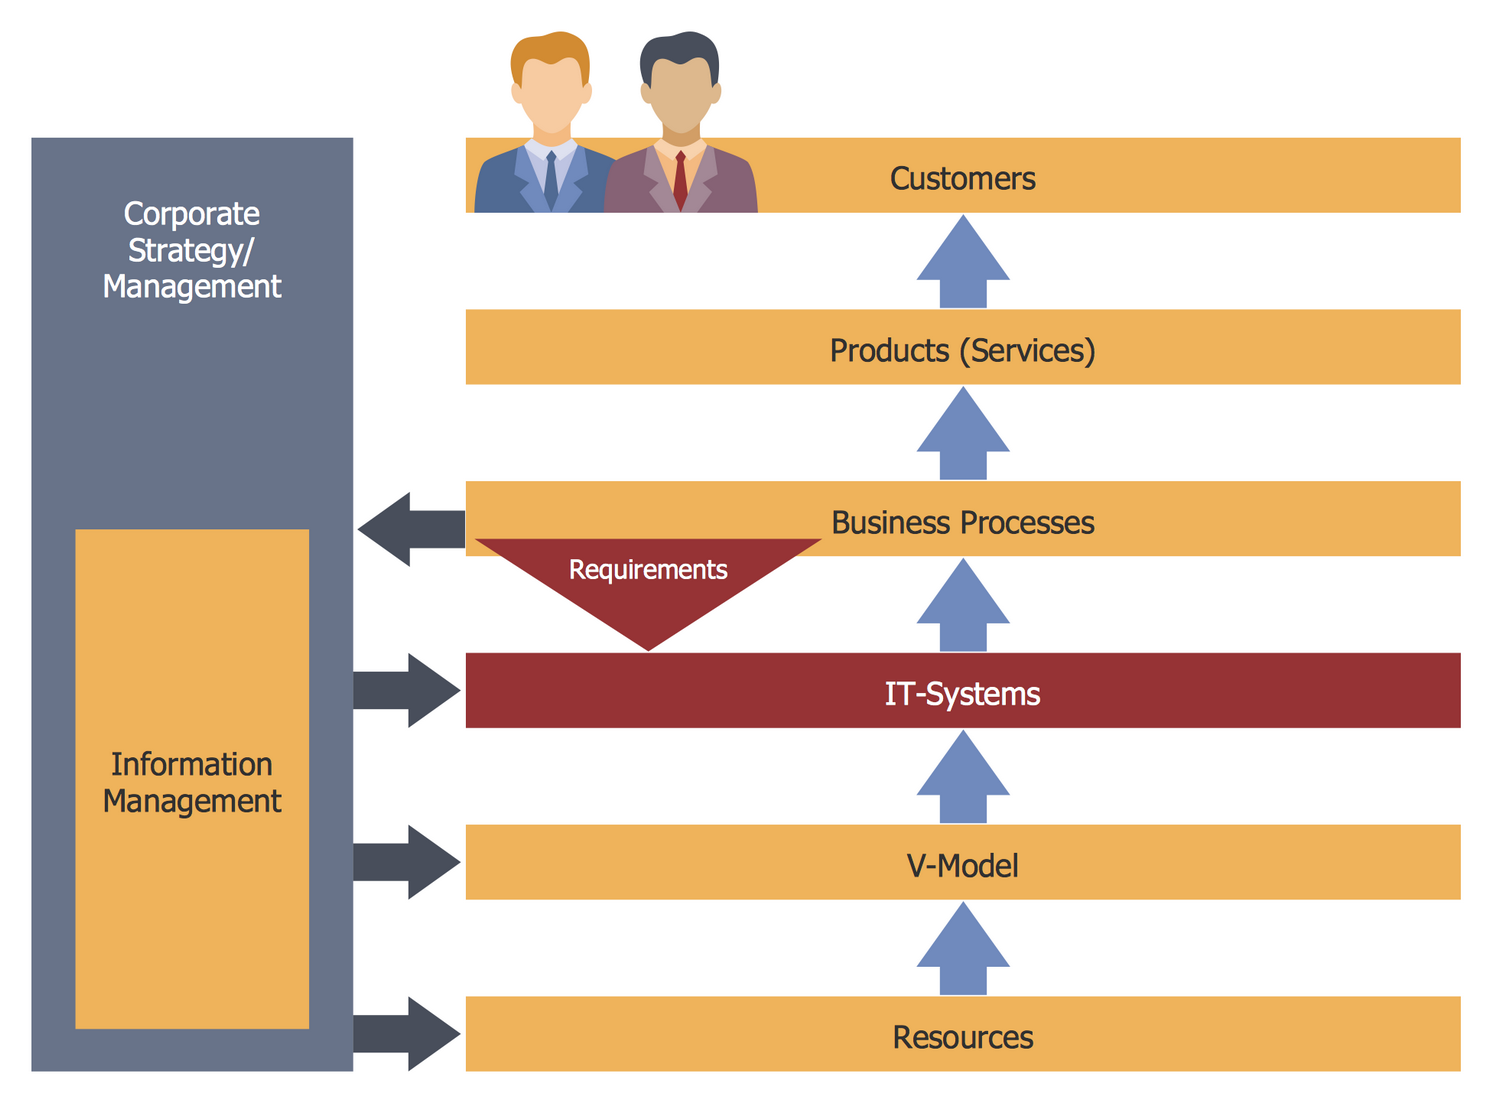
Picture: Business Process Optimization
Related Solution:
Competitor analysis is a first and obligatory step in elaboration the proper corporate marketing strategy and creating sustainable competitive advantage. Use powerful opportunities of numerous solutions from ConceptDraw Solution Park for designing illustrative diagrams, charts, matrices which are necessary for effective competitor analysis.
Picture: Competitor Analysis
Related Solution:
Use ConceptDraw Value Stream Maps (VSM) visualization for a manufacturing plant the material and information flow required to deliver a product or service to customers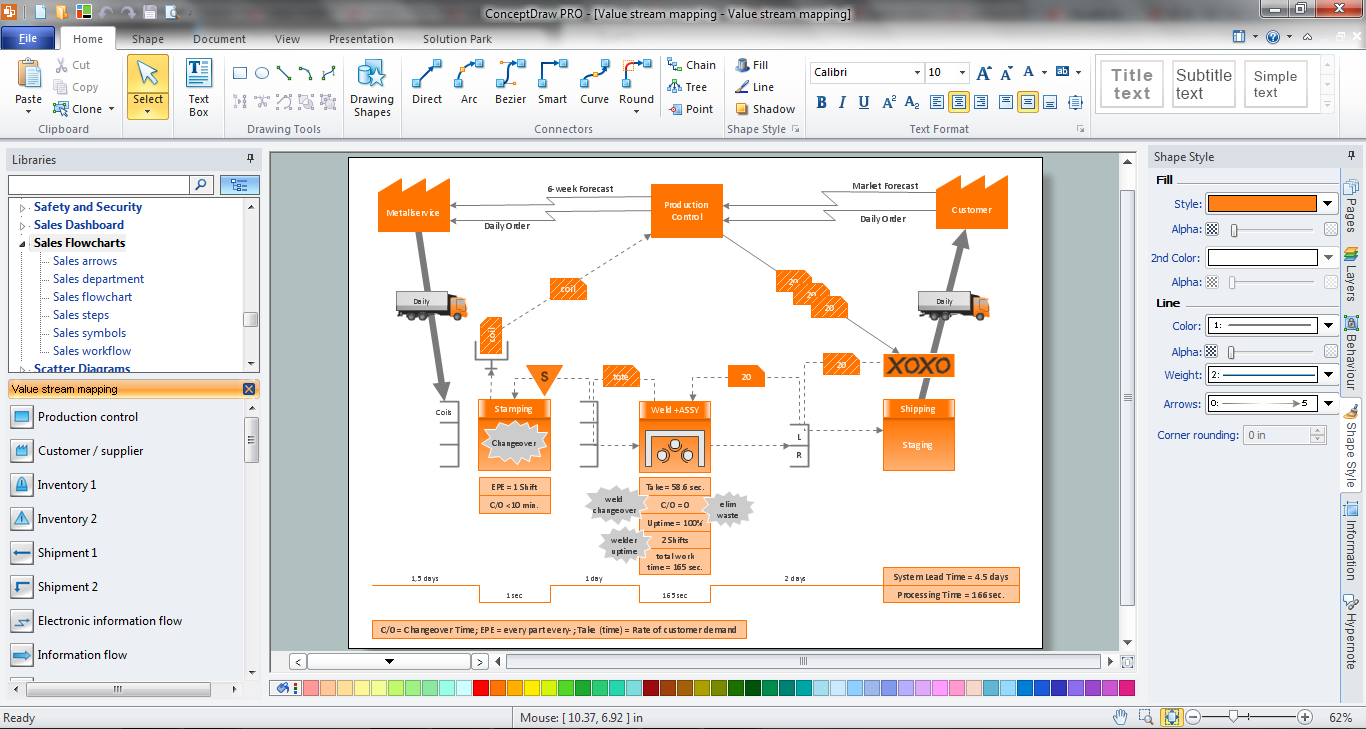
Picture: Value Stream Mapping
Related Solution:
The calendars around us everywhere in the modern world. There are a lot of calendar types, each of them has its own assignment: Business calendar, Personal calendar, Economic calendar, Financial calendar, Daily calendar, Monthly calendar, and many other useful calendar types. ConceptDraw DIAGRAM offers you the possibility to make your own unique calendars on the base of the Blank Calendar Template which is included to the Calendars Solution from the Management Area.
Picture: Blank Calendar Template
Related Solution:
Analyze the root causes of factors that influence the problem. A diagram is constructed separately for each high priority factor.
Identify the root causes for a factor and then list possible corrective action.
The diagram displays the structure of causes for a factor and possible corrective actions.
The Root Cause Tree Diagram is used for further formulation of actions.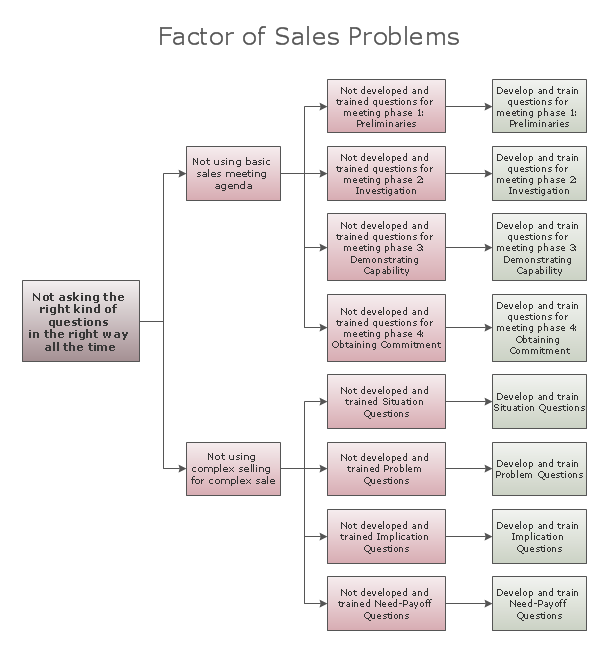
Picture: Root Cause Tree Diagram
Related Solution:
An onion diagram is a kind of chart that shows the dependencies among parts of an organization or process. The chart displays items in concentric circles, where the items in each ring depend on the items in the smaller rings. The Onion Diagram is able to show layers of a complete system in a few circles.
But how to create Onion Diagram? Now, it's very easy thanks to the ConceptDraw DIAGRAM diagramming and vector drawing software extended with Stakeholder Onion Diagrams Solution from the Management Area of ConceptDraw Solution Park.
Picture: How To Create Onion Diagram
Related Solution:
While creating flowcharts and process flow diagrams, you should use special objects to define different statements, so anyone aware of flowcharts can get your scheme right. There is a short and an extended list of basic flowchart symbols and their meaning. Basic flowchart symbols include terminator objects, rectangles for describing steps of a process, diamonds representing appearing conditions and questions and parallelograms to show incoming data.
This diagram gives a general review of the standard symbols that are used when creating flowcharts and process flow diagrams. The practice of using a set of standard flowchart symbols was admitted in order to make flowcharts and other process flow diagrams created by any person properly understandable by other people. The flowchart symbols depict different kinds of actions and phases in a process. The sequence of the actions, and the relationships between them are shown by special lines and arrows. There are a large number of flowchart symbols. Which of them can be used in the particular diagram depends on its type. For instance, some symbols used in data flow diagrams usually are not used in the process flowcharts. Business process system use exactly these flowchart symbols.
Picture: Flowchart Symbols: Meaning and Examples
Related Solution:
Biology solution offers 3 libraries of ready-to-use predesigned biology symbols and vector clipart to make your biology drawing and biology illustration making fast and easy: Carbohydrate Metabolism Library, Biochemistry of Metabolism Library, Citric Acid Cycle (TCA Cycle) Library.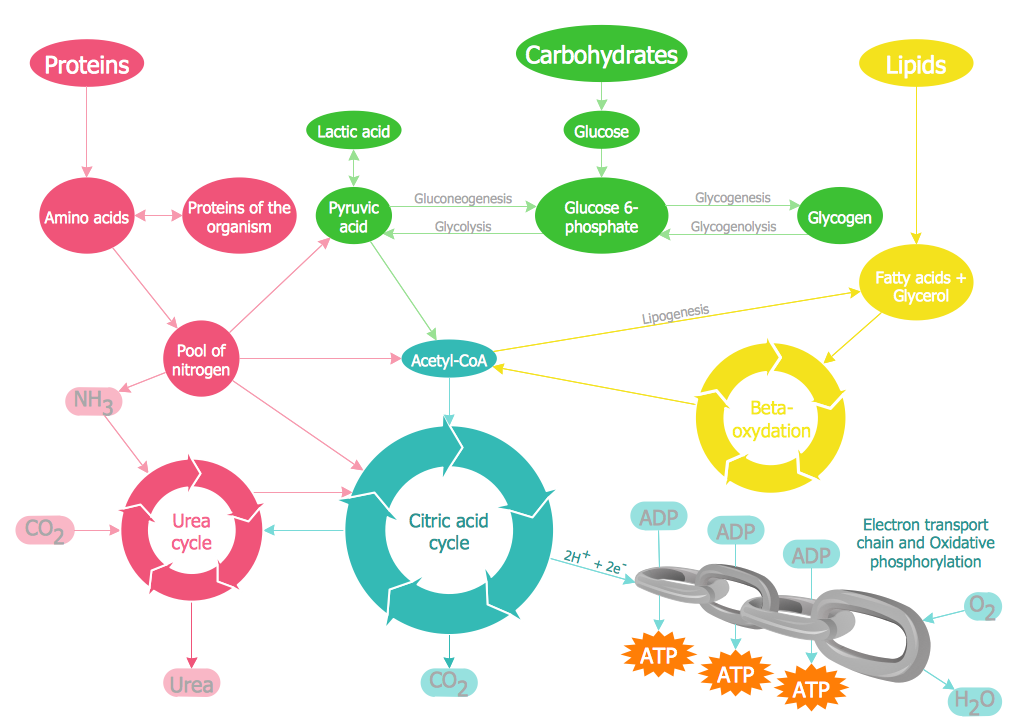
Picture: Biology Illustration
Related Solution:
Nodes of any computer network are somehow organized in a hierarchy or a layout. Some of the common layouts like star network topology are more reliable and some like ring topology withstand high loads better. It is also important to distinguish logical topologies from physical.
This diagram represents a typical view of the star network topology. The star network topology is one of the most frequently used network topologies in the majority of office and home networks. It is very popular because of its low cost and the easy maintenance. The plus of the star network topology is that if one computer on the local network is downed, this means that only the failed computer can not send or receive data. The other part of the network works normally. The minus of using star network topology is that all computers are connected to a single point-switch, or hub. Thus, if this equipment goes down, the whole local network comes down.
Picture: Star Network Topology
Related Solution:

